Hyperliquid: Local Accumulation Trend Shows The Next Feasible Target For HYPE

bitcoinistPublicado em 2026-03-17Última atualização em 2026-03-17

Resumo

Hyperliquid (HYPE) has reached new highs, with technical analysis indicating a potential continuation of its upward trend. A local accumulation curve formed over several weeks, allowing buyers to absorb supply and stabilize the market. Key resistance levels at $36.50 and $38.50 were breached, turning them into potential support zones. The next target is around $40, contingent on HYPE maintaining its position above these levels. A retest zone near $34–$35 could provide structural confirmation if the market holds. If $36.50 fails, a pullback to the $34–$35 support may occur. The overall trend remains bullish, driven by the earlier accumulation phase.

Hyperliquid (HYPE) has climbed to fresh highs for the first time since November, bringing the market’s focus to the next potential price target. Recent chart analysis shared by @ArdinNSC on X points to a developing continuation structure built on a local accumulation trend. With multiple upside levels already cleared, the technical framework now centers on whether the market can extend the move toward the next target.

Accumulation Curve Structure Drives Breakout Momentum

The chart posted by Ardin highlights a clear local accumulation curve that developed over several weeks. Instead of reversing sharply, Hyperliquid (HYPE) formed a rounded structure where price gradually transitioned from decline into recovery. This curved formation reflected a prolonged phase where buyers steadily absorbed supply, allowing the market to stabilize before advancing.

As the accumulation process matured, HYPE’s price began pushing into higher levels that had previously acted as resistance. The first notable level sat near $36.50. Once this barrier was cleared, the upward move accelerated toward the next target positioned around $38.50.

Both levels were taken out within a short period, confirming that the earlier consolidation phase had evolved into a stronger expansion move. The breakout also coincided with price following the upward arc of the accumulation curve, reinforcing the idea that the structure served as a base for continuation rather than a temporary rebound.

With these resistance levels now behind the market, the chart shows Hyperliquid (HYPE) trading above them, effectively transforming former barriers into areas that could now support price during any short-term pullbacks.

Hyperliquid (HYPE) Retest Zone Holds Key To $40 Target

With the initial targets already reached, attention has shifted to whether Hyperliquid (HYPE) can sustain its position above newly reclaimed levels. The chart outlines a highlighted retest zone slightly below the current price, marking an area where the market may revisit if momentum cools.

Source: X

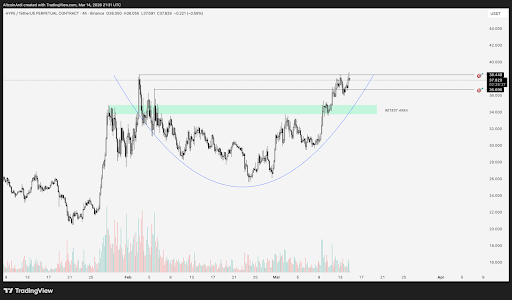
This region sits around the mid $34 range and represents the zone where earlier resistance could now act as support. In technical market behavior, such retests often serve as confirmation that a breakout is structurally sound.

If the market maintains stability above this support area, Hyperliquid’s (HYPE) accumulation curve suggests the trend may still have room to extend higher. Under this scenario, the next feasible upside objective identified in the analysis appears near the $40 level and potentially beyond.

At the same time, the chart outlines a secondary path for Hyperliquid (HYPE) if the market weakens. Losing the $36.50 level could trigger a move back toward a support zone around $34 to $35, where the chart suggests price may return for a structural retest if $36.50 fails.

For now, the structure remains centered on whether price can hold above recently reclaimed levels. Maintaining that footing keeps Hyperliquid’s (HYPE) pathway toward a $40 target aligned with the continuation structure that emerged from the earlier accumulation trend.

Price continues toward $40 | Source: HYPEUSDT on Tradingview.com

Perguntas relacionadas

QWhat is the main technical pattern identified in the Hyperliquid (HYPE) chart analysis by @ArdinNSC?

AThe main technical pattern identified is a local accumulation curve, a rounded structure where price gradually transitioned from decline into recovery, indicating buyers steadily absorbed supply to form a base for continuation.

QWhat were the first two key resistance levels that HYPE cleared during its recent breakout?

AThe first key resistance level cleared was near $36.50, and the next level cleared was around $38.50.

QAccording to the analysis, what is the next feasible upside price target for Hyperliquid (HYPE) if the current structure holds?

AThe next feasible upside price target is near the $40 level and potentially beyond.

QWhat is the significance of the retest zone identified in the mid $34 range?

AThe retest zone around the mid $34 range is significant because it represents an area where earlier resistance could now act as support, and holding above it would signal the breakout is structurally sound.

QWhat potential downside scenario is outlined if HYPE fails to hold the $36.50 level?

AIf HYPE fails to hold the $36.50 level, it could trigger a move back toward a support zone around $34 to $35 for a structural retest.

Leituras Relacionadas

Bitcoin's 'Rally Ends,' Officially Entering the Later Stage of a Bear Market?

Bitcoin prices declined 13% this week, reversing the recent rebound and signaling a likely transition into the later stages of a bear market. Key on-chain metrics deteriorated, with the short-term holder cost basis falling below the Realized Price—a pattern last seen in early 2022, characteristic of bear market maturity. The rally to ~$82k proved to be a bear market bounce, as evidenced by the 90-day realized profit/loss ratio failing to sustain above the bullish threshold of 2. Daily realized losses surged to $1.35B, including significant selling from long-term holders who accumulated near cycle tops, indicating ongoing supply redistribution. Price was rejected almost precisely at the aggregate US spot ETF cost basis of ~$83k, turning that level into resistance and leaving the average ETF investor underwater again. Spot market selling pressure intensified, with the 7-day volume delta turning significantly negative to its weakest level since February. While a major long liquidation event cleared over $400M in leverage, spot demand has not yet stepped in to absorb the resulting supply. Options markets continue pricing in higher future volatility (elevated volatility risk premium) and maintain a skew toward put options, reflecting persistent demand for downside protection, though not yet panic. Overall, market structure remains fragile. Sustained recovery likely requires a reclaim of the ETF cost basis, a shift back to positive spot demand, and a slowdown in realized loss-taking. Until then, the market risks further downside or extended consolidation within the broader bear trend.

Foresight NewsHá 49m

Bitcoin's 'Rally Ends,' Officially Entering the Later Stage of a Bear Market?

Foresight NewsHá 49m

How Risky is the "Death Spiral" of MSTR and STRC?

Summary: This article explores the perceived "death spiral" risk between MicroStrategy (MSTR), its Bitcoin holdings, and its perpetual preferred stock (STRC), drawing comparisons to the LUNA-UST collapse. While both systems feature price anchors, high yields for holders, and potential feedback loops, their core mechanisms differ fundamentally. The MSTR-STRC structure relies on continuous financing to sustain its high dividend payouts, primarily through stock ATM offerings. A negative feedback cycle could occur: falling MSTR stock price makes raising equity capital harder, increasing pressure to sell Bitcoin, which undermines STRC confidence and further depresses MSTR. However, unlike LUNA-UST's automated, direct linkage, the MSTR-STRC loop is weaker and has brakes: STRC dividends can be deferred or rates lowered, and STRC holders have a $100/share liquidation preference in bankruptcy, providing a price floor. The company's sustainability hinges on its ability to continue financing. Its current ~$900 million USD reserves cover only about 6.3 months of its ~$1.71 billion annual interest/dividend burden. The next six months are critical, aligning with both the potential bottom in Bitcoin's four-year cycle and the depletion timeline of its reserves. While a LUNA-style catastrophic collapse is deemed highly unlikely due to structural differences, the key question is whether MicroStrategy can navigate this period through healthy deleveraging to restart its capital engine.

Foresight NewsHá 1h

How Risky is the "Death Spiral" of MSTR and STRC?

Foresight NewsHá 1h

Trading

Spot
Futuros

Artigos em Destaque

Como comprar HYPE

Bem-vindo à HTX.com!Tornámos a compra de Hyperliquid (HYPE) simples e conveniente.Segue o nosso guia passo a passo para iniciar a tua jornada no mundo das criptos.Passo 1: cria a tua conta HTXUtiliza o teu e-mail ou número de telefone para te inscreveres numa conta gratuita na HTX.Desfruta de um processo de inscrição sem complicações e desbloqueia todas as funcionalidades.Obter a minha contaPasso 2: vai para Comprar Cripto e escolhe o teu método de pagamentoCartão de crédito/débito: usa o teu visa ou mastercard para comprar Hyperliquid (HYPE) instantaneamente.Saldo: usa os fundos da tua conta HTX para transacionar sem problemas.Terceiros: adicionamos métodos de pagamento populares, como Google Pay e Apple Pay, para aumentar a conveniência.P2P: transaciona diretamente com outros utilizadores na HTX.Mercado de balcão (OTC): oferecemos serviços personalizados e taxas de câmbio competitivas para os traders.Passo 3: armazena teu Hyperliquid (HYPE)Depois de comprar o teu Hyperliquid (HYPE), armazena-o na tua conta HTX.Alternativamente, podes enviá-lo para outro lugar através de transferência blockchain ou usá-lo para transacionar outras criptomoedas.Passo 4: transaciona Hyperliquid (HYPE)Transaciona facilmente Hyperliquid (HYPE) no mercado à vista da HTX.Acede simplesmente à tua conta, seleciona o teu par de trading, executa as tuas transações e monitoriza em tempo real.Oferecemos uma experiência de fácil utilização tanto para principiantes como para traders experientes.

291 Visualizações TotaisPublicado em {updateTime}Atualizado em 2026.06.02

Como comprar HYPE

Discussões

Bem-vindo à Comunidade HTX. Aqui, pode manter-se informado sobre os mais recentes desenvolvimentos da plataforma e obter acesso a análises profissionais de mercado. As opiniões dos utilizadores sobre o preço de HYPE (HYPE) são apresentadas abaixo.

活动图片