How Did the Target Price of 116 Yuan and a Market Cap of 7.9 Trillion for CXMT Come About?

链捕手Publicado em 2026-07-27Última atualização em 2026-07-27

Resumo

Nomura's inaugural coverage report on ChangXin Memory Technologies (CXMT) gives a 'Buy' rating with a highly aggressive target price of 116 RMB, implying a 1239.5% upside from the IPO price of 8.66 RMB. The valuation is derived by applying a 20x P/E multiple to projected 2028 EPS of 5.79 RMB. The 20x multiple combines Micron's historical valuation with a premium for Chinese A-shares. The report's financial forecasts are exceptionally bullish. It projects revenue to soar from 62B RMB in 2025 to 773B RMB in 2028, with net profit surging to 393B RMB. A key, and arguably unsustainable, assumption is gross margin expanding to over 90% by 2028, driven almost entirely by price increases with minimal cost growth. This optimism is rooted in a forecast that global DRAM demand will grow over 7x from 2026 to 2030 (CAGR >60%), fueled by agentic AI. Nomura argues that supply growth (30-40% CAGR) will lag far behind demand, creating a persistent shortage. Bottlenecks in cleanroom space, equipment, materials, and skilled engineers will constrain rapid industry expansion. For CXMT, Nomura expects capacity to reach 550k wafers/month by 2028. The company's bit output is forecast to grow 40-45% annually, allowing its global market share to rise from ~10% to ~18%. While CXMT's technology lags leaders by about five years, limiting its wafer ASP, it benefits from supportive domestic procurement policies. Key risks include the cyclicality of memory pricing, with the 90% margin assumption represen...

Author: Fourth Dimension's Dream

Today, Nomura issued its first coverage report on ChangXin Memory Technologies (CXMT), with a Buy rating and a target price of 116 yuan. The report's cover page also notes the offering price of 8.66 yuan and an implied upside potential of +1239.5%. As of now, this is the highest target price I have seen from a foreign institution for CXMT, making it arguably the most aggressive valuation report currently on the market.

I. How Was the 116 Yuan Figure Calculated?

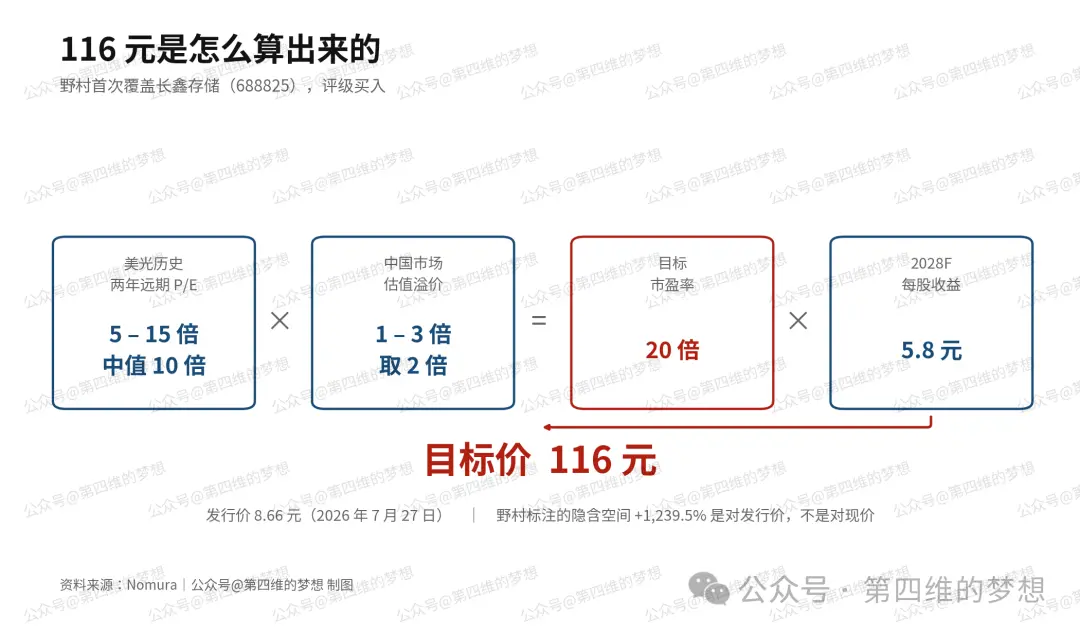
Valuing 20 times the projected 2028 earnings per share of 5.8 yuan results in a target price of 116 yuan.

The key is the anchor of 20 times. Nomura's derivation is a two-step process. First, selecting Micron as the benchmark. Nomura believes Micron is CXMT's closest competitor, and Micron's two-year forward price-to-earnings ratio (P/E) has historically fluctuated roughly between 5x and 15x over the past five years, with a median of 10x. Second, adding a valuation premium for the Chinese market. Nomura used a comparison sample: ACM Research Shanghai versus its US-listed parent company ACM Research. The same business trades at a P/E ratio in the A-share market that is consistently 1 to 3 times that of its US counterpart. Based on this, Nomura assumes CXMT will also trade at 1 to 3 times Micron's valuation. This corresponds to a range of 10x to 30x, with a median of 20x.

Therefore, the figure of 116 yuan essentially equals Micron's historical median valuation multiplied by the Chinese market premium coefficient, multiplied by Nomura's own 2028 earnings forecast.
II. Nomura's Earnings Forecast: Aggressive, to Say the Least

Operating Revenue: 2025 actual 61.799 billion yuan, 2026 forecast 290.666 billion yuan, 2027 560.788 billion yuan, 2028 773.323 billion yuan.

Net Profit Attributable to Parent Company: 2025 actual 1.875 billion yuan, 2026 forecast 130.315 billion yuan, 2027 277.248 billion yuan, 2028 393.070 billion yuan.

Nomura thus projects a compound annual growth rate (CAGR) from 2026 to 2028 of 63% for revenue and 74% for net profit attributable to the parent. Diluted earnings per share would grow from 2.05 yuan in 2026 to 5.79 yuan in 2028.

Calculated based on the offering price of 8.66 yuan, the corresponding P/E ratios are 4.2x for 2026, 2.1x for 2027, and 1.5x for 2028. The 2028 price-to-book ratio (P/B) is 0.6x. This means if Nomura's model holds true, buyers at the IPO price would receive book equity value more than double their investment in three years. Return on equity (ROE) in 2026 is 84%. By the end of 2028, cash on hand is projected at 1,085.5 billion yuan, with net cash at 933.5 billion yuan.

One detail that can easily be missed must be added here. Nomura forecasts post-tax net profit for 2026 at 173.753 billion yuan, but 43.438 billion yuan is deducted for minority interests, leaving only 130.315 billion yuan attributable to the parent. CXMT's equity structure includes a substantial portion of minority interests, which Nomura's model consistently maintains at around 25%. When looking at CXMT's profit, one must look at the line for net profit attributable to the parent, otherwise it will be overestimated by a quarter.

Next is what the author would like to point out: the most aggressive assumption in Nomura's model lies in gross margin. CXMT's gross margin was 41.0% in 2025, while Nomura forecasts 83.7% for 2026, 89.2% for 2027, and 90.5% for 2028.

How can it reach 90%? Because in this table, operating costs are almost stagnant. Operating costs were 36.465 billion yuan in 2025, forecasted to be 47.451 billion yuan in 2026, and 73.560 billion yuan in 2028. Revenue grew from 61.799 billion yuan to 773.323 billion yuan over the same period.In three years, revenue multiplied by 12.5 times, while operating costs only doubled.

In other words, Nomura assumes that almost all of CXMT's increased revenue in these years comes from price increases rather than additional spending, and the increased prices almost entirely fall into profits. There are precedents for this in the memory industry's upcycle, where price elasticity indeed far exceeds cost elasticity. However, extrapolating this all the way to 2028 and a 90% gross margin treats the best part of the cycle as the new normal.

III. Demand Side: Nomura Says Memory Usage Will Increase More Than Sevenfold in the Next Five Years

Supporting the above table is Nomura's judgment on memory demand. Nomura's starting point is agentic AI. The report breaks down an intelligent agent task into eight stages: user request arrival, model weight loading, pre-fill, inference planning, tool calling, context integration, multi-step iteration, and response generation.

The key lies in the sixth and seventh steps. Each time an external tool is called, the returned result must be re-integrated into the context, and the model must reprocess the lengthened context, causing the KV cache to swell. The agent will repeatedly run the cycle of "inference – call tool – integrate," and with each cycle, the context grows longer. Nomura judges thatthe peak memory pressure appears during the seventh step of multi-step iteration, potentially approaching the capacity limits of HBM.

Nomura thus proposes a multiplicative structure: memory demand equals the product of user count, usage duration, task complexity, inference token consumption, and agent penetration rate. A multiplicative relationship means that even moderate growth in individual factors leads to exponential amplification of the total. Nomura's estimate is thatby 2030, the number of concurrently executable intelligent agent tasks globally will be 50 times higher than in 2026.

On the other hand, there is the non-negligible improvement in technological efficiency. Nomura specifically evaluated memory efficiency techniques: KV quantization, Grouped Query Attention (GQA), PagedAttention, prefix caching, Multi-Head Latent Attention (MLA), etc. These technologies can be multiplicative, theoretically compressing memory usage by 4 to 40 times. However, Nomura believesthe actual savings are unlikely to exceed 5 times. Because the largest single source of compression is the quantization of weights and KV, i.e., reducing from FP32/FP16 to INT8/INT4, which itself has a precision floor, while other methods are complementary.

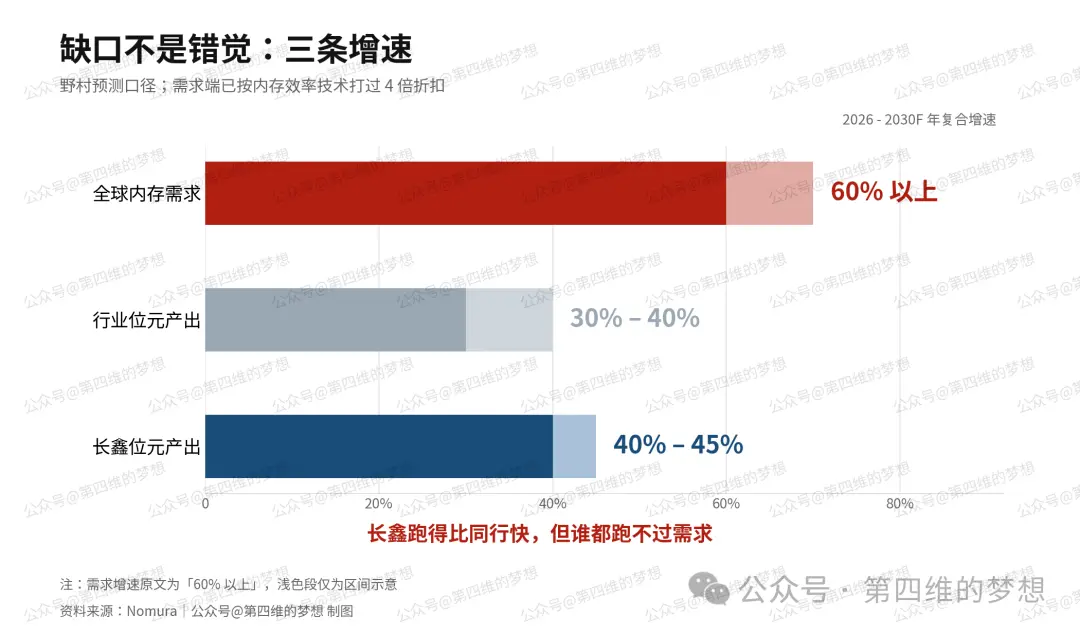
Offsetting both sides, Nomura concludes. Even after discounting for 4x efficiency gains,global memory usage from 2026 to 2030 will still grow more than 7 times, with a CAGR exceeding 60%, and this is calculated under the assumption of zero growth for non-AI applications.

Nomura also cites supporting evidence. Cloudflare's CEO publicly stated that for the first time in internet history, bot traffic has exceeded human traffic. Nomura follows up with a qualitative question: If AI no longer requires human instruction for each task and can run tasks continuously, where is the ceiling for demand? Nomura's answer is that the constraints would then be only three: whether humans are willing to authorize (security concerns), whether infrastructure is sufficient (power, chips, data centers, and most importantly, talent), and the capital expenditure limits of cloud providers and enterprises.

IV. Supply Side: Wanting to Catch Up, But Unable

What is the flip side of demand growing at over 60% CAGR? Nomura estimates that the global memory manufacturers' bit output CAGR will only be 30% to 40%, resulting in a persistent supply-demand gap.

Worse, this gap cannot be filled just by spending more money. Nomura points to bottlenecks: clean rooms, equipment, materials, and, most critically, people. Semiconductor capacity expansion is hitting these walls, with skilled engineers being the most difficult to create quickly.

Nomura also discusses mitigation measures, such as using NAND for offloading, with capacities over 100 times that of DRAM, at the cost of being slower, advancing High Bandwidth Flash (HBF). But Nomura also bluntly states that HBF is not yet ready for mass production, and large-scale replacement with NAND would only tighten NAND supply as well, offering limited relief for DRAM tightness. Nomura's original words: these schemes only slow the trend, not reverse it.

Addressing the market's biggest concern about a cyclical reversal due to frantic capacity expansion by manufacturers, Nomura offers a counterargument. Over the past 15 years, the DRAM industry's capital intensity (capex as % of revenue) mostly ranged between 25% and 45%. However, due to the explosive growth in market size driven by AI demand since September 2025,this ratio may drop to only about 15% in 2026. In other words, measured by historical standards, current industry investment is relatively low compared to market size, and the market can absorb far higher capital expenditure than current levels.

However, Nomura also mentions that as memory prices have surged since September 2025, both manufacturers and customers will gradually realize that stable prices are healthier. Long-term agreements (LTAs) are being signed. Starting in 2028, Nomura believes memory manufacturers will shift their focus from pushing prices to reasonable capacity expansion.

V. CXMT Itself: Capacity, Market Share, Yield, and Price

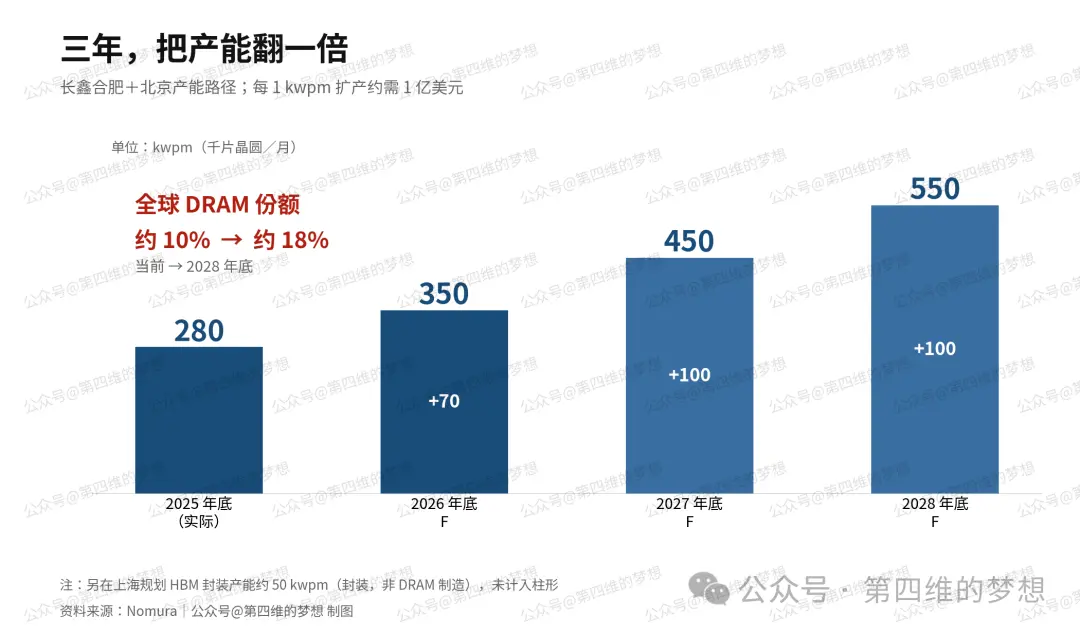
Returning to the company itself. The capacity roadmap Nomura provides is as follows: By the end of 2025, Hefei and Beijing combined have about 280 kwpm (thousand wafer starts per month). It increases to 350 kwpm by the end of 2026. Another 100 kwpm is added each in 2027 and 2028, reaching 550 kwpm by the end of 2028. Additionally, HBM packaging capacity is being built in Shanghai, with a potential scale of 50 kwpm. This part is for packaging, not DRAM manufacturing.

How much will expansion cost? Nomura's rule of thumb is thatroughly $100 million is needed per 1 kwpm of DRAM capacity. CXMT raised 57.9 billion yuan in its July 27th IPO on the STAR Market. If the over-allotment option (greenshoe) is fully exercised, the maximum could reach 66.6 billion yuan.

Assuming full capacity operation, Nomura calculates that CXMT's wafer shipment CAGR from 2026 to 2030 will be 20% to 25%. Additionally, with process node advancement every two years,bit output CAGR will be 40% to 45%.

Industry bit growth: 30% to 40%. CXMT growth: 40% to 45%. Demand growth: over 60%. CXMT runs faster than its peers, but still cannot keep up with demand. Therefore, Nomura's conclusion is thatCXMT will continuously take market share from global peers, while the entire industry remains short-supplied.
The market share target is to increase from the current approximately 10% to about 18% of the global DRAM market by the end of 2028. For reference, Nomura mentions Micron's share is above 20%, with a market capitalization of $960 billion as of July 20, 2026.
Technologically, Nomura estimates CXMT's mainstream process in 2026 is at the 1x-1y node (approximately 16-17nm), with DDR5 yield around 80% and DDR4 yield above 90%. From 2027 onward, it will advance to the 1z-1a node (approximately 10-15nm) and have HBM3 mass-production capability. The entire process does not use EUV, relying on DUV advancement.

Regarding HBM, Nomura mentions that CXMT has already sent HBM3 samples to a leading domestic ICT company and others, but certification takes time. HBM3e is still under development.

The pricing section is what the author finds most informative. Results from Nomura's channel checks with leading domestic mobile phone and PC/server manufacturers indicate that CXMT's quotations are lower than those of overseas leaders, but not by a large margin—about 0% to 20% lower. The main reason is the presence of policy factors supporting local procurement.

However, the cost gap is real. Nomura estimates that, due to being about five years behind overseas leaders in mainstream process technology, CXMT's number of good die per wafer is only a few hundred, while overseas leaders exceed a thousand. Therefore, CXMT's average selling price per wafer (wafer ASP) in 2026 is only about $14,000 to $15,000. As the process migrates from 16-17nm to 14-15nm from 2027 to 2028, increasing bits per wafer, Nomura expects this figure to rise to $21,000 to $25,000.

Another background figure. According to WSTS, China accounted for about 25% of the global DRAM market in 2025. However, Nomura estimates the global share of domestic manufacturers (including CXMT and others) in terms of output value is only about 10%. This means the self-sufficiency rate of domestic DRAM is only around 30%. This is the direct basis for Nomura's belief that CXMT still has significant market share to capture in the domestic market.

Customer-wise, over 85% of CXMT's revenue is completed via distributors. The concentration ratio of the top five customers was 68.08% in 2025. IPO materials disclose that end customers include Alibaba Cloud, ByteDance, Tencent, Lenovo, Xiaomi, Transsion, Honor, OPPO, and Vivo. In terms of product structure, LPDDR series accounted for 66.43% of revenue in 2025, while DDR series accounted for 31.87% (20.16% in 2023). The ramp-up of DDR5 server products is the main reason for this shift.

Nomura also mentions another point: CXMT is collaborating with GigaDevice on DRAM-on-logic wafer-on-wafer (WoW) stacking for edge AI scenarios like automotive smart cockpits, high-end mobile phones/PCs, and robotics. Nomura believes this technology will start gaining significant momentum from the end of 2027.

In the author's opinion, the assumption of a 90% gross margin mentioned earlier is clearly unsustainable. Extrapolating the cyclical peak directly as a long-term norm itself contradicts the operating patterns of the memory industry. Therefore, the correct way to interpret this is to not view the profit assumptions and target price therein as long-term benchmarks, but rather as an upper-limit calculation under conditions of extreme supply-demand tightness and simultaneously optimistic price and profitability.


Logic and Technology, We Are Still on the Journey!

Criptomoedas em alta

Perguntas relacionadas

QHow did Nomura arrive at the target price of 116 yuan for CXMT?

ANomura's target price of 116 yuan for ChangXin Memory Technologies (CXMT) was calculated by applying a 20x P/E multiple to their forecasted 2028 EPS of 5.8 yuan. This 20x multiple was derived by first establishing a base of 10x, which is the median two-year forward P/E of competitor Micron over the past five years. They then applied a 'China market premium' multiplier of 1x to 3x, based on the valuation differential between ACM Research's Shanghai-listed entity and its U.S.-listed parent, taking the midpoint of 20x.

QWhat are the most aggressive assumptions in Nomura's earnings forecast for CXMT?

AThe most aggressive assumptions in Nomura's forecast are related to gross margin and cost growth. They project CXMT's gross margin to rise from 41.0% in 2025 to 90.5% by 2028. This is based on the assumption that revenues will grow 12.5x by 2028 while cost of revenue only doubles. This effectively models a scenario where price increases contribute almost entirely to profit, extending the peak conditions of a memory upcycle indefinitely, which the article's author criticizes as unsustainable.

QWhat is Nomura's core argument for sustained strong DRAM demand growth through 2030?

ANomura's core argument centers on 'agentic AI'—AI agents that perform multi-step tasks autonomously. They model demand as a multiplicative function of user numbers, usage time, task complexity, token consumption, and agent penetration. Even after accounting for potential 4x efficiency gains from techniques like KV quantization, Nomura concludes that global DRAM bit consumption will still grow over 7x from 2026 to 2030, representing a CAGR exceeding 60%, assuming zero growth from non-AI applications.

QWhat are the key bottlenecks preventing the DRAM supply from catching up with demand, according to Nomura?

ANomura identifies several key bottlenecks limiting DRAM supply expansion: cleanroom capacity, semiconductor equipment, materials, and most critically, a shortage of skilled engineers. They argue that these are not constraints that can be quickly resolved with capital. Additionally, while solutions like using NAND (via HBM) exist, they are not yet ready for mass production and would only shift the supply shortage to another component.

QHow does Nomura justify CXMT gaining global market share despite aggressive industry-wide demand?

ANomura justifies CXMT's market share gains through a relative growth rate comparison. They estimate global DRAM bit supply growth at a 30-40% CAGR, while CXMT's bit output is projected to grow at a 40-45% CAGR, driven by a 20-25% increase in wafer shipments and a biennial process node migration. Since overall AI-driven demand is forecast to grow at >60% CAGR, the market can absorb both industry growth and CXMT's faster expansion. Thus, CXMT gains share from competitors while the entire industry remains in a supply deficit.

Leituras Relacionadas

Must-Watch Events Next Week|CLARITY Act Could Face Senate Vote; SpaceX, Circle to Report Earnings (8.3-8.9)

**Summary: Key Events and Developments to Watch (August 3-9)** The upcoming week is marked by significant financial disclosures, key legislative deadlines, and notable product updates. **Major Financial Events:** Several companies are scheduled to release their Q2 2026 earnings. American Bitcoin (ABTC) will report on August 3, followed by SpaceX and Hut 8 Mining Corp. on August 4, and Circle on August 5. Notably, a significant portion of SpaceX shares (up to 12% of total shares) will be unlocked on August 6 following their earnings release. **Key Legislative Deadline:** The U.S. Senate faces an August 7 deadline to secure 60 votes for the CLARITY Act, a bipartisan bill aiming to establish a federal regulatory framework for cryptocurrencies. The Senate may hold a full vote on the bill during the week. **Economic Data:** The U.S. July Non-Farm Payrolls report will be released on August 7, providing crucial labor market data. **Technology & Product Updates:** * **Shutdowns:** DeFi portfolio tracker Zapper and wallet app Ctrl Wallet will cease operations on August 3. * **Upgrades:** LayerZero will deprecate its v1 relayers on August 3. XRP Ledger's new version 3.3.0, featuring five new functions, is expected next week. * **AI:** Elon Musk announced that the advanced Grok 4.6 AI model is set for release around August 7. * **Bitcoin:** The BIP-110 forced signaling for a potential Bitcoin network change is scheduled to begin around August 8. **Other Notable Events:** Chinese robotics firm Unitree Tech has set its preliminary price inquiry for its IPO for August 5. South Korean exchange Upbit will delist AQT and AERGO tokens on August 3.

marsbitHá 44m

Must-Watch Events Next Week|CLARITY Act Could Face Senate Vote; SpaceX, Circle to Report Earnings (8.3-8.9)

marsbitHá 44m

Stocks Are Plummeting More Sharply Than Cryptocurrencies. Where Has the Money Gone?

Stock Markets Plunge Deeper Than Cryptocurrencies: Where Did the Money Go? In late July, Seoul's Kospi index triggered circuit breakers for two consecutive days, plummeting over 40% from its June high. The collapse was led by heavyweight stocks like SK Hynix, whose record profits still disappointed investors, and devastating leveraged ETFs, with one major product losing over 83% of its value. This signaled a global, forced deleveraging targeting the most crowded trades. Interestingly, while stocks exhibited extreme volatility akin to crypto markets, Bitcoin rose nearly 15% in July after a prior steep drop. Analysis shows the money fleeing equities did not flow into Bitcoin. Instead, Bitcoin had already absorbed its sell-off in May-June, when U.S. spot Bitcoin ETFs saw historic outflows. The true safe-haven beneficiary was gold, whose price rose over 20% year-on-year, highlighting a decoupling between Bitcoin and gold as "digital gold." The sell-off was a targeted unwinding of leveraged positions in tech and semiconductors, accelerated by broker-dealer risk management and shifts in the AI narrative, including new competition from Chinese memory chipmakers. The retreat path was clear: from high-valuation tech stocks to cash and U.S. Treasuries, then to gold. For Bitcoin to attract sustained institutional inflows, conditions like eased global liquidity pressure, a "soft-landing" Fed rate cut, and U.S. regulatory clarity via legislation like the stalled CLARITY Act are needed. Currently, Bitcoin is not a safe haven but an already-cleared asset. Its low correlation with tech stocks, however, makes it a potential diversification play for institutional portfolios once the storm passes. The money isn't here yet, but the positioning is underway.

marsbitHá 45m

Stocks Are Plummeting More Sharply Than Cryptocurrencies. Where Has the Money Gone?

marsbitHá 45m

In Conversation with Ray Dalio: We Are Currently in an AI Bubble, with 1% of My Portfolio in Bitcoin

Ray Dalio, founder of Bridgewater Associates, warns in an interview that the current AI boom shows classic bubble characteristics, which could lead to significant economic downturns as seen in past cycles like 1929 or 2000. He explains that speculative enthusiasm, fueled by debt and overvaluation, often precedes a crash when rising rates or taxation force asset sales, causing widespread losses and recession. Dalio also outlines his "Big Cycle" theory, describing an approximate 80-year pattern where widening wealth gaps, massive government deficits, and shifting geopolitical power (like China's rise) create internal conflict and global instability. He emphasizes that we are in a late-cycle, transitional phase where traditional powers like the US and UK face decline. For personal wealth protection, Dalio advises diversification beyond cash into assets like stocks, bonds, real estate, and particularly gold, which he prefers over Bitcoin. While he holds about 1% of his portfolio in Bitcoin as a non-printable hard asset, he views gold as more secure from technological or governmental threats. Regarding AI's impact, Dalio believes it will disproportionately benefit capital owners, worsening inequality by replacing both physical and cognitive labor. He suggests that human intuition and emotional intelligence, combined with AI, will be key for future workers. On taxation, Dalio argues that wealth taxes are impractical and risk triggering asset sell-offs, reducing productive investment. He points to the UK as a cautionary example of debt, low productivity, and political strife. Geopolitically, Dalio foresees a more regionalized world, with the US showing weakness in prolonged conflicts like with Iran, akin to past imperial declines. The ideal outcome, he suggests, is coexisting powerful blocs (e.g., Americas, China-Asia Pacific) without major war.

marsbitHá 4h

In Conversation with Ray Dalio: We Are Currently in an AI Bubble, with 1% of My Portfolio in Bitcoin

marsbitHá 4h

Daily 7.2 Trillion KRW: Foreign Capital's Record Net Buying on Friday! Wall Street Says Headwinds for Korean Stock Fund Flows Have Subsided

South Korean stock market sees a dramatic shift in fund flows. On July 31, foreign investors made a record net purchase of approximately KRW 7.2 trillion in KOSPI stocks, marking a fundamental reversal from the persistent large-scale net outflows seen in previous months. This contributed to a significant narrowing of foreign net selling in July to KRW 9.8 trillion, down sharply from KRW 48.4 trillion in June and KRW 44.5 trillion in May. Simultaneously, domestic institutional pressure eased. South Korean pension funds and asset managers turned to a net buying position in July, purchasing KRW 1.0 trillion worth of KOSPI shares, contrasting with net sales in May and June. Market volatility is expected to be dampened by new financial regulations. Effective July 31, the Financial Services Commission tightened access for retail investors to single-stock leveraged ETFs by raising the minimum cash deposit requirement. Trading volumes for these products subsequently dropped to about 50% of their monthly average. Citigroup Research maintains its year-end KOSPI target of 10,000 points. The firm cites several supportive factors: the substantial easing of headwinds from capital outflows, a robust fundamental outlook for the semiconductor sector, historically low market valuations, strong economic fundamentals, and the potential for policy support from financial authorities if needed.

marsbitHá 4h

Daily 7.2 Trillion KRW: Foreign Capital's Record Net Buying on Friday! Wall Street Says Headwinds for Korean Stock Fund Flows Have Subsided

marsbitHá 4h

Trading

Spot

Artigos em Destaque

Como comprar CAP

Bem-vindo à HTX.com!Tornámos a compra de Cap (CAP) simples e conveniente.Segue o nosso guia passo a passo para iniciar a tua jornada no mundo das criptos.Passo 1: cria a tua conta HTXUtiliza o teu e-mail ou número de telefone para te inscreveres numa conta gratuita na HTX.Desfruta de um processo de inscrição sem complicações e desbloqueia todas as funcionalidades.Obter a minha contaPasso 2: vai para Comprar Cripto e escolhe o teu método de pagamentoCartão de crédito/débito: usa o teu visa ou mastercard para comprar Cap (CAP) instantaneamente.Saldo: usa os fundos da tua conta HTX para transacionar sem problemas.Terceiros: adicionamos métodos de pagamento populares, como Google Pay e Apple Pay, para aumentar a conveniência.P2P: transaciona diretamente com outros utilizadores na HTX.Mercado de balcão (OTC): oferecemos serviços personalizados e taxas de câmbio competitivas para os traders.Passo 3: armazena teu Cap (CAP)Depois de comprar o teu Cap (CAP), armazena-o na tua conta HTX.Alternativamente, podes enviá-lo para outro lugar através de transferência blockchain ou usá-lo para transacionar outras criptomoedas.Passo 4: transaciona Cap (CAP)Transaciona facilmente Cap (CAP) no mercado à vista da HTX.Acede simplesmente à tua conta, seleciona o teu par de trading, executa as tuas transações e monitoriza em tempo real.Oferecemos uma experiência de fácil utilização tanto para principiantes como para traders experientes.

212 Visualizações TotaisPublicado em {updateTime}Atualizado em 2026.06.26

Como comprar CAP

Discussões

Bem-vindo à Comunidade HTX. Aqui, pode manter-se informado sobre os mais recentes desenvolvimentos da plataforma e obter acesso a análises profissionais de mercado. As opiniões dos utilizadores sobre o preço de CAP (CAP) são apresentadas abaixo.

活动图片












