On March 1, 2026, global macro markets were hit by an epic "black swan" event: a direct military strike by the United States and Israel against Iran resulted in the death of Iran's Supreme Leader, Ayatollah Khamenei.
This extreme tail-risk event instantly reshaped the risk premium models for global asset classes. The complete ignition of the Middle East powder keg not only triggered violent fluctuations in traditional crude oil and safe-haven assets but also pushed the cryptocurrency market, at a critical juncture of博弈 (game theory/strategic interplay), to a crossroads of liquidity and pricing power.
Combining Binance spot market data with Deribit options data, this analysis provides an in-depth examination of the immediate impact of this geopolitical crisis on the cryptocurrency market from a quantitative and derivatives博弈 perspective, along with a forward-looking projection of future volatility paths and market trends.
The essence of geopolitical conflict is the reshaping of global supply chains, energy prices, and the ensuing inflation expectations. The financial market transmission path of this surprise US-Israel attack on Iran manifested as a textbook risk-aversion pattern: crude oil and gold within commodities became the preferred safe havens, while high-risk assets faced indiscriminate selling in the first instance.
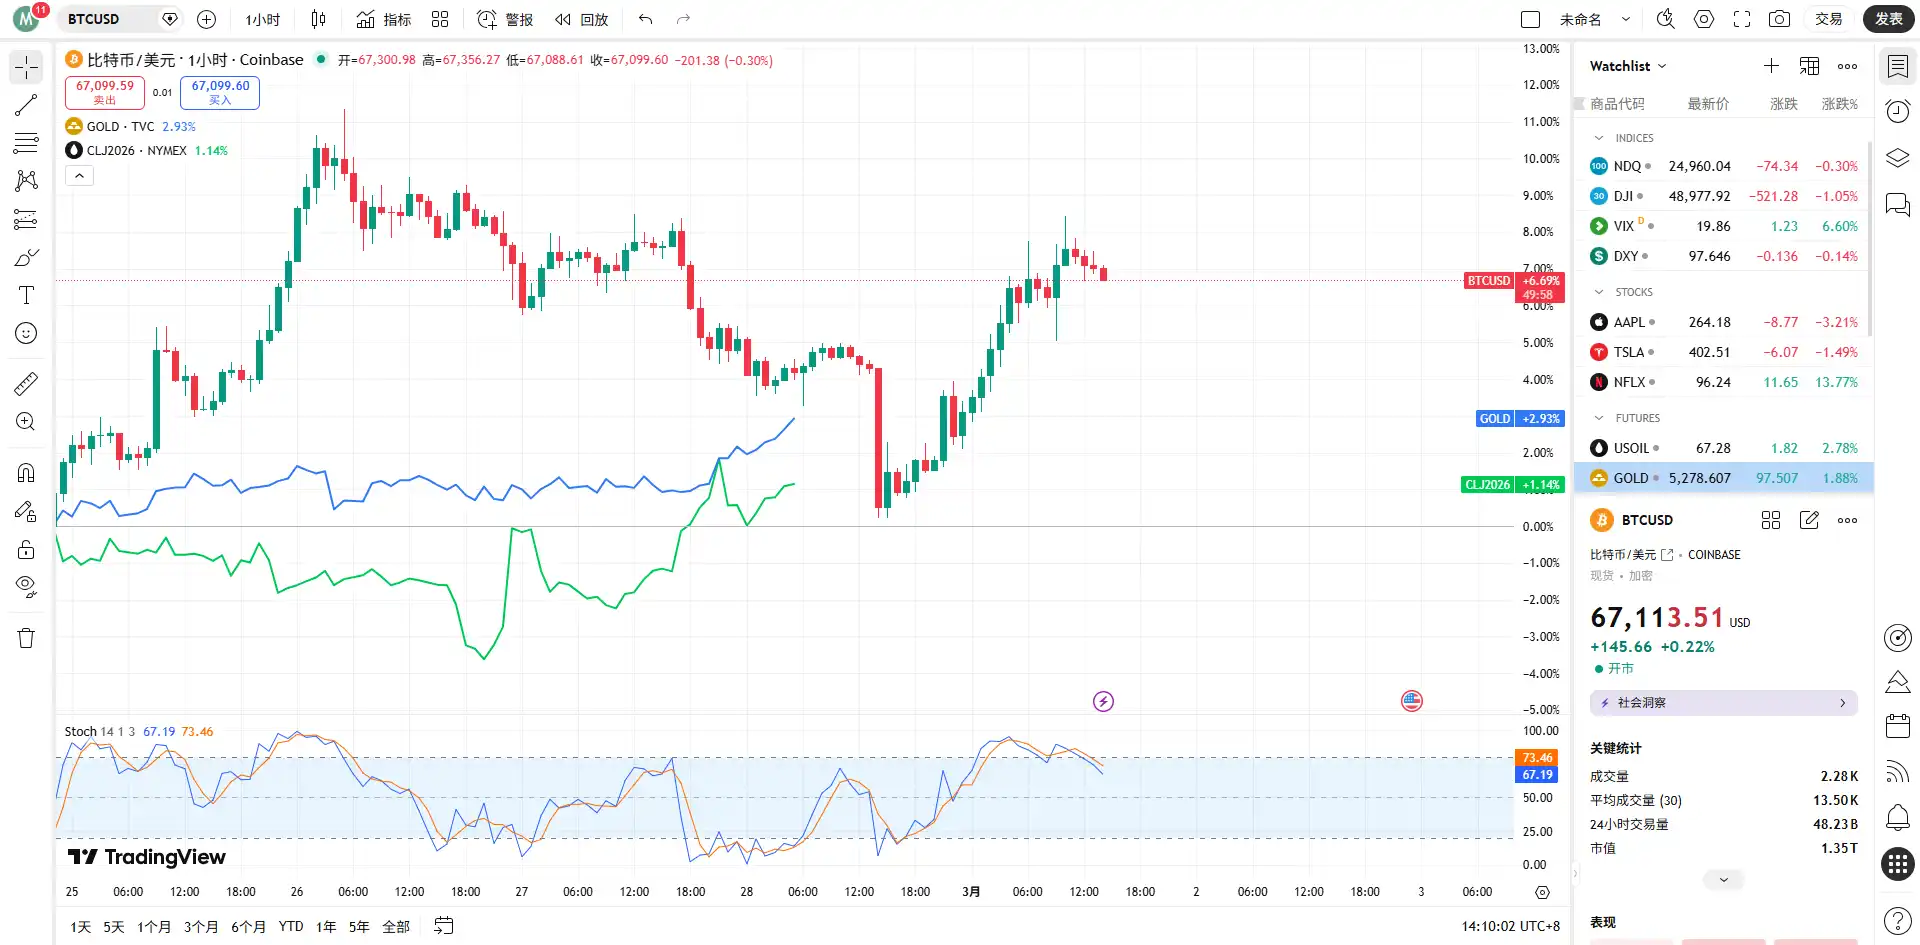
High-intensity conflict erupting in the Middle East first and foremost triggers避险 (safe-haven) sentiment towards the global energy supply chain and the fiat currency credit system. In traditional financial markets, Brent crude oil is highly likely to gap up on open due to panic over potential supply disruptions, and traditional safe-haven assets like gold will also see intensive position building by institutional funds. However, in the crypto asset space, BTC's "digital gold" narrative and its "high-beta risk asset"属性 (attributes) are experiencing intense internal conflict.
From a macro liquidity perspective, panic induced by geopolitics (a soaring VIX index) typically triggers cross-asset indiscriminate selling in the first instance to obtain US dollar liquidity. But after a brief liquidity squeeze, Bitcoin, which is不受 (not subject to) control by any specific sovereign state and possesses censorship-resistant and portable properties, often attracts capital fleeing from high-risk emerging market fiat currencies.
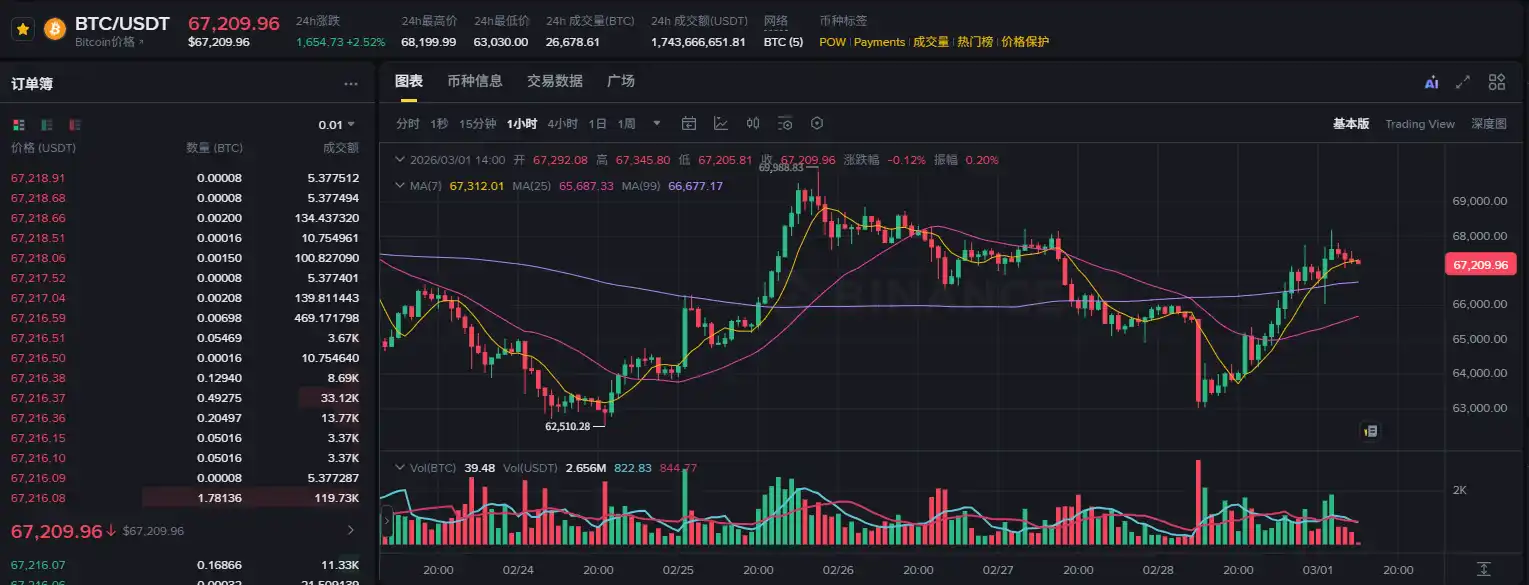
Combining Binance's spot and contract market data (as of 14:00 on March 1, 2026), the BTC/USDT spot price is consolidating around $67,392. In the initial phase of such a major geopolitical crisis, BTC did not experience a crash similar to the "312" event of 2020 but tenaciously held the key support level of $67,000.
The 24-hour trading volume reached a high of $1.74 billion, indicating significant disagreement and turnover between bulls and bears at this level. The moving average system in the price chart shows a pattern of high consolidation following a bullish alignment, suggesting that under the impact of sudden news, the承接盘 (buying support)力量 (force) in the spot market is exceptionally resilient, and the long-term allocation core positions of institutional funds have not fundamentally shifted.
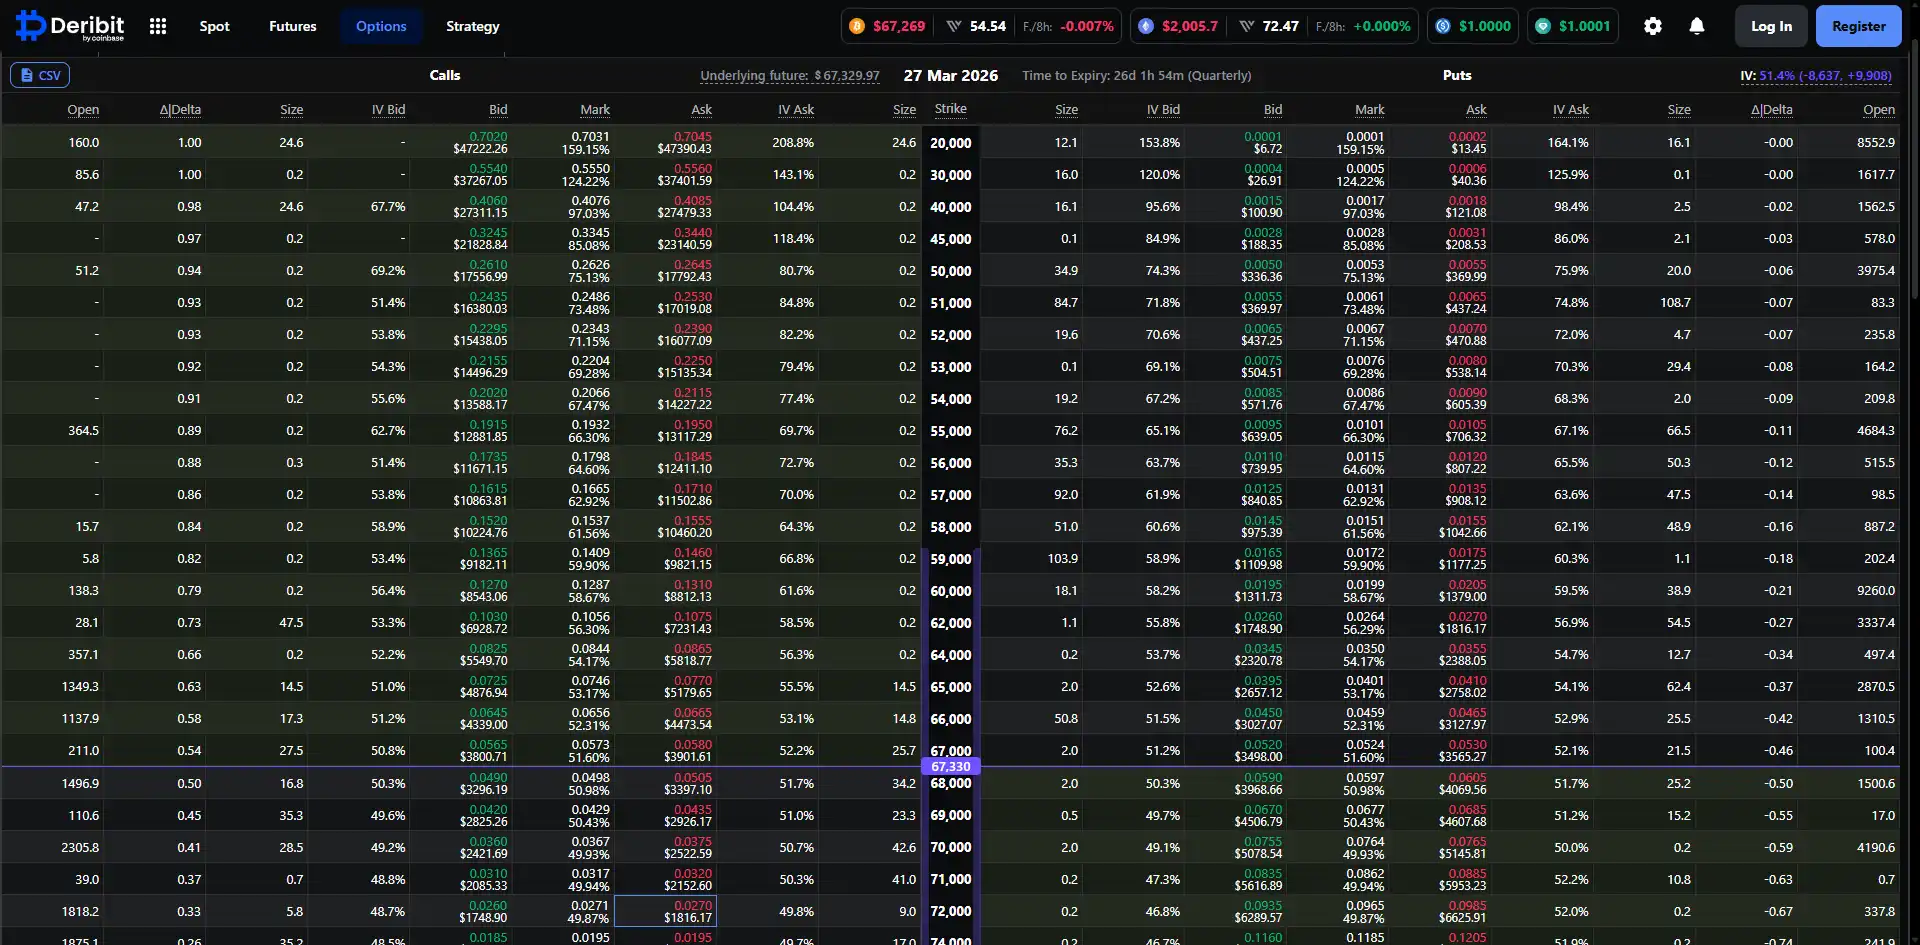
To透视 (see through) the true intentions of smart money, the derivatives market, especially options data, provides the most直观的量化截面 (intuitive quantitative cross-section). By analyzing the current BTC options data expiring on March 27, 2026, on the Deribit platform, we can clearly delineate the path projection of major institutions for the next month.
The current implied volatility (IV) for BTC options expiring on March 27 has reached a relatively high level of 51.3%. Against the backdrop of the geopolitical crisis, options sellers quickly raised the volatility surface to hedge against the Gamma exposure risk potentially brought by extreme price movements. An IV above 51% indicates the market is hedging against the possibility of wide swings over the next two to three weeks. For quantitative traders, the risk-reward ratio for selling volatility is extremely poor at this time; the market as a whole is in a frenzy of "buying straddles" or constructing tail-risk protection.
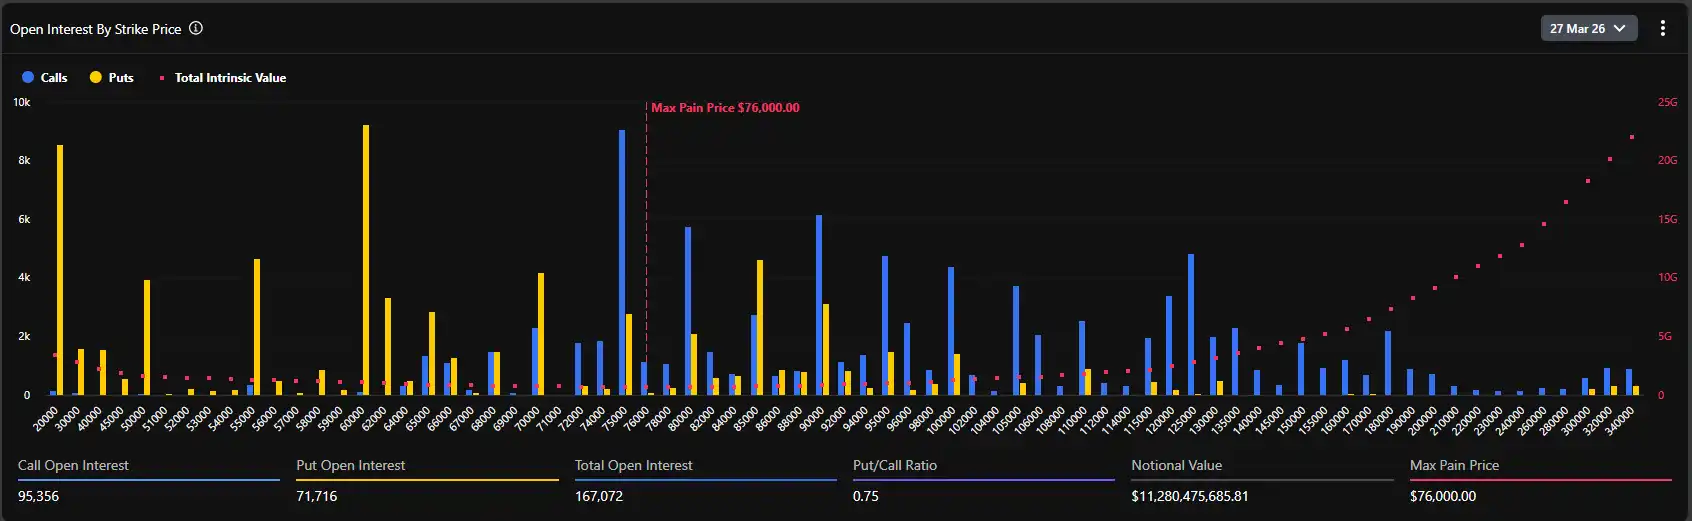
According to the open interest (OI) distribution chart for options, the current global max pain point is as high as $76,000. This is a highly forward-looking and controversial data point.
Typically, as expiration approaches, the underlying asset price tends to gravitate towards the max pain point to minimize the overall value for options buyers. However, the current spot price (around $67,400) is at a discount of nearly 12% or more to the max pain point ($76,000). This significant deviation reveals two core logics:
First, the market was in an extremely optimistic bullish sentiment before the crisis erupted, with substantial funds betting on breaking through the all-time high (the $75,000–$80,000 range) by the end of March, which directly pushed up the max pain level.
Second, the outbreak of the geopolitical crisis constituted a strong external shock, suppressing the upward momentum of the spot price. But judging from the total open interest of 167,072 BTC (notional value exceeding $11.2 billion), long positions did not experience large-scale unwinding and stampedes due to the war news.
Data shows the current put/call ratio (based on OI) is 0.75. A value below 1 indicates that, in terms of overall存量 (stock/volume), call option holdings still dominate absolutely. Particularly at strike prices of $75,000, $80,000, and even $100,000, there are massive accumulations of call holdings (with single strike prices reaching close to 10k BTC in size).
However, it is worth noting that the 24-hour volume PCR (Put/Call Volume Ratio) reached 1.37. The divergence between存量偏多 (stock bias towards calls, 0.75) and增量偏空 (flow bias towards puts, 1.37) perfectly captures the current market psychology: long-term institutions maintain their original long exposure (not selling spot, not closing long calls), but in the short term following the outbreak of war in the Middle East, substantial funds rushed in to buy out-of-the-money (OTM) put options for tactical hedging, causing a surge in short-term put trading volume.
Combining detailed options data from Deribit, we observe that the distribution of Delta values is extremely dense in the $67,000 to $70,000 range. The current spot price of $67,495 is right in the "meat grinder" zone of the bull-bear battle.
If the geopolitical situation further deteriorates, causing macro funds to withdraw en masse, and the spot price breaks below $65,000 (a strong support level), market makers, to hedge their short put exposure, will be forced to sell in the spot or futures market, potentially triggering a wave of localized negative liquidity feedback, testing the psychological barrier of $60,000 downwards.
Conversely, if the Middle East situation enters a stalemate stage with major power mediation after a brief violent conflict, and market panic peaks and recedes, the rebound in the crypto market could be extremely fierce. Due to the massive accumulation of call options in the $70,000 to $76,000 range above, once the spot price stabilizes and breaks through the $70,000 resistance level, market makers will be forced to buy spot to hedge their negative Gamma exposure. This classic "Gamma Squeeze" effect could propel the BTC price towards the max pain point around $76,000 at an unprecedented speed.
The aftershocks of the Middle East geopolitical tremor will continue to发酵 (ferment/develop). The subsequent actions of the US and Iran will determine the final destination of global避险 (safe-haven) capital. In the foreseeable short term, BTC spot will experience violent spikes within a wide range of $62,000~$70,000. Leverage in the contract market will be反复清洗 (repeatedly washed out) in this process. Quantitative strategies should focus on "reducing leverage and capitalizing on volatility," suitable for constructing calendar spreads or grid trading around key support and resistance levels, avoiding exposure to directional trends.
Judging from the options holding structure, the massive expiration on March 27th is a gravitational center the market cannot avoid. Unless a global, uncontrollable World War III-level liquidity drought occurs, as panic sentiment marginally decreases, BTC's "safe-haven属性 (attribute)" and "inflation-hedge属性 (attribute)" will be repriced. In mid-to-late March, the market is highly likely to initiate a restorative rebound, with the spot price having a strong incentive to move towards the $75,000–$76,000 range (the max pain point and dense call strike zone).
This event marks the entry of geopolitics into a more dangerous phase. Whether it's the rekindling of inflation expectations brought by war (soaring crude oil) or the crisis of confidence in fiat currencies triggered by financial sanctions against specific countries, the strategic value of Bitcoin as a "borderless, non-sovereign hard asset" is being fundamentally strengthened. For large institutions such as family offices and macro hedge funds, the traditional 60/40 portfolio of US bonds + US stocks can no longer cope with current tail risks. The allocation proportion of BTC as an "uncorrelated asset" in investment portfolios will see a systematic increase following this crisis.
The US and Israeli strike on Iran is the first thunderclap reshaping the global financial landscape in early 2026. Beneath the surface of panic, the data from the crypto options market冷静地揭示 (calmly reveals) the hand of institutional funds: "short-term defensive hedging, long-term still bullish."
For professional financial practitioners, stripping away emotional noise and closely monitoring the trends in implied volatility and the transfer of market makers' Gamma exposure are the core codes to穿透 (pierce through) the fog of war and grasp the pricing power of the next round of assets. With the $76,000 options max pain point standing like a beacon, every deep pullback caused by panic is accumulating potential energy for a future breakout.