Geopolitical Earthquake in the Middle East: Deciphering Safe-Haven Capital Flows and BTC Pricing Logic Through Options Data

marsbitPublicado em 2026-03-02Última atualização em 2026-03-02

Resumo

In an unprecedented geopolitical shock on March 1, 2026, a direct U.S.-Israel military strike resulted in the death of Iran’s Supreme Leader, triggering a global repricing of risk across asset classes. While traditional safe-havens like crude oil and gold surged, Bitcoin exhibited a dual narrative—oscillating between "digital gold" and high-risk asset behavior. BTC held key support near $67,000 with robust spot market activity ($1.74B in 24h volume), indicating strong institutional accumulation despite initial volatility. Deribit options data revealed critical insights: the March 27 expiry期权 had a max pain of $76,000—12% above spot—suggesting pre-event bullish positioning remained largely intact. Implied volatility spiked to 51.3%, reflecting heightened hedging demand. The put/call open interest ratio stood at 0.75 (call-heavy), while the volume ratio reached 1.37, indicating tactical put buying for short-term protection. A breakdown below $65,000 could trigger negative gamma feedback toward $60,000. Conversely, stabilization above $70,000 may induce a gamma squeeze, accelerating a move toward max pain near $76,000. Medium-term outlook suggests a broad range between $62k–$70k with violent swings. However, as panic subsides, BTC’s structural role as a non-sovereign, uncorrelated asset may strengthen, with a high probability of a rebound toward $75k–76k by late March. This event underscores Bitcoin’s evolving function in global macro portfolios amid escalating geopolitical f...

On March 1, 2026, global macro markets were hit by an epic "black swan" event: a direct military strike by the United States and Israel against Iran resulted in the death of Iran's Supreme Leader, Ayatollah Khamenei.

This extreme tail-risk event instantly reshaped the risk premium models for global asset classes. The complete ignition of the Middle East powder keg not only triggered violent fluctuations in traditional crude oil and safe-haven assets but also pushed the cryptocurrency market, at a critical juncture of博弈 (game theory/strategic interplay), to a crossroads of liquidity and pricing power.

Combining Binance spot market data with Deribit options data, this analysis provides an in-depth examination of the immediate impact of this geopolitical crisis on the cryptocurrency market from a quantitative and derivatives博弈 perspective, along with a forward-looking projection of future volatility paths and market trends.

The essence of geopolitical conflict is the reshaping of global supply chains, energy prices, and the ensuing inflation expectations. The financial market transmission path of this surprise US-Israel attack on Iran manifested as a textbook risk-aversion pattern: crude oil and gold within commodities became the preferred safe havens, while high-risk assets faced indiscriminate selling in the first instance.
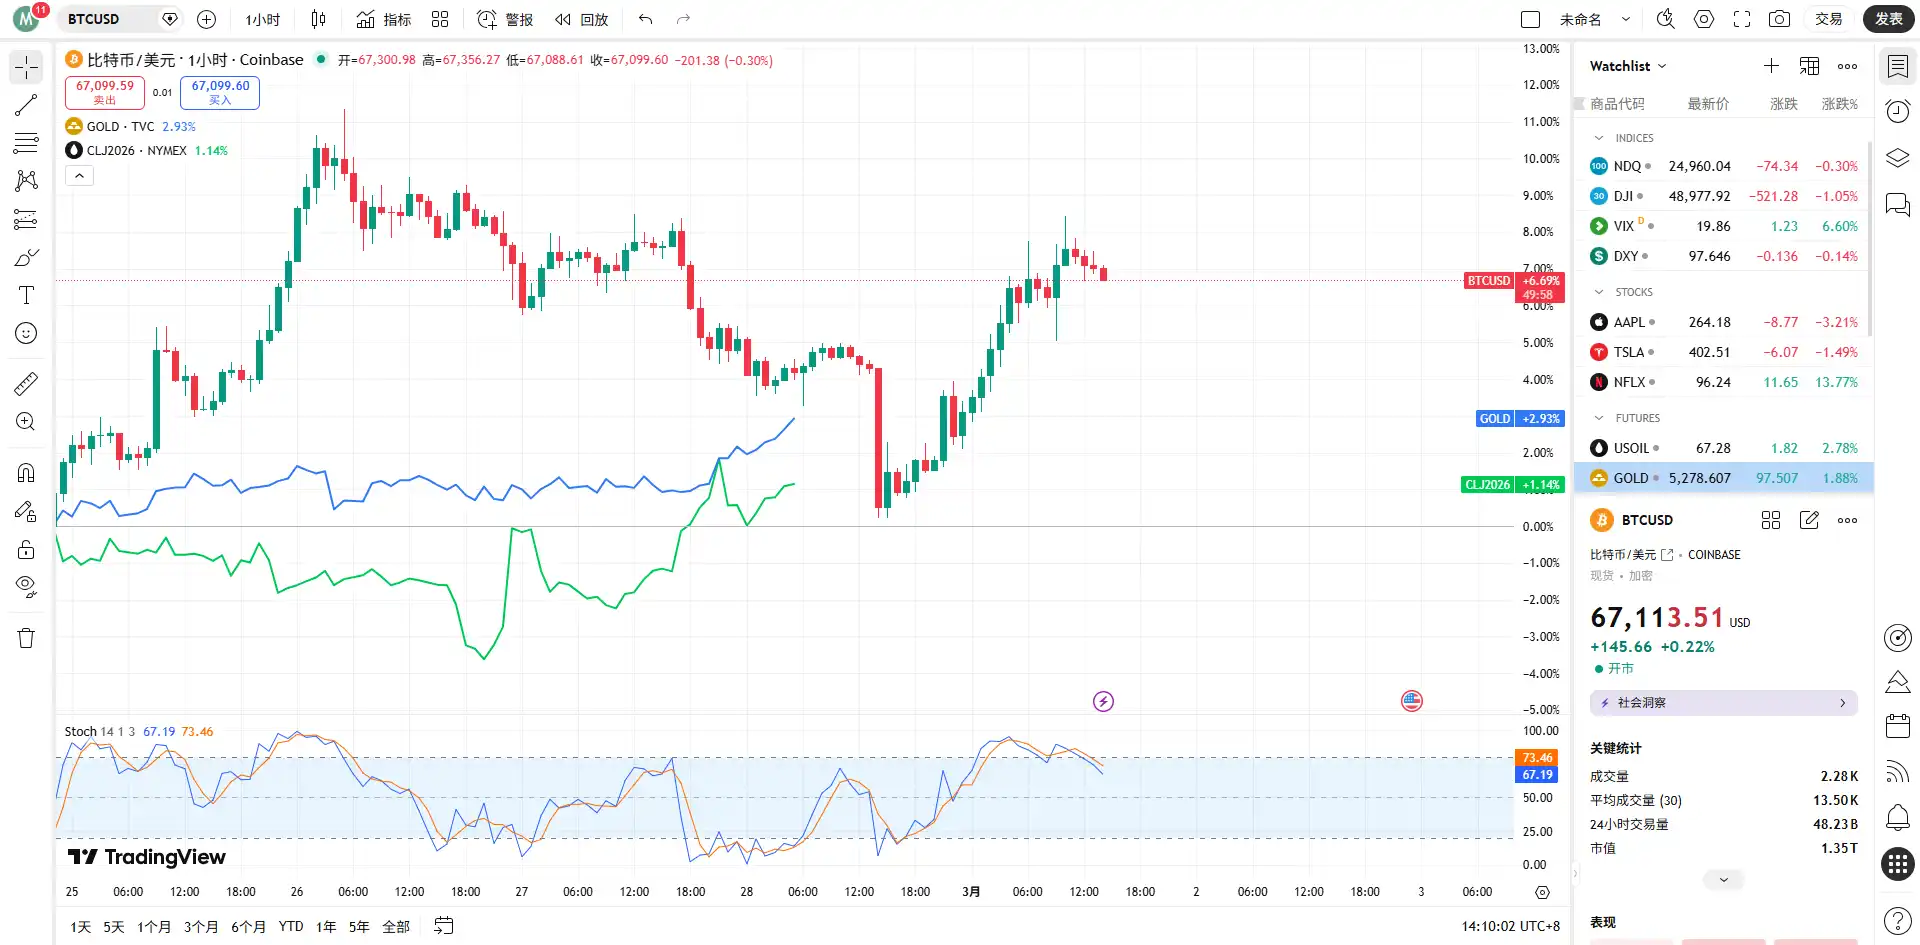
High-intensity conflict erupting in the Middle East first and foremost triggers避险 (safe-haven) sentiment towards the global energy supply chain and the fiat currency credit system. In traditional financial markets, Brent crude oil is highly likely to gap up on open due to panic over potential supply disruptions, and traditional safe-haven assets like gold will also see intensive position building by institutional funds. However, in the crypto asset space, BTC's "digital gold" narrative and its "high-beta risk asset"属性 (attributes) are experiencing intense internal conflict.

From a macro liquidity perspective, panic induced by geopolitics (a soaring VIX index) typically triggers cross-asset indiscriminate selling in the first instance to obtain US dollar liquidity. But after a brief liquidity squeeze, Bitcoin, which is不受 (not subject to) control by any specific sovereign state and possesses censorship-resistant and portable properties, often attracts capital fleeing from high-risk emerging market fiat currencies.

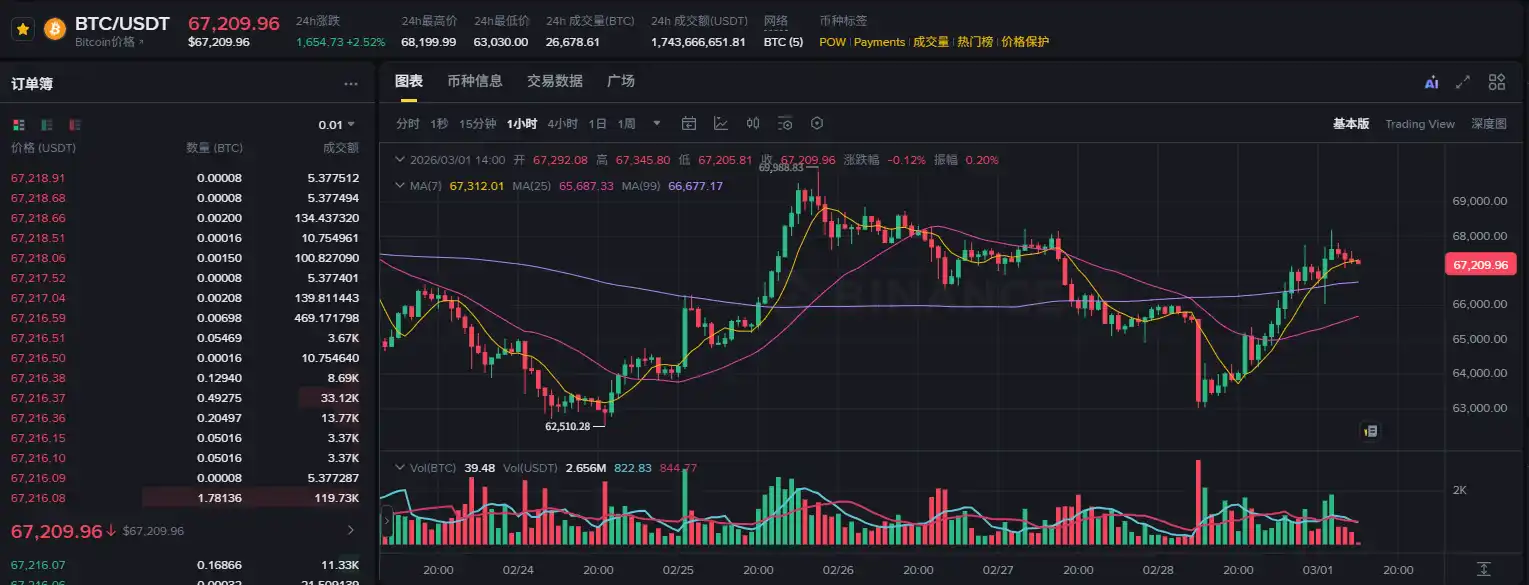
Combining Binance's spot and contract market data (as of 14:00 on March 1, 2026), the BTC/USDT spot price is consolidating around $67,392. In the initial phase of such a major geopolitical crisis, BTC did not experience a crash similar to the "312" event of 2020 but tenaciously held the key support level of $67,000.

The 24-hour trading volume reached a high of $1.74 billion, indicating significant disagreement and turnover between bulls and bears at this level. The moving average system in the price chart shows a pattern of high consolidation following a bullish alignment, suggesting that under the impact of sudden news, the承接盘 (buying support)力量 (force) in the spot market is exceptionally resilient, and the long-term allocation core positions of institutional funds have not fundamentally shifted.
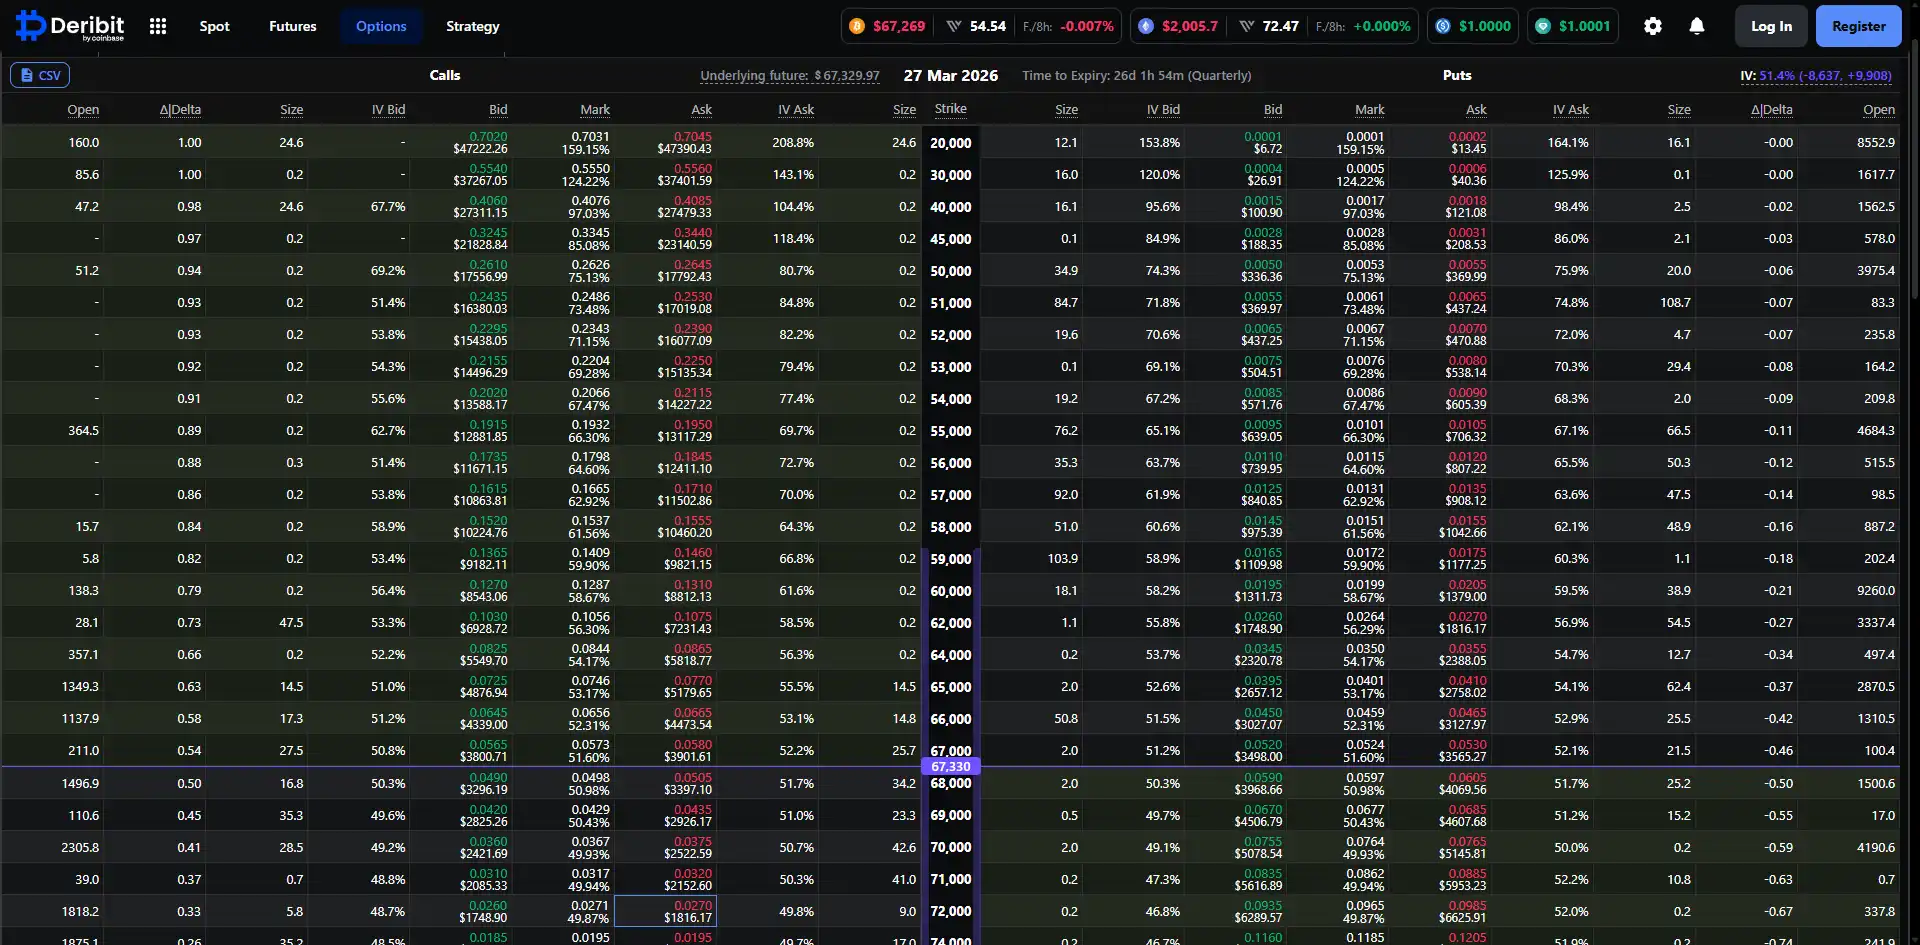
To透视 (see through) the true intentions of smart money, the derivatives market, especially options data, provides the most直观的量化截面 (intuitive quantitative cross-section). By analyzing the current BTC options data expiring on March 27, 2026, on the Deribit platform, we can clearly delineate the path projection of major institutions for the next month.

The current implied volatility (IV) for BTC options expiring on March 27 has reached a relatively high level of 51.3%. Against the backdrop of the geopolitical crisis, options sellers quickly raised the volatility surface to hedge against the Gamma exposure risk potentially brought by extreme price movements. An IV above 51% indicates the market is hedging against the possibility of wide swings over the next two to three weeks. For quantitative traders, the risk-reward ratio for selling volatility is extremely poor at this time; the market as a whole is in a frenzy of "buying straddles" or constructing tail-risk protection.
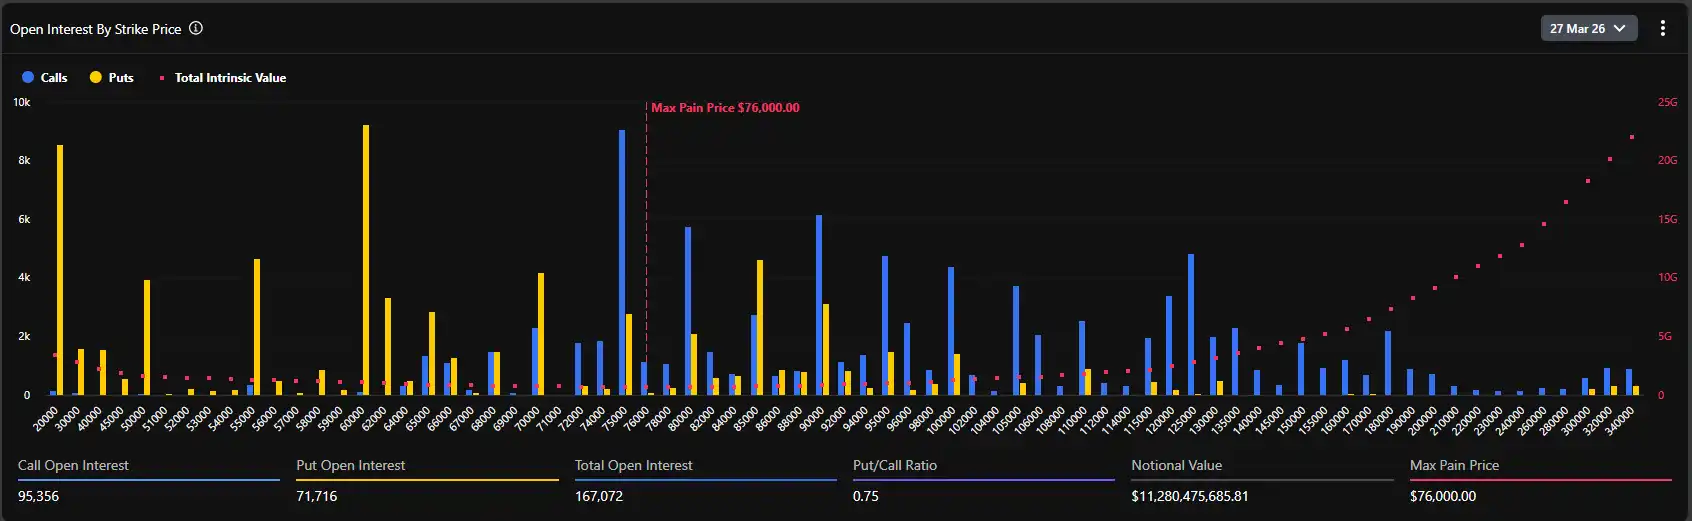
According to the open interest (OI) distribution chart for options, the current global max pain point is as high as $76,000. This is a highly forward-looking and controversial data point.

Typically, as expiration approaches, the underlying asset price tends to gravitate towards the max pain point to minimize the overall value for options buyers. However, the current spot price (around $67,400) is at a discount of nearly 12% or more to the max pain point ($76,000). This significant deviation reveals two core logics:

First, the market was in an extremely optimistic bullish sentiment before the crisis erupted, with substantial funds betting on breaking through the all-time high (the $75,000–$80,000 range) by the end of March, which directly pushed up the max pain level.

Second, the outbreak of the geopolitical crisis constituted a strong external shock, suppressing the upward momentum of the spot price. But judging from the total open interest of 167,072 BTC (notional value exceeding $11.2 billion), long positions did not experience large-scale unwinding and stampedes due to the war news.

Data shows the current put/call ratio (based on OI) is 0.75. A value below 1 indicates that, in terms of overall存量 (stock/volume), call option holdings still dominate absolutely. Particularly at strike prices of $75,000, $80,000, and even $100,000, there are massive accumulations of call holdings (with single strike prices reaching close to 10k BTC in size).

However, it is worth noting that the 24-hour volume PCR (Put/Call Volume Ratio) reached 1.37. The divergence between存量偏多 (stock bias towards calls, 0.75) and增量偏空 (flow bias towards puts, 1.37) perfectly captures the current market psychology: long-term institutions maintain their original long exposure (not selling spot, not closing long calls), but in the short term following the outbreak of war in the Middle East, substantial funds rushed in to buy out-of-the-money (OTM) put options for tactical hedging, causing a surge in short-term put trading volume.

Combining detailed options data from Deribit, we observe that the distribution of Delta values is extremely dense in the $67,000 to $70,000 range. The current spot price of $67,495 is right in the "meat grinder" zone of the bull-bear battle.

If the geopolitical situation further deteriorates, causing macro funds to withdraw en masse, and the spot price breaks below $65,000 (a strong support level), market makers, to hedge their short put exposure, will be forced to sell in the spot or futures market, potentially triggering a wave of localized negative liquidity feedback, testing the psychological barrier of $60,000 downwards.

Conversely, if the Middle East situation enters a stalemate stage with major power mediation after a brief violent conflict, and market panic peaks and recedes, the rebound in the crypto market could be extremely fierce. Due to the massive accumulation of call options in the $70,000 to $76,000 range above, once the spot price stabilizes and breaks through the $70,000 resistance level, market makers will be forced to buy spot to hedge their negative Gamma exposure. This classic "Gamma Squeeze" effect could propel the BTC price towards the max pain point around $76,000 at an unprecedented speed.

The aftershocks of the Middle East geopolitical tremor will continue to发酵 (ferment/develop). The subsequent actions of the US and Iran will determine the final destination of global避险 (safe-haven) capital. In the foreseeable short term, BTC spot will experience violent spikes within a wide range of $62,000~$70,000. Leverage in the contract market will be反复清洗 (repeatedly washed out) in this process. Quantitative strategies should focus on "reducing leverage and capitalizing on volatility," suitable for constructing calendar spreads or grid trading around key support and resistance levels, avoiding exposure to directional trends.

Judging from the options holding structure, the massive expiration on March 27th is a gravitational center the market cannot avoid. Unless a global, uncontrollable World War III-level liquidity drought occurs, as panic sentiment marginally decreases, BTC's "safe-haven属性 (attribute)" and "inflation-hedge属性 (attribute)" will be repriced. In mid-to-late March, the market is highly likely to initiate a restorative rebound, with the spot price having a strong incentive to move towards the $75,000–$76,000 range (the max pain point and dense call strike zone).
This event marks the entry of geopolitics into a more dangerous phase. Whether it's the rekindling of inflation expectations brought by war (soaring crude oil) or the crisis of confidence in fiat currencies triggered by financial sanctions against specific countries, the strategic value of Bitcoin as a "borderless, non-sovereign hard asset" is being fundamentally strengthened. For large institutions such as family offices and macro hedge funds, the traditional 60/40 portfolio of US bonds + US stocks can no longer cope with current tail risks. The allocation proportion of BTC as an "uncorrelated asset" in investment portfolios will see a systematic increase following this crisis.

The US and Israeli strike on Iran is the first thunderclap reshaping the global financial landscape in early 2026. Beneath the surface of panic, the data from the crypto options market冷静地揭示 (calmly reveals) the hand of institutional funds: "short-term defensive hedging, long-term still bullish."

For professional financial practitioners, stripping away emotional noise and closely monitoring the trends in implied volatility and the transfer of market makers' Gamma exposure are the core codes to穿透 (pierce through) the fog of war and grasp the pricing power of the next round of assets. With the $76,000 options max pain point standing like a beacon, every deep pullback caused by panic is accumulating potential energy for a future breakout.


Perguntas relacionadas

QWhat immediate impact did the US-Israel military strike on Iran have on global financial markets according to the article?

AThe strike triggered a classic risk-aversion pattern: a flight to safe-haven assets like crude oil and gold, and an indiscriminate sell-off of high-risk assets.

QHow did the BTC price react initially to the geopolitical crisis, and what does the trading volume suggest?

AThe BTC price held firm around the $67,000 key support level without a crash. The high 24-hour trading volume of $1.74 billion indicates significant disagreement and position turnover between bulls and bears.

QWhat does the high Implied Volatility (IV) of 51.3% for the March 27th BTC options indicate about market expectations?

AThe high IV indicates the market is pricing in and hedging against the potential for wide price swings (high volatility) over the next few weeks due to the geopolitical crisis, making shorting volatility an unattractive strategy.

QWhat is the significance of the large discrepancy between the current BTC spot price (~$67,400) and the options Max Pain point ($76,000)?

AThe large ~12% discrepancy shows that the market was extremely bullish before the crisis (pushing Max Pain high), but the external shock suppressed the spot price. The massive open interest suggests long-term bullish positions were not liquidated en masse.

QHow could the market's path diverge based on the evolution of the Middle East situation, according to the options data analysis?

AIf the situation worsens, a break below $65,000 could trigger a negative feedback loop down to $60,000. If the situation stabilizes and panic subsides, a break above $70,000 could trigger a Gamma Squeeze, rapidly pushing the price toward the $76,000 Max Pain point.

Leituras Relacionadas

Analyzing the Impact of AI on Economic Growth and Productivity

**Title: Analyzing AI's Impact on Economic Growth and Productivity** This article examines three contrasting views on AI's influence on economic growth and productivity. **The Optimistic View** posits that AI, especially through automating R&D ("recursive self-improvement"), could dramatically accelerate growth, even triggering a technological "singularity" with explosive, potentially infinite, economic expansion. **The Moderate/Mainstream View** acknowledges AI's productivity benefits but emphasizes significant real-world constraints that could limit its impact. These include: limited cost savings per task, structural ceilings on which jobs and industries are "exposed" to AI, adoption bottlenecks (e.g., compute, energy, regulatory hurdles), and the "weak link" effect where non-automatable tasks cap overall gains. Consequently, the realized AI dividend may be far lower than optimistic projections, with estimates typically ranging from 0.1% to 1.3% annual productivity growth. **The Pessimistic View** stems from two strands. The first aligns with the moderate view but applies extremely conservative assumptions about task exposure and efficiency gains, yielding minimal projected impact. The second introduces a demand-side critique: if AI primarily replaces rather than augments labor, it could depress labor's share of income, weaken consumer demand, and create a "demand trap" that ultimately stifles growth, unless offset by redistribution policies. **The authors' assessment** is nuanced: * **Short-term (1-2 years):** AI will support growth primarily through investment spending, not significant productivity gains. * **Medium-term (3-5 years):** Three potential paths emerge based on AI demand and bottleneck severity: 1. **"Optimistic Path":** High demand, few bottlenecks. Rapid productivity gains but risk of major job displacement and social conflict without redistribution. 2. **"Moderate Path" (most likely):** High demand but significant, surmountable bottlenecks. Leads to moderate productivity gains, financial market volatility (K-shaped returns), and sectoral job losses. 3. **"Pessimistic Path":** Low demand or severe bottlenecks. Minimal productivity and growth impact, triggering financial market corrections but allowing a smoother societal transition with less labor disruption. * **Long-term:** AI holds potential for a major productivity revolution and prosperity. The conclusion stresses that no path is smooth. Technologically "optimistic" outcomes could be socially detrimental, while "pessimistic" technological diffusion might be more socially stable. Policymakers must monitor developments and prepare balanced responses to manage economic, financial, and social sustainability.

marsbitHá 5m

Analyzing the Impact of AI on Economic Growth and Productivity

marsbitHá 5m

The New Cold War is a Tech Stock War

The New Cold War is a Tech Stock War The article argues that the contemporary geopolitical and economic rivalry between the US and China represents a "New Cold War," but one fundamentally fought through technology and financial markets, not physical barriers or conventional trade. Historically, US dominance was secured through financial systems. The Soviet Union, reliant on the rigid "Transferable Ruble," was ultimately undermined by its dependency on the US dollar for oil trade. Later, Japan's semiconductor challenge was countered not just by tariffs (e.g., Plaza Accord, 301 investigations) but by binding it to US Treasury bonds. China presents a more complex, "embedded" challenger. While it holds vast dollar reserves and US debt like Japan, its industrial base is stronger and more diversified than the Soviet Union's. Surviving the initial 2018 trade war phase, the conflict has evolved into a "tech-financial war." The core battlefield is now the stock market. US tech stocks (AI, semiconductors) are treated as sovereign assets, buoyed by bipartisan national will. China is pushing to strengthen its own financial markets to convert industrial strength into financial power and fund its tech ambitions. Companies like ChangXin (semiconductors), Moonshot AI, and DJI compete not just for market share but as financial proxies for their respective systems. The new paradigm is moving from globally efficient monopolies (Apple, Google) towards companies that achieve monopolistic profits within their respective geopolitical spheres. This competition over "pricing power" and financial valuation in segmented markets defines the current era, making the stock market the primary arena for this tech-centric struggle.

marsbitHá 14m

The New Cold War is a Tech Stock War

marsbitHá 14m

RWA Weekly: Ten European Financial Institutions Establish Tokenized Asset Cooperative; Ondo Launches New Execution Network Ondo Network

RWA Weekly: European Banks Form Tokenized Asset Cooperative; Ondo Launches New Execution Network Ondo Network Covering July 24-31, 2026, the RWA sector saw a steady on-chain total value locked (TVL) of $36.8 billion, with holder count hitting a record high. However, stablecoin transfer volumes fell sharply (~30%), indicating low on-chain settlement demand. Key regulatory moves include South Korea advancing stablecoin legislation and a push to scrap crypto taxes, Kenya lowering capital requirements for stablecoin issuers, and Zimbabwe approving seven projects for its crypto sandbox. In project developments, BIS-led Project Agorá successfully tested cross-border payments with tokenized funds across six currencies. Ten major European financial institutions formed the RL1 blockchain cooperative to build tokenized asset infrastructure. Other notable updates: Aviva launched a tokenized dollar liquidity fund on XRPL, POSCO International tokenized commercial invoices on Injective, and a Brazilian farmer used tokenized cattle as collateral for a loan. Additional progress includes BNY Mellon migrating its core transfer agent operations to blockchain, Securitize gaining SEC investment advisor registration, and Tether’s compliant stablecoin USA₮ launching on Celo. Ondo Finance introduced Ondo Network, a new execution layer focused on speed and privacy, moving away from its initial chain plans. An analysis highlights that despite the growing scale of on-chain RWAs (~$32B), approximately 90% remain underutilized in DeFi, pointing to a critical challenge in unlocking liquidity and fostering real-world application beyond mere issuance.

marsbitHá 14m

RWA Weekly: Ten European Financial Institutions Establish Tokenized Asset Cooperative; Ondo Launches New Execution Network Ondo Network

marsbitHá 14m

South Korean Stock Market Sees Sharp Rebound After Forceful De-leveraging, SK Hynix Rises 30%

On July 31, South Korean stocks staged a historic rebound. The benchmark KOSPI index surged 18.27%, with chipmaker SK Hynix hitting a 30% gain limit. This followed a brutal, near-40% decline in the KOSPI over the previous month, driven largely by a deleveraging spiral involving leveraged ETFs. Analysts attributed the sharp sell-off to structural liquidity issues rather than deteriorating corporate fundamentals. The rally was triggered by a confluence of positive catalysts. Firstly, strong earnings from U.S. cloud giants Microsoft and Amazon alleviated fears of an "AI bubble burst," boosting global tech sentiment. Secondly, SK Group Chairman Chey Tae-won made a rare personal purchase of SK Hynix shares, seen as a strong vote of confidence. Thirdly, the South Korean government announced a 20 trillion won ($139 billion) AI investment fund. In response to the market turmoil, South Korean regulators are tightening controls on leveraged ETFs, admitting oversight shortcomings. Measures include raising minimum cash保证金 requirements for散户 investors and suspending new product launches. While the rebound signals eased liquidity pressure, analysts note deep structural issues remain. The market's future stability is seen as dependent on global tech capital expenditure trends and memory chip price cycles, with some viewing the surge as a technical correction rather than a definitive trend reversal.

marsbitHá 35m

South Korean Stock Market Sees Sharp Rebound After Forceful De-leveraging, SK Hynix Rises 30%

marsbitHá 35m

Trading

Spot
活动图片