Author: Artemis Analytics
Compiled by: TechFlow DeepTide
TechFlow DeepTide Introduction: Figure is quietly transforming from a balance-sheet-driven lending institution that needed to acquire customers and fund loans itself into a lightweight marketplace platform connecting loan originators and institutional buyers. When 78% of its flow comes from partners and platform fee revenue approaches 30% of total revenue, the market still values it using models for traditional lenders—this mismatch warrants a re-evaluation by anyone focused on fintech and on-chain assets.
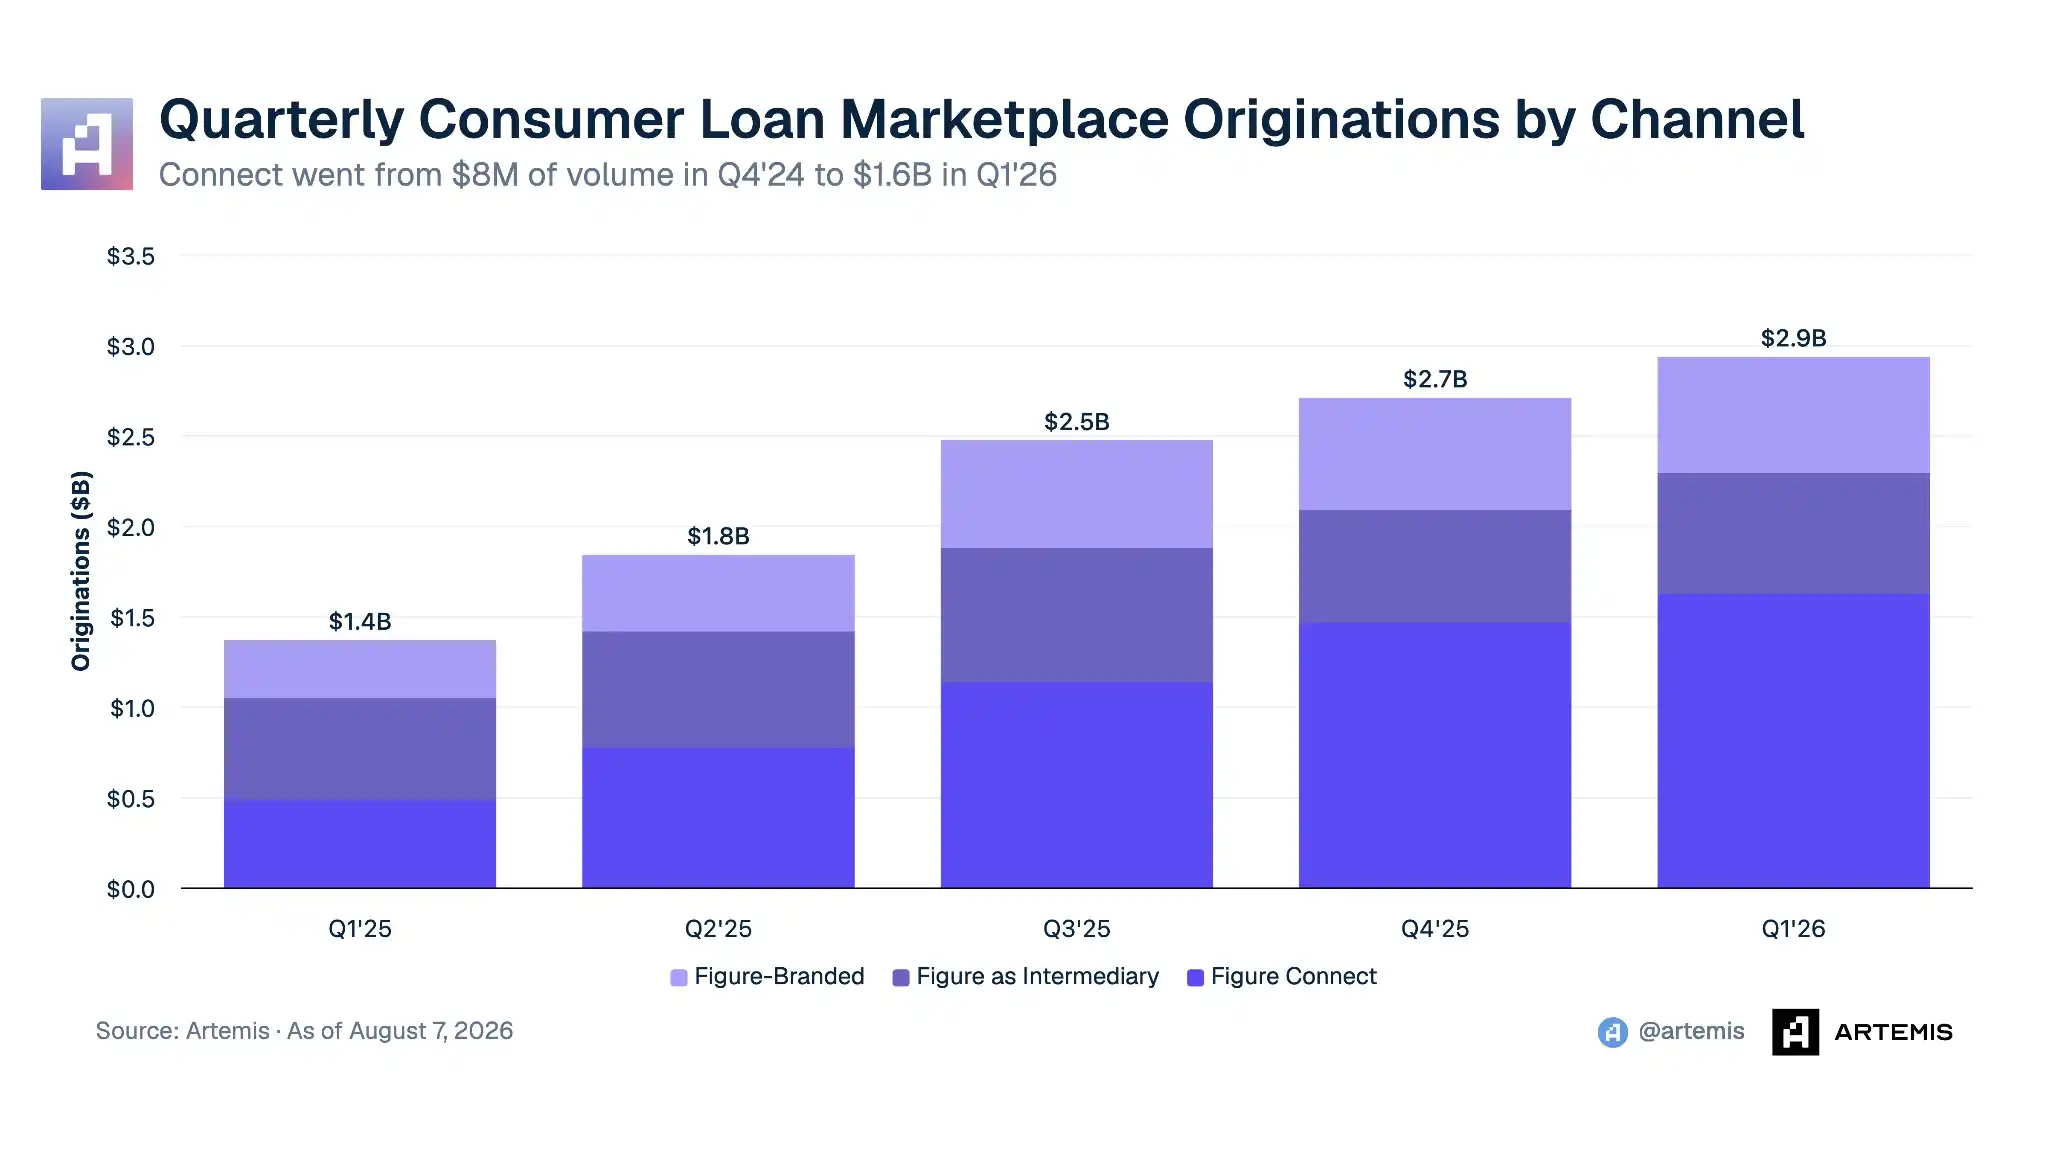
Figure spent six years building a home equity lending platform aimed at shortening funding time and reducing costs. Now, an increasingly large part of its business comes from marketplace matching activities where loans are neither originated nor funded by Figure. We believe this model could bring substantial incremental profitability. In Q1 2026, partners contributed 78% of platform flow, Connect transaction volume surged from $8 million in Q4 2024 to $1.6 billion, and the higher incremental margin fee revenue line grew from 5% of revenue to 28%. We expect Figure to evolve into a lightweight "toll road" charging fees on loan flow, while the market still values it on a balance sheet basis.
Thus, the key question is: how much loan volume can flow through this platform without it sourcing customers or providing capital itself?
This memorandum represents the joint view of Artemis and North Island Ventures. Artemis is a digital finance research firm focused on blockchain and equity assets. NIV is a New York-based investment firm focusing on the intersection of blockchain, fintech, and AI.
Figure Connect, launched in June 2024, is a marketplace connecting loan originators and institutional buyers. Partners originate loans, institutional capital provides funding, and Figure earns underwriting and distribution fees. Figure reports all related activities as Consumer Loan Marketplace volume: every loan originated on its own platform, plus third-party loans traded on Connect.
This model is scaling. Partner-originated loans now constitute 78% of total volume. Connect reached 56% of CLM volume within seven quarters of launch. Loan inventory days dropped from 31 days to 16 days, and ecosystem & tech fees grew from 5% of revenue to 28%.
More loan supply could come from two sources. The pending acquisition of Kiavi would bring an origination engine with annual volume of $7 billion, and Figure should be able to route some of that through the same infrastructure. Additionally, available industry data indicates that subordinate lien lending, after over a decade of contraction, has begun to recover, expanding Figure's core market.
Meanwhile, Wall Street seems to be pricing in rate compression for Figure's entry into the first lien business, which structurally carries lower fees than its core second lien business. However, Figure's disclosed net fee rate has actually increased even as the proportion of first liens nearly doubled. We believe this disconnect is part of a broader misunderstanding of the business, also explaining why consensus expectations remain too low.
Figure was founded in 2018 by Mike Cagney and June Ou, who were SoFi's co-founder and CTO, respectively. Figure and its approximately 390 partners originated $8.4 billion in loans in 2025, a 63% year-over-year increase. The platform's current annualized origination volume is approximately $17 billion, growing 130%. This represents about 5% of all US loans secured by residential real estate.
We believe Figure's initial competitive advantage was speed and cost. The company built two things in parallel: a fully automated home equity loan origination platform, and a blockchain, Provenance, purpose-built for this task—every Figure loan is originated, recorded, and ultimately securitized on its chain. Together, they compressed the home equity loan process from about six weeks and $11,000 in cost to under seven days and $1,000. In our view, this advantage established Figure's position in second lien HELOCs, where it is now the largest non-bank originator.

A second lien ranks behind a borrower's existing mortgage: homeowners keep their low-rate first mortgage untouched and borrow against the equity above it. A first lien holds the first claim on the home, whether for an original mortgage or a new loan for an owner with no existing mortgage.
Connect may represent a major shift in the business's economic model.
We see two potential catalysts through 2026 and beyond: the continued scaling of Figure Connect, and the pending acquisition of Kiavi, which upon completion would double Figure's first lien business, expected to close in Q4. Section 3 explains why neither appears reflected in the stock price.
1. Connect Is Transforming Figure from Lender to Marketplace Platform
In our view, through 2024, Figure was a good loan originator operating under a structurally mediocre business model. It sourced borrowers via a sales team, funded loans using warehouse lines, held loans on its balance sheet for about a month, and then monetized them upon sale.
We see this economic model as typical for specialized lenders: capital-intensive, reliant on external financing, exposed to credit and volume cycles, thus meriting valuations typically in the 5-7x EBITDA range for the industry.
Connect changes the funding source for part of Figure's growth. Partners source borrowers and originate loans against commitments pre-sold to institutional buyers, while Figure provides underwriting and distribution infrastructure, charging approximately 3% in marketplace fees. Therefore, scaling Connect volume does not require a corresponding increase in customer acquisition spend, warehouse financing, or credit exposure.
Connect volume grew from $8 million in Q4 2024 to $1.6 billion in Q1 2026. Partner-originated volume now accounts for roughly 78% of total flow, meaning most loans reaching Figure incur no customer acquisition cost for Figure.

Balance sheet metrics reported by Figure also reflect this shift. Loan inventory days have dropped from about 31 days to 16 days, while volume has nearly tripled. Warehouse financing borrowings are just $15 million, against $1.9 billion in committed facilities, a utilization rate of less than 1%. And against $6.8 billion of securitization collateral, Figure's disclosed maximum exposure is only $378 million.
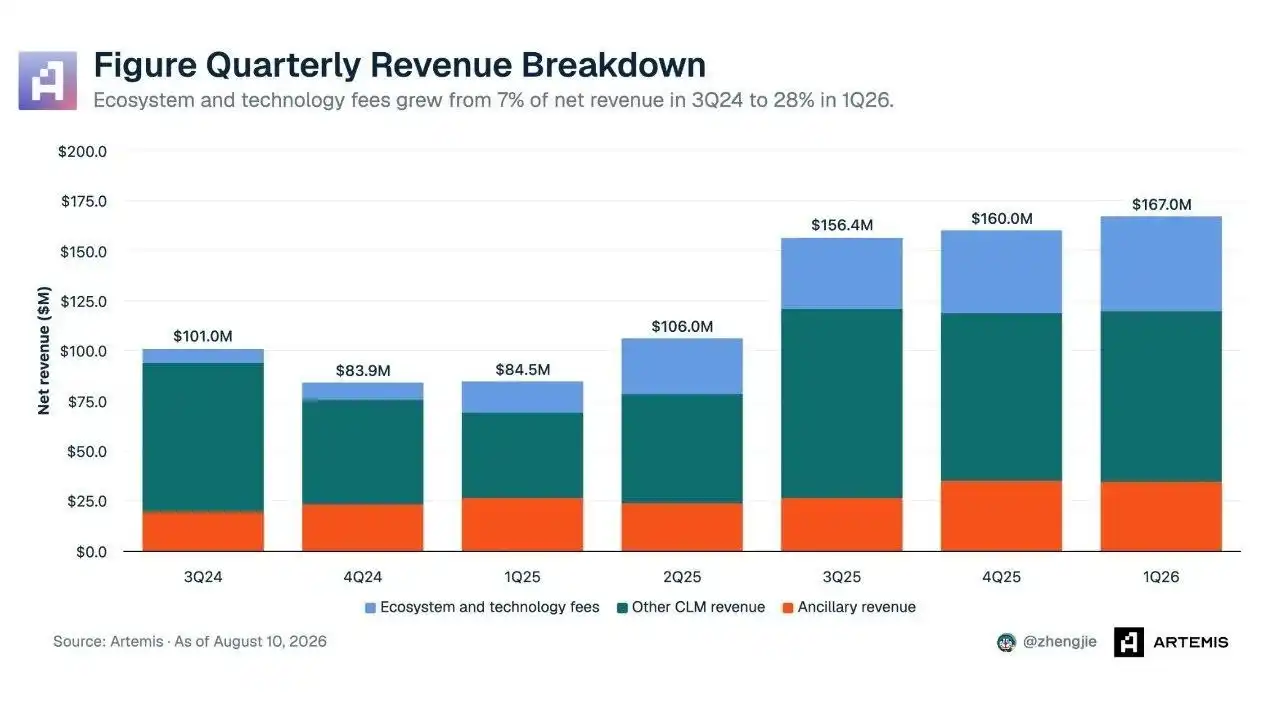
The revenue mix is tilting towards the highest-quality line on the income statement: ecosystem & tech fees. These are platform and marketplace fees with near 100% incremental margins; they have grown from 5% of total revenue in FY2023 to 28% in Q1 2026.
From FY2023 to FY2025, revenue grew 142%, while costs grew only 18%. Incremental EBITDA margins reached 82% and 91% in 2024 and 2025, respectively, driving reported adjusted EBITDA margin from -4% to 49%. Continued volume growth on the current cost base should support further margin expansion towards management's mid-2028 target of 60%.
2. More Loan Supply May Be Coming
The greater the loan flow on Connect, the more valuable it is, and Figure has two substantial new supply streams potentially arriving simultaneously.
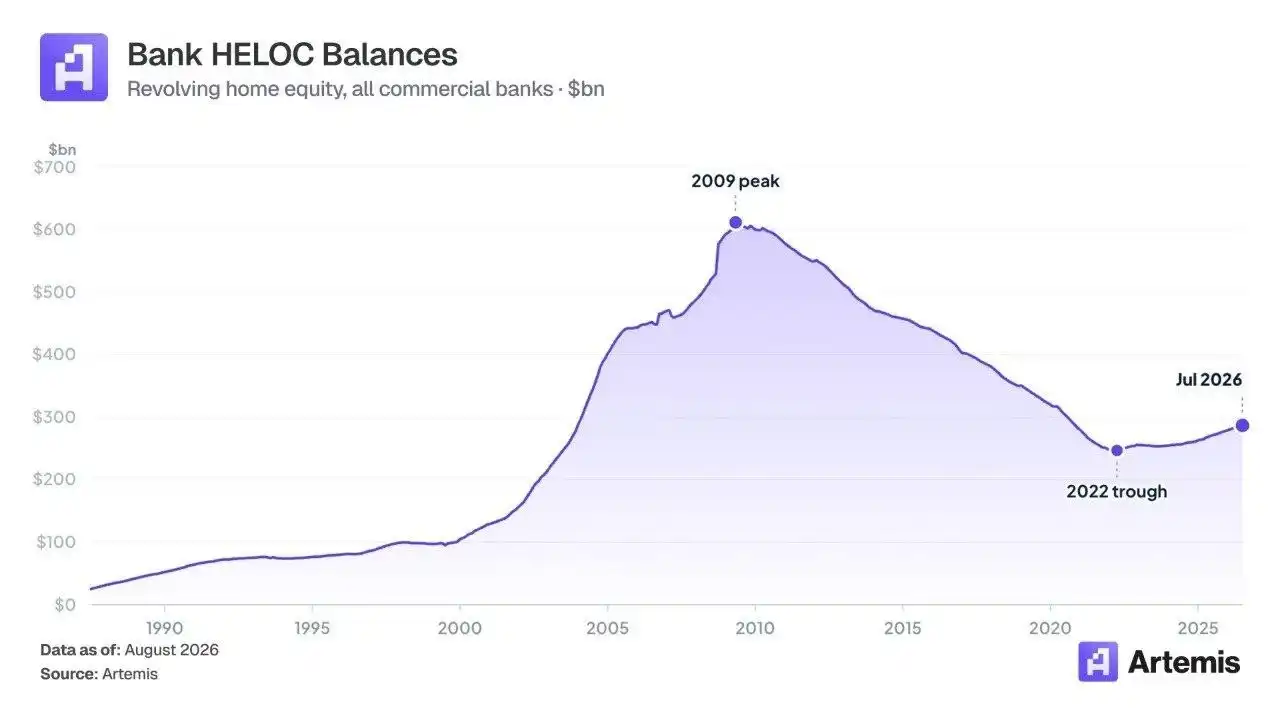
First, second liens. Industry data shows that after roughly 13 years of continuous post-financial crisis contraction, balances have recently begun to rise. Bank HELOC balances reached $287 billion in 2026 and resumed growth, down from a peak of $600 billion in 2009. The industry opened 1.2 million new HELOC lines in 2025, the highest since 2022, but still only about half the mid-2000s peak.
Homeowners currently hold 71.6% of their home's value as equity, the highest level in about 35 years. Much of this equity sits behind mortgages locked at 3%-4% rates, making a full refinance at current ~7% rates unattractive. For homeowners seeking to access this equity without giving up low-rate first mortgages, second liens are a rational choice.
Figure's resurgent growth finds it already the largest non-bank HELOC originator, and we believe it faces a relatively thin competitive field: capital requirements, compliance costs, and the lack of government-sponsored agency support have pushed many lenders out of this category.
Meanwhile, Kiavi opens a second front for Figure—first liens. This acquisition would double Figure's existing first lien business. First liens serve borrowers second liens cannot: mortgage-free homeowners—constituting about 40% of US homes—and those with still-reasonable cases to refinance existing balances. Per-loan balances typically range $200k-$300k, with annual origination flows around $2 trillion, roughly ten times the market size of second liens.
Kiavi is the largest originator of residential transition loans (RTLs), ~12-month term loans used to purchase and renovate properties for resale. 85% of its volume comes from RTLs. Kiavi's share of the RTL market grew from 2.1% in 2020 to 9.7% in 2025, achieved during three years of frozen housing turnover, while scaled-down competitors lost credit lines and went out of business. In 2025, its volume exceeded $7 billion, revenue over $250 million, growing 30%, with EBITDA margins around 40%.
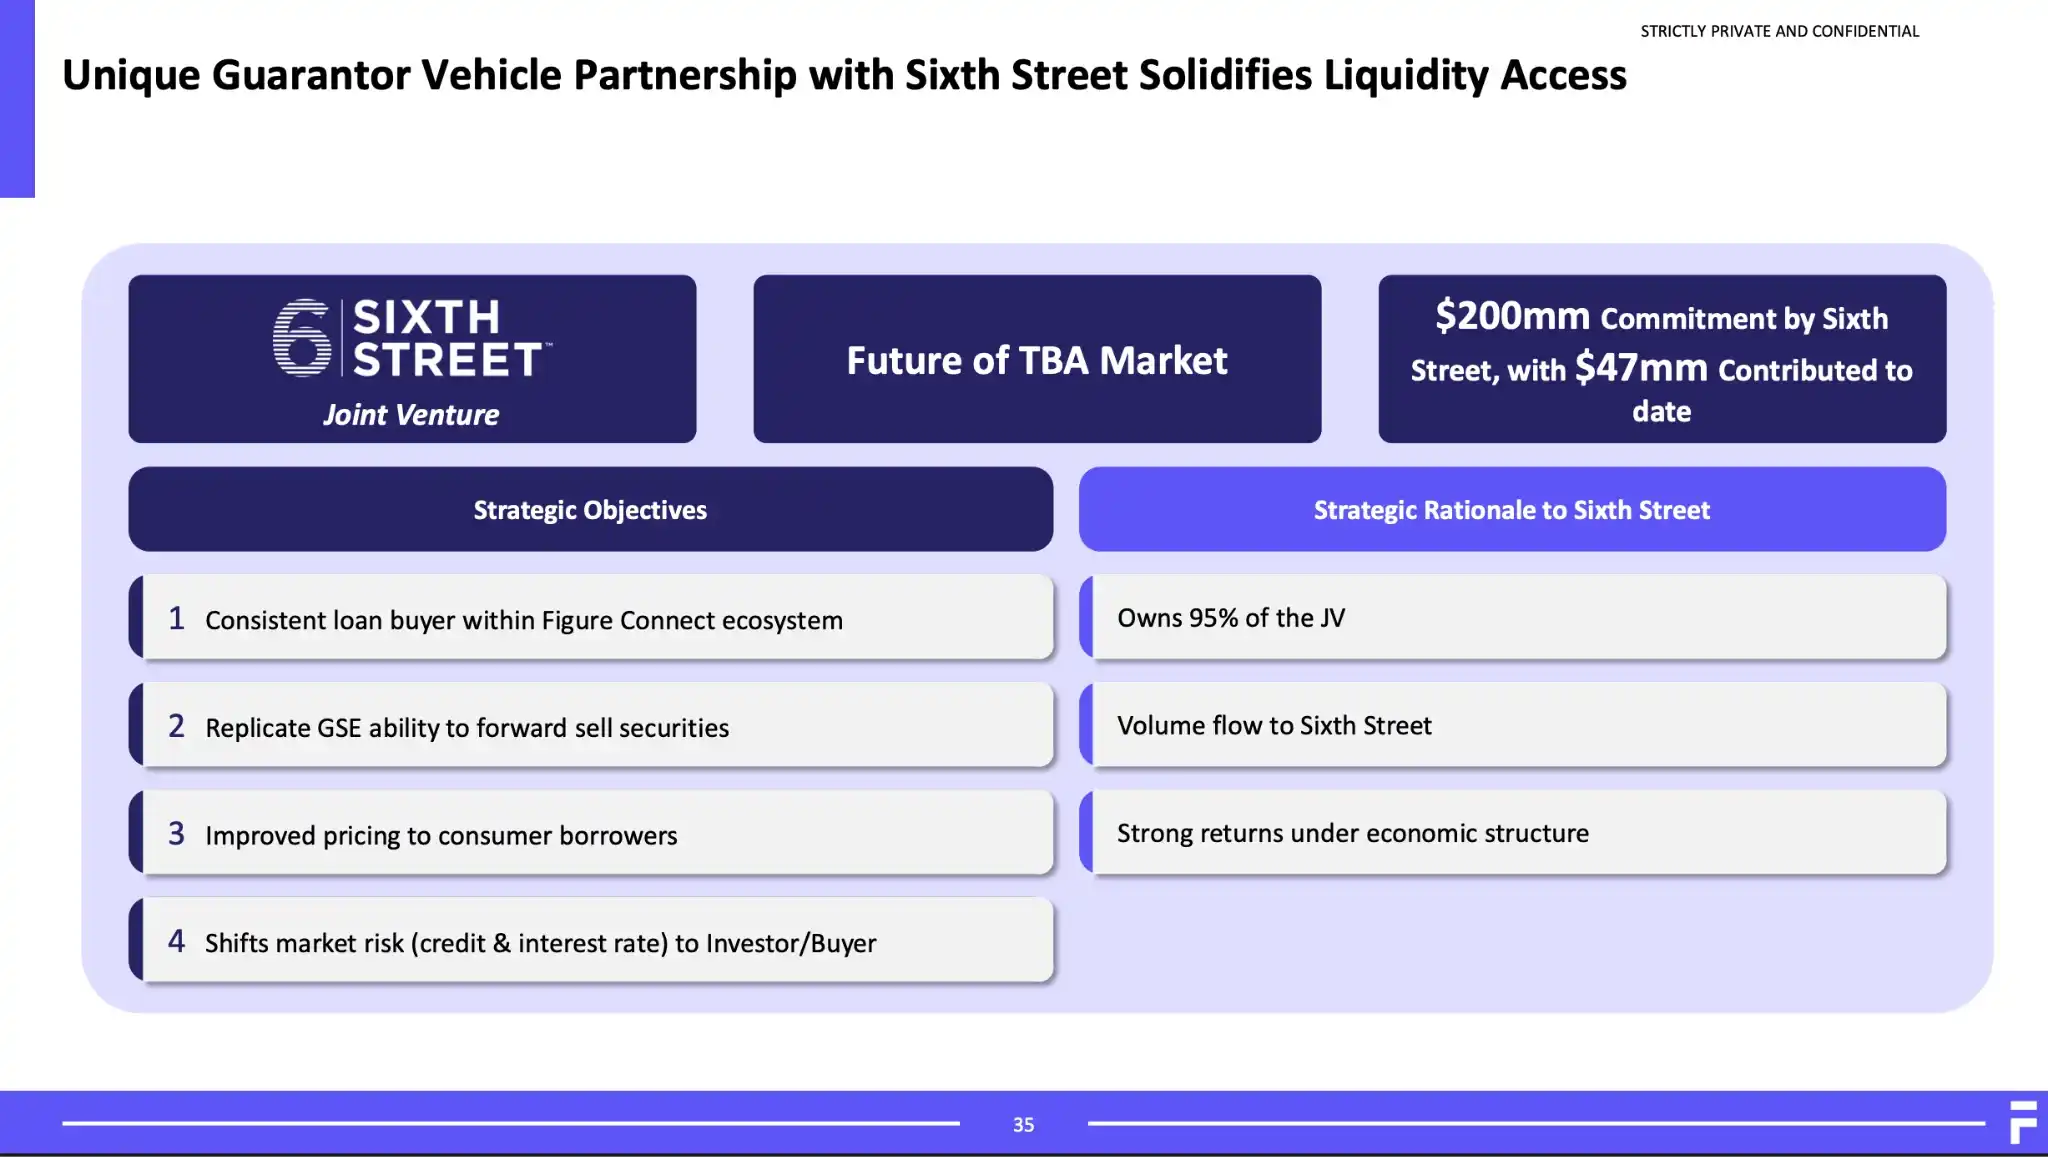
In our view, the deal's structure is also important. Figure and Sixth Street are jointly acquiring it for $717 million in cash, with Figure paying $538 million and Sixth Street $179 million. Figure will retain the operating platform, while Sixth Street places Kiavi's loan assets into a joint venture entity backed by over $3 billion in forward purchase commitments, effectively securing demand for Connect in advance.
3. The Market Is Likely Misreading This Transformation
We see three main reasons for the mispricing.
The market may be underestimating the durability of Figure's fee rates. First liens structurally carry lower fees than Figure's traditional second lien business, so as their mix increases, a portfolio effect should mechanically compress the company's overall fee rate.
This hasn't happened so far. Figure's disclosed net fee rate increased from 3.4% in Q4 2024 to 3.8% in Q1 2026, while the first lien mix nearly doubled and second lien pricing held steady at around 4.5% to 5.0%. Underlying pricing appears robust enough to absorb mix changes.
This distinction matters for valuation. Price erosion diminishes the economics of the existing business; mix shift to first liens adds incremental business at a lower fee rate. Furthermore, Connect allows more of this volume to scale with less capital, minimal acquisition cost, and higher margins. Consensus appears to be factoring in fee compression, yet product-level pricing shows little sign of deterioration.
Thin research coverage. Currently, only four analysts cover FIGR. Since its Q1 2026 earnings, Figure has been posting CLM volume weekly on its own website, giving investors a near-real-time revenue proxy. However, only one sell-side analyst explicitly models CLM volume, and even this estimate falls below Figure's self-reported volume. Figure is handing real-time business line data on a platter, and the market largely ignores it.
The stock is miscategorized. Our take: FIGR initially traded as a crypto proxy, now behaves more like a momentum stock, even as its business increasingly resembles a financial trading platform like Tradeweb or ICE.
We believe the valuation does not yet reflect this transformation. FIGR currently trades at roughly 12x EBITDA, its lowest multiple since IPO: above the typical 5-7x for specialized lenders but far below levels appropriate for scaled financial platforms.

Figure does retain crypto-related businesses, including the stablecoin YLDS and its tokenized securities market, but together they contribute less than 2% of revenue. Management seems focused on correcting market perception. Figure's investor education materials steer investors away from the crypto narrative towards the two variables increasingly determining profitability: CLM volume and fee rates.
Counterarguments
This thesis breaks down if Figure's competitive advantages prove temporary, housing transaction volumes deteriorate sharply, or the economics of its core products weaken.
AI commoditizes underwriting. A former Figure product manager argues that AI could make five-day closings a basic requirement, eroding Figure's speed advantage and forcing competition to shift to price. We see a more durable moat in the platform marketplace, but widespread industry improvements in underwriting speed and cost remain a key risk.
Housing Transaction Volume Weakness
Housing transaction volume weakness. Connect reduces credit risk but not volume risk. HELOC default rates are rising from historic lows, and a housing downturn would suppress HELOC demand and hit fix-and-flip loans particularly hard.
Core Pricing Deterioration
Core pricing deterioration. The investment logic relies on product-level pricing remaining healthy while the mix shifts towards lower-margin products. Persistent declines in second lien margins, or net margin dropping below ~3.5%, would indicate competitive pricing pressures beginning to outweigh the benefits of incremental volume.
Governance Risks Materialize
Governance risks materialize. Cagney and Ou control approximately 71% of voting rights through a dual-class share structure, leaving limited recourse for shareholders. A mitigating factor is alignment: Cagney's substantial FIGR holdings and nearly a decade building Figure tie his financial and career outcomes deeply to the company's long-term success.
Our assessment is that Wall Street remains focused on two things: the risk that lower-margin products dilute Figure's economics, and the loans Figure itself still originates. We believe this misses the transformation's essence. Connect is enabling more volume to flow through the platform with less capital, lower acquisition costs, and higher incremental margins. In our view, as more loan volume travels these channels, Figure looks less and less like the lender the market still prices it as.
Important Disclosures
This article and all information contained herein are provided by Artemis Analytics Inc. and North Island Ventures, LLC ("NIV") (each referred to as an "Author," collectively the "Authors") for informational purposes only, for providing educational content and general market commentary.
Nothing herein constitutes or relates to, nor is it an offer of, NIV's investment advisory services, and nothing herein, including but not limited to references to companies, constitutes an offer to sell or a solicitation to purchase any securities, nor an invitation to make an offer to purchase any interest or share in any private investment fund currently or in the future managed by NIV (each a "Fund"). Any such offer can only be made to qualified offerees upon receipt of the relevant confidential private placement memorandum, subscription documents, and governing documents (collectively, the "Operative Documents").
The information herein is not intended to provide and should not be relied upon for accounting, legal, or tax advice or investment recommendations. NIV does not act, nor does it purport to act, in any capacity as an adviser or fiduciary to any potential investor in any Fund. Recipients of this article should consult their tax, legal, accounting, or other advisors regarding matters discussed herein.
Although the information contained herein is believed to be accurate, neither the Authors nor their respective affiliates and representatives (i) make any express or implied warranty as to the completeness or accuracy of the information, (ii) assume responsibility for any errors that may appear herein, or (iii) have any obligation to update the information herein. Certain information herein constitutes "forward-looking statements," which may be identified by the use of such words as "may," "will," "should," "anticipate," "expect," "project," "estimate," "intend," "continue," "target," or "believe" (or the negatives thereof) or other variations thereon or comparable terminology. Actual events or results or the actual performance of an investment may differ materially from those reflected or contemplated in such forward-looking statements. No representation or warranty is made with respect to any such forward-looking statements.
Any analysis and views herein (including market commentary, statements, or forecasts) may contain subjective elements (including certain assumptions) or be based on incomplete or inaccurate information. The Authors are under no obligation to update the information herein.
This article features specific trademarks and logos owned by the companies discussed herein. All such trademarks remain the property of their respective owners and are used solely for direct identification or description of the companies discussed. Their use is not intended to indicate, nor does it indicate, any sponsorship, endorsement, or affiliation between the Authors or their affiliates and the trademark owners.
Accounts advised by NIV are currently invested in Figure and may, in their sole discretion and for any reason, increase or exit their positions at any time without notice. No representation of performance (historical or otherwise) or track record is made in this document. Company metrics, including but not limited to revenue, earnings, EBITDA, net profit, and similar metrics, are not proxies for potential investment performance and should not be understood as such. There is no guarantee that achieving any financial metric (including stock price movement) will lead to positive investment performance. Unforeseen or unaccounted-for events could materially affect Figure's performance and/or valuation—in which case, forecasts could change significantly. Investment performance is based on and must consider numerous factors not reflected here, such as transaction behavior, investment terms (e.g., share class), use of leverage, transaction costs, and other factors. Readers should not interpret any stock price presentation as a proxy for the performance or investment return of any Fund managed by NIV. NIV makes no guarantee or warranty that any Fund will make similar investments. All investments carry the risk of total loss.
The discussion of Figure references public information, with certain estimates or forecasts provided by or primarily sourced from Figure. The Authors make no representation regarding (i) the accuracy or reliability of any estimate or forecast, (ii) the reasonableness of the applicable assumptions and the comprehensiveness of the inputs available, or (iii) the validity and reliability of calculation methodologies. The Authors make no guarantee as to the price at which any securities may be bought or sold. Numerous factors affect the performance of any investment.