TL;DR
· In February, the adjustment in crypto assets widened due to rising risk aversion and insufficient liquidity, making the market more vulnerable to shocks;
· Weakening market demand, negative Coinbase premium index, ETF outflows, and slowing stablecoin growth indicate a decline in institutional participation;
· Amid the valuation reshuffle, structural trends continue to advance, with increased tokenization activities and deeper integration of on-chain infrastructure with traditional markets.
In February, the crypto industry continued its recent trend, with fundamental progress overshadowed by weak market performance, as assets struggled amid changing macroeconomic conditions. This article reviews the market and on-chain dynamics affecting crypto assets in February 2026.
Market Performance
February began with intense volatility. During the sell-off on February 5-6, Bitcoin briefly fell below $61,000, marking one of the worst starts to a year for crypto assets in over a decade. The entire crypto asset market has been in a sustained correction since the October 2025 peak: Bitcoin has retreated by nearly half, while Ethereum and Solana have fallen back to levels seen before the approval of spot ETFs in 2024.
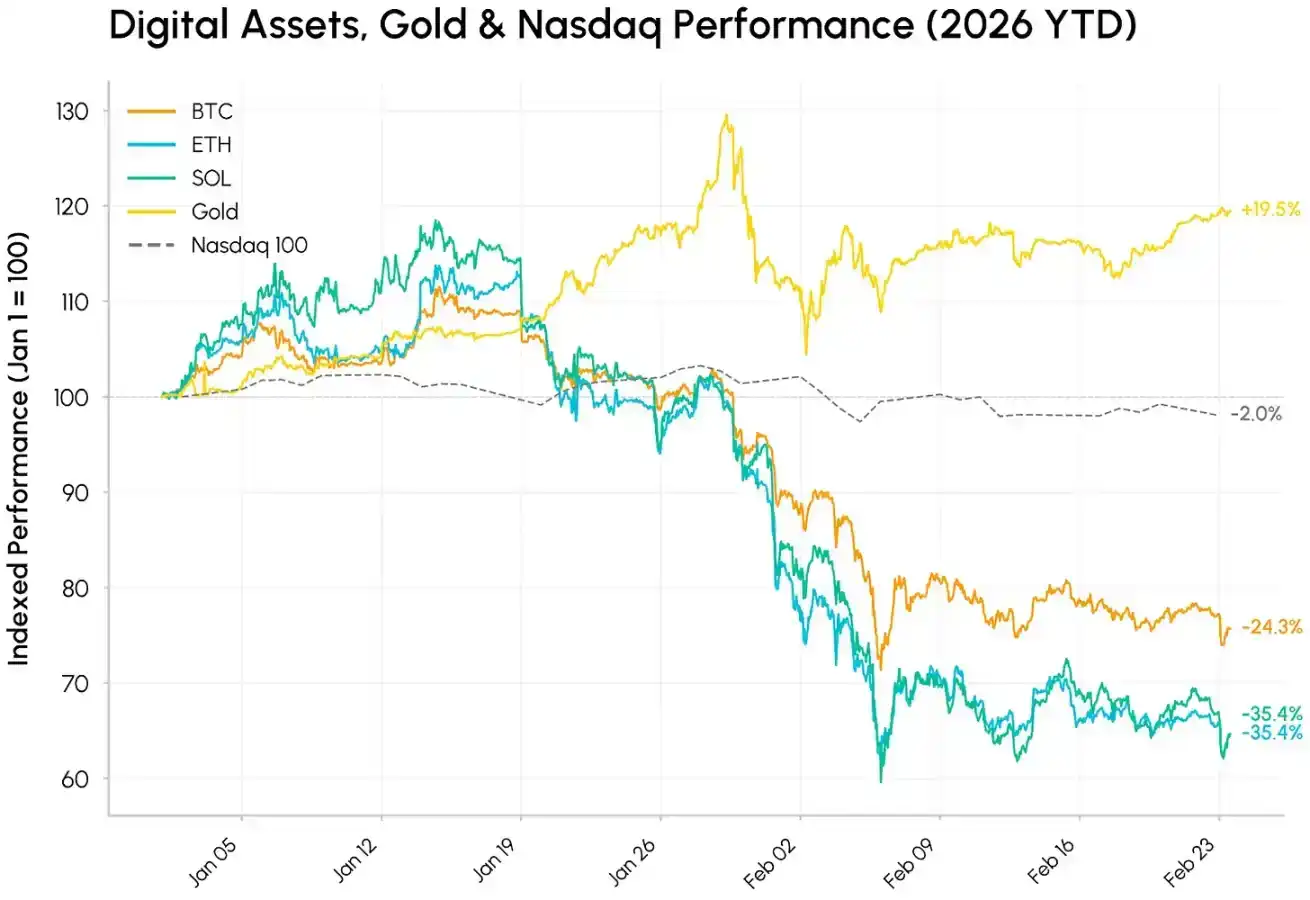
At the same time, various assets showed significant divergence: gold rose 15% year-to-date, supported by safe-haven and non-dollar store-of-value demand amid geopolitical and tariff uncertainties. In a risk-off environment, crypto assets traded more like high-beta tech stocks, falling alongside growth stocks, with the market reacting intensely to the rapidly evolving AI wave and shock risks.
The weakness in crypto assets appears to be more a result of declining risk appetite, low liquidity, and ongoing deleveraging, rather than a collapse in fundamentals.
Retreat of Capital Inflows
Behind the correction, core demand and liquidity deteriorated simultaneously. The Coinbase premium index (measuring the price difference between BTC/USD on Coinbase and BTC/USDT on Binance) is a key indicator of U.S. spot market demand. This index has been negative since November 2025 and deepened further in February, indicating sustained selling pressure and a lack of institutional buying in the U.S. market. The recent recovery in the premium suggests the most intense phase of U.S. spot selling may be over, but demand remains weak.
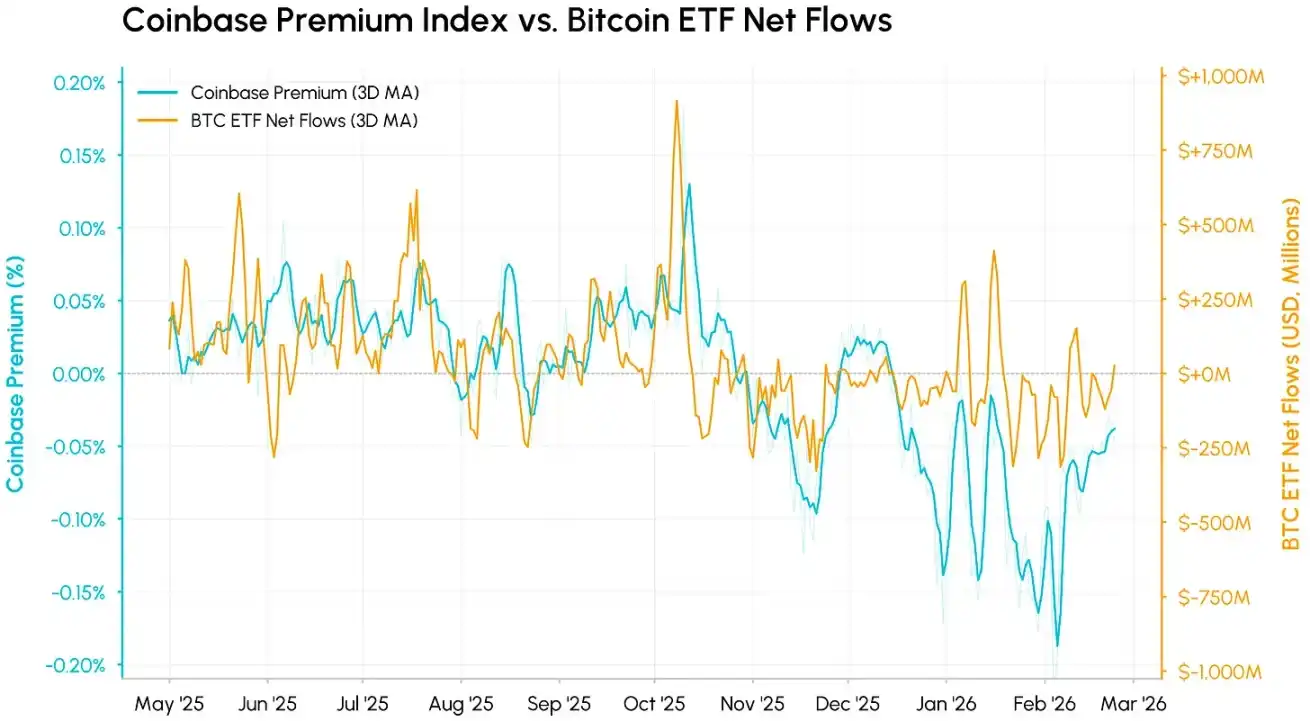
Overlaying this with the net flows of Bitcoin ETFs shows a high degree of synchronization between the two. These two metrics measure U.S. institutional demand from different angles and both fell below the zero axis almost simultaneously. In each decline, the premium tends to drop before fund flows, as spot prices react quickly, while ETF redemptions take longer to materialize. Year-to-date, spot Bitcoin ETFs have seen cumulative net outflows of over $4 billion, erasing a significant portion of last year's inflows.
Thin Liquidity, Volatile Trading Volume
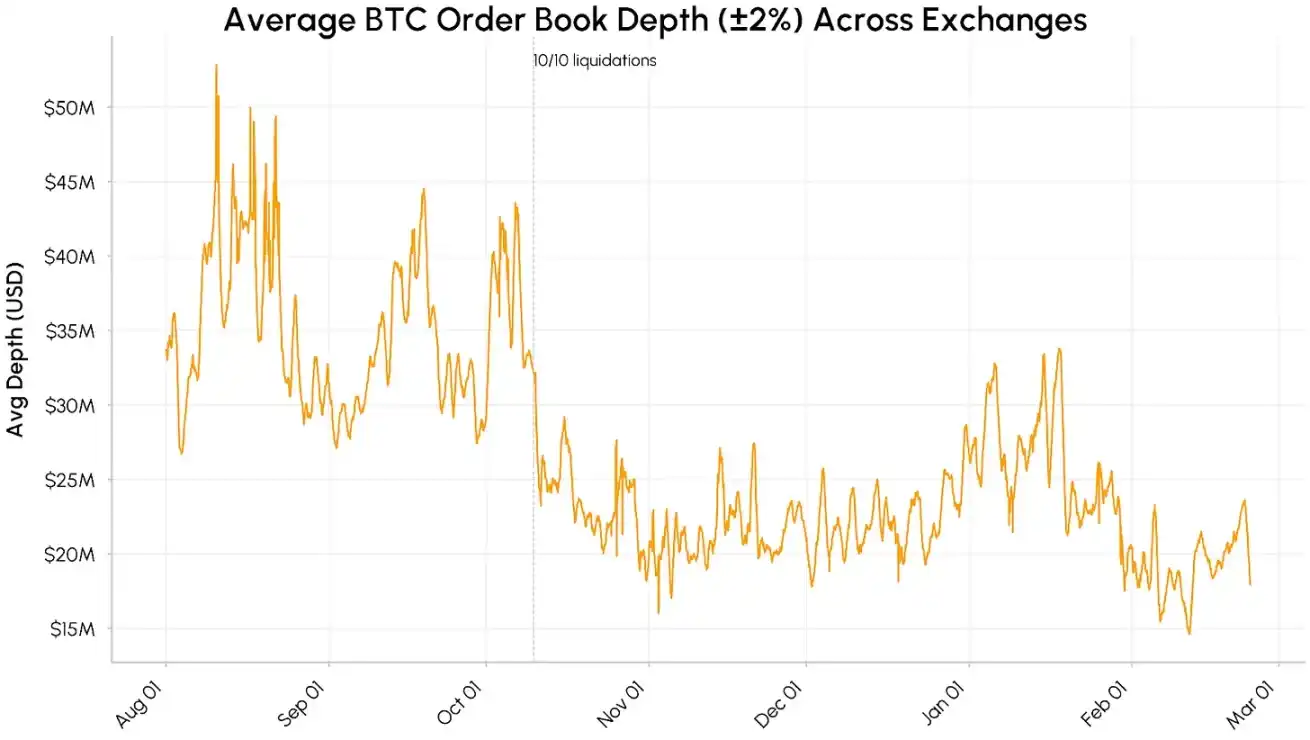
Market liquidity remains fragile. The depth of Bitcoin spot order books (±2% range liquidity) on major exchanges plummeted from around $40–50 million in August–October 2025 and has remained in the $15–25 million range. Liquidity further contracted in February, directly amplifying price volatility.
Stablecoin supply growth has also slowed significantly since December. The total market capitalization of USDT and USDC has hovered around $260 billion, indicating a halt in new capital inflows rather than an overall withdrawal of funds. Taken together, retreating institutional demand, insufficient order book depth, and slowing stablecoin growth suggest the conditions for a sustained recovery are not yet in place.
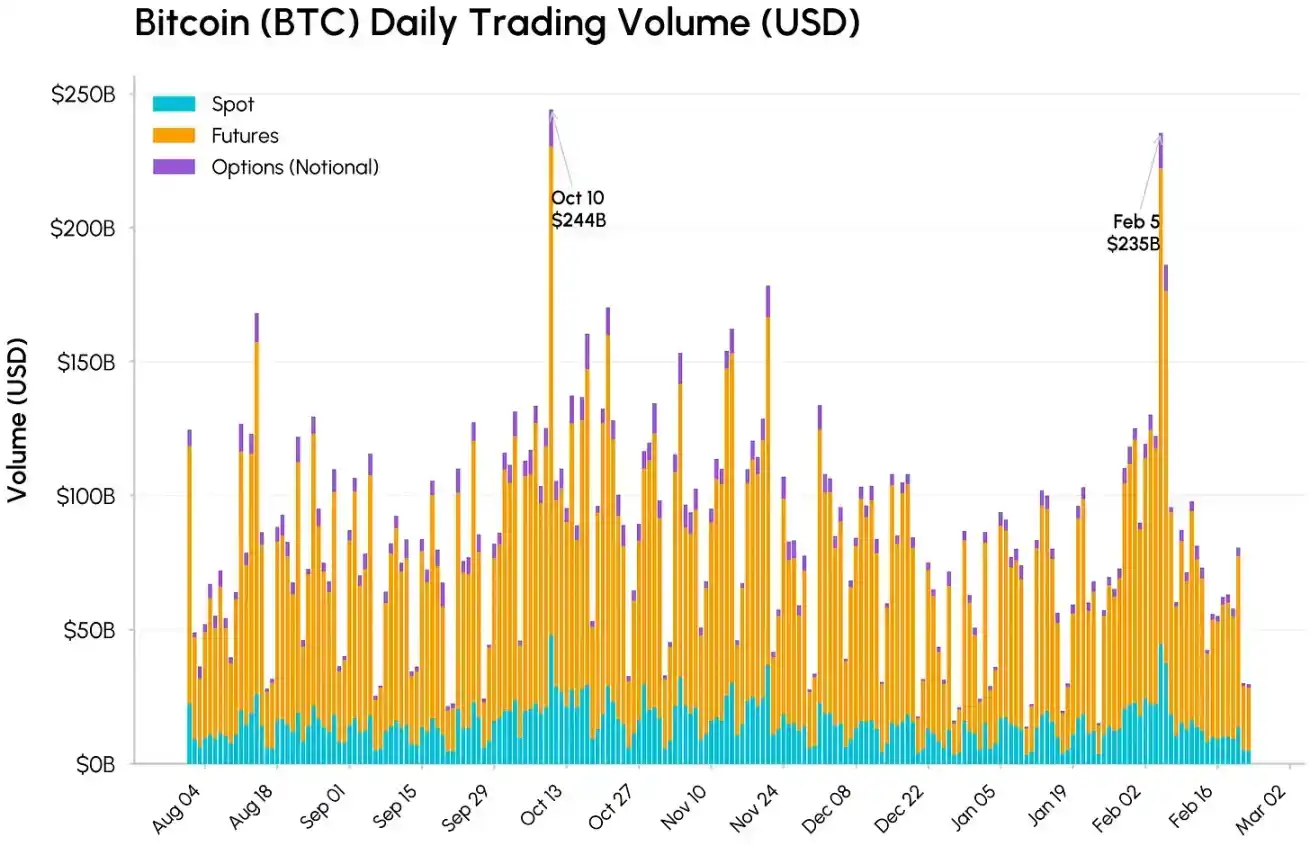
On October 10 and February 5, trading volumes in spot, futures, and options surged significantly. Total Bitcoin trading volume reached $244 billion and $235 billion, respectively, with futures volume dominating at $177 billion on February 5. Although the market turmoil was comparable to October, spot trading volume was slightly lower than in October, consistent with low order book liquidity exacerbating price volatility. Historically, such high-volume sell-offs often coincide with the end of forced selling, suggesting the most intense phase of this decline may be nearing its end.
RWA Perpetual Contracts on Hyperliquid
Meanwhile, the momentum of real-world asset tokenization and the integration of on-chain finance with traditional finance continues to strengthen. Hyperliquid is one of the main beneficiaries, with its on-chain perpetual contracts expanding from crypto assets to commodities, stocks, the Nasdaq 100 index, and other products.
This expansion was enabled by the HIP-3 protocol upgrade, which allows permissionless creation of perpetual markets for any asset, complete with oracles and fee structures.
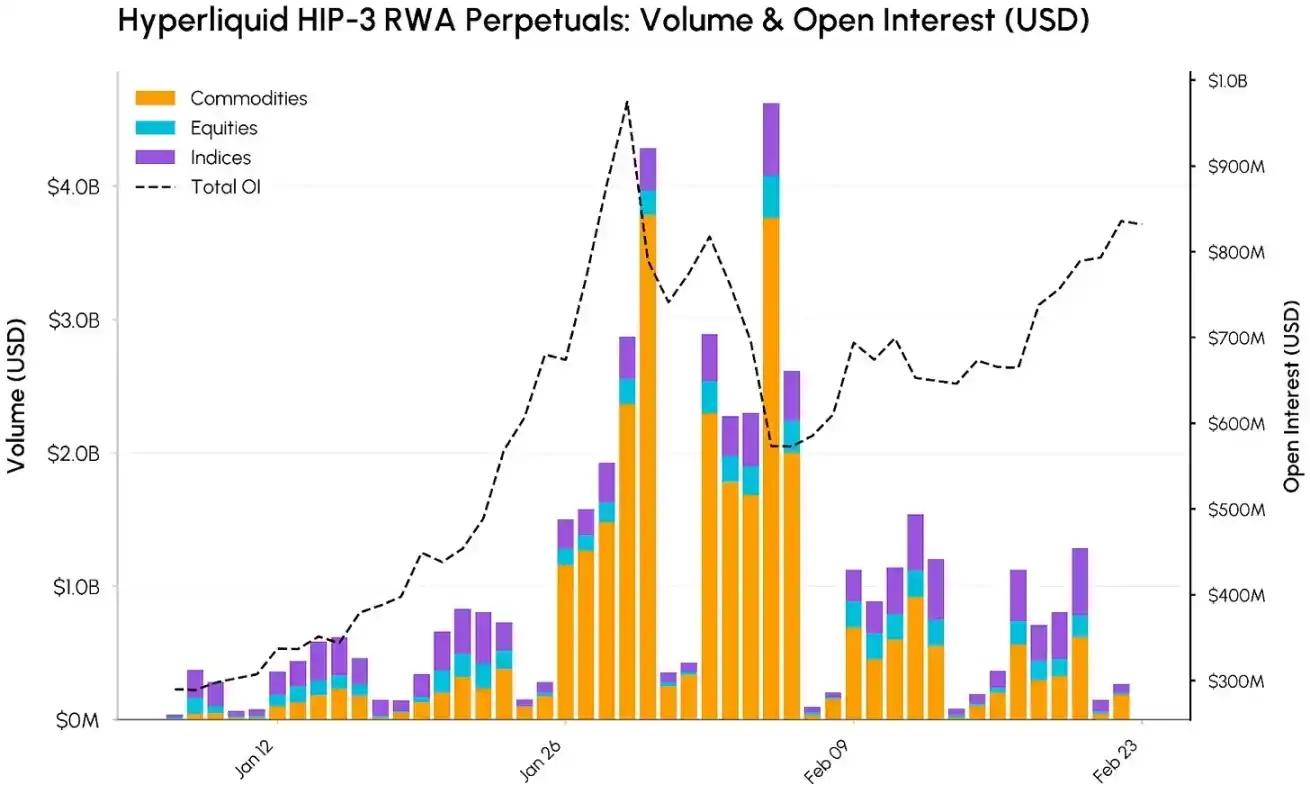
Although Bitcoin and Ethereum remain the assets with the largest open interest, HIP-3 markets have been increasing their share on the platform. On February 5, HIP-3 perpetual contract volume peaked at approximately $4.6 billion, driven mainly by commodities, with a single-day volume of $3.8 billion and cumulative volume exceeding $30 billion since January. Gold and silver were particularly prominent, with silver trading volume peaking at $3.4 billion.
Open interest (OI) grew simultaneously. Total open interest in HIP-3 markets increased from about $290 million in early January to a peak of nearly $975 million on January 29, before retreating to around $830 million by the end of February. This indicates sustained growing demand for on-chain exposure to commodities, stocks, and indices.
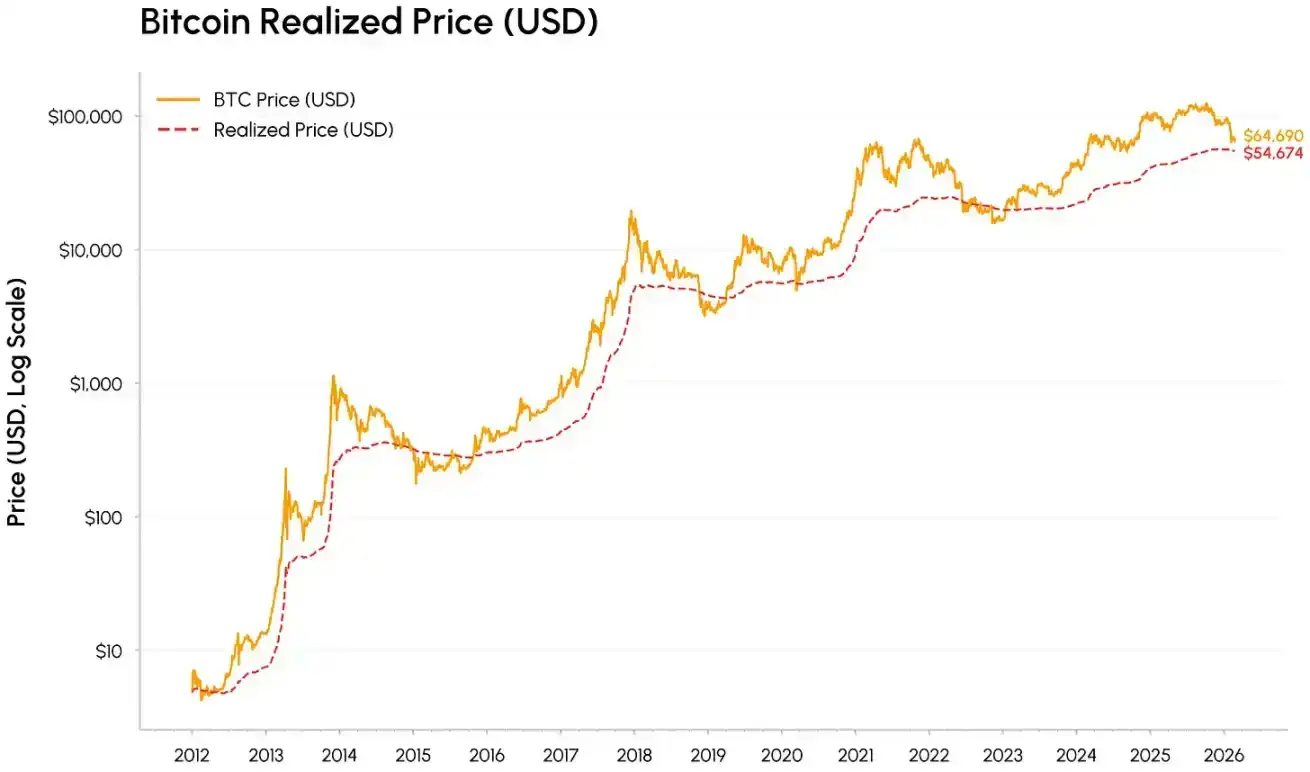
Bitcoin Enters the "Value Zone"
Bitcoin's decline has approached the realized price (currently around $55,000), which is the average on-chain holding cost of all coins. At cycle lows, Bitcoin has often traded near or below the realized price, marking the transition from market euphoria to capitulation and eventually into accumulation.
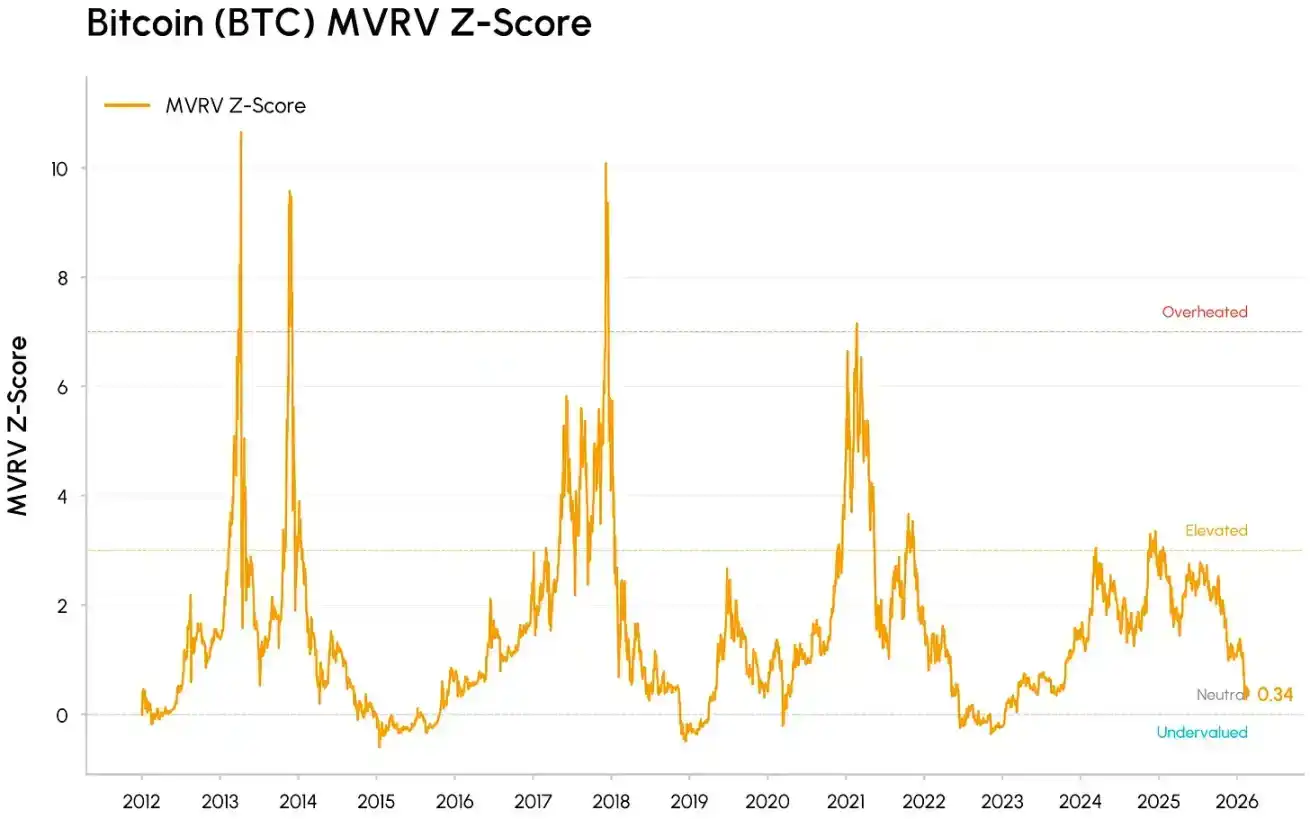
Meanwhile, valuation metrics like MVRV (market value relative to realized value) have compressed to historically undervalued ranges but have not yet reached the extreme levels seen at the bottoms of previous bear markets. These signals suggest: the market has squeezed out much of the泡沫 and is gradually entering the value zone.
Beneath the price adjustment, multiple trends continue to drive the integration of crypto assets into mainstream financial infrastructure. Hyperliquid's HIP-3 demonstrates how crypto trading platforms are increasingly being used to trade traditional assets. BlackRock's introduction of its tokenized fund BUIDL to Uniswap, as well as Apollo's agreement to acquire MORPHO tokens, similarly highlight how institutions are integrating DeFi liquidity and governance into their workflows.
Meanwhile, leading DeFi protocols like Aave and Uniswap are gradually moving towards clearer benefits for token holders and value accumulation, shifting the industry from pure narrative and governance-driven models to cash-flow-type assets. On the traditional finance side, CME's launch of 24/7 crypto futures trading and the CFTC's more positive stance on prediction markets show that regulatory platforms and policymakers are adapting to the 24/7 operational structure of crypto markets.
Conclusion
The February correction appears more like a stress test of capital and liquidity in a risk-off environment, rather than a collapse in fundamentals. Crypto assets continue to be traded as liquidity-sensitive, growth-linked assets, but their role in market infrastructure, institutional portfolios, and on-chain integration is deepening.
Short-term market conditions may remain volatile, but progress on the CLARITY Act and a reversal in fund flows will be key catalysts for determining whether demand can recover sustainably.


