Ether vs. Bitcoin (BTC): ETH Price Could Achieve 80% Gain by 2026
Ether's inverse head and shoulders pattern and rebound from a key accumulation zone suggest a potential 80% gain by 2026.

According to classic bullish reversal pattern analysis on long-term charts, Ethereum's Ether (ETH) could rise by over 80% against Bitcoin (BTC) by 2026.
Key Points:
The ETH/BTC chart suggests a potential move toward the 0.059-0.063 BTC range in 2026.
Rejection at the long-term trend line could cause the pair to fall back to 0.0175 BTC.
ETH Price Chart Hints at 80% Gain Against BTC
As of December, the two-week ETH/BTC chart shows a textbook inverse head and shoulders (IH&S) pattern, a classic bullish reversal model that typically appears after a long-term downtrend.
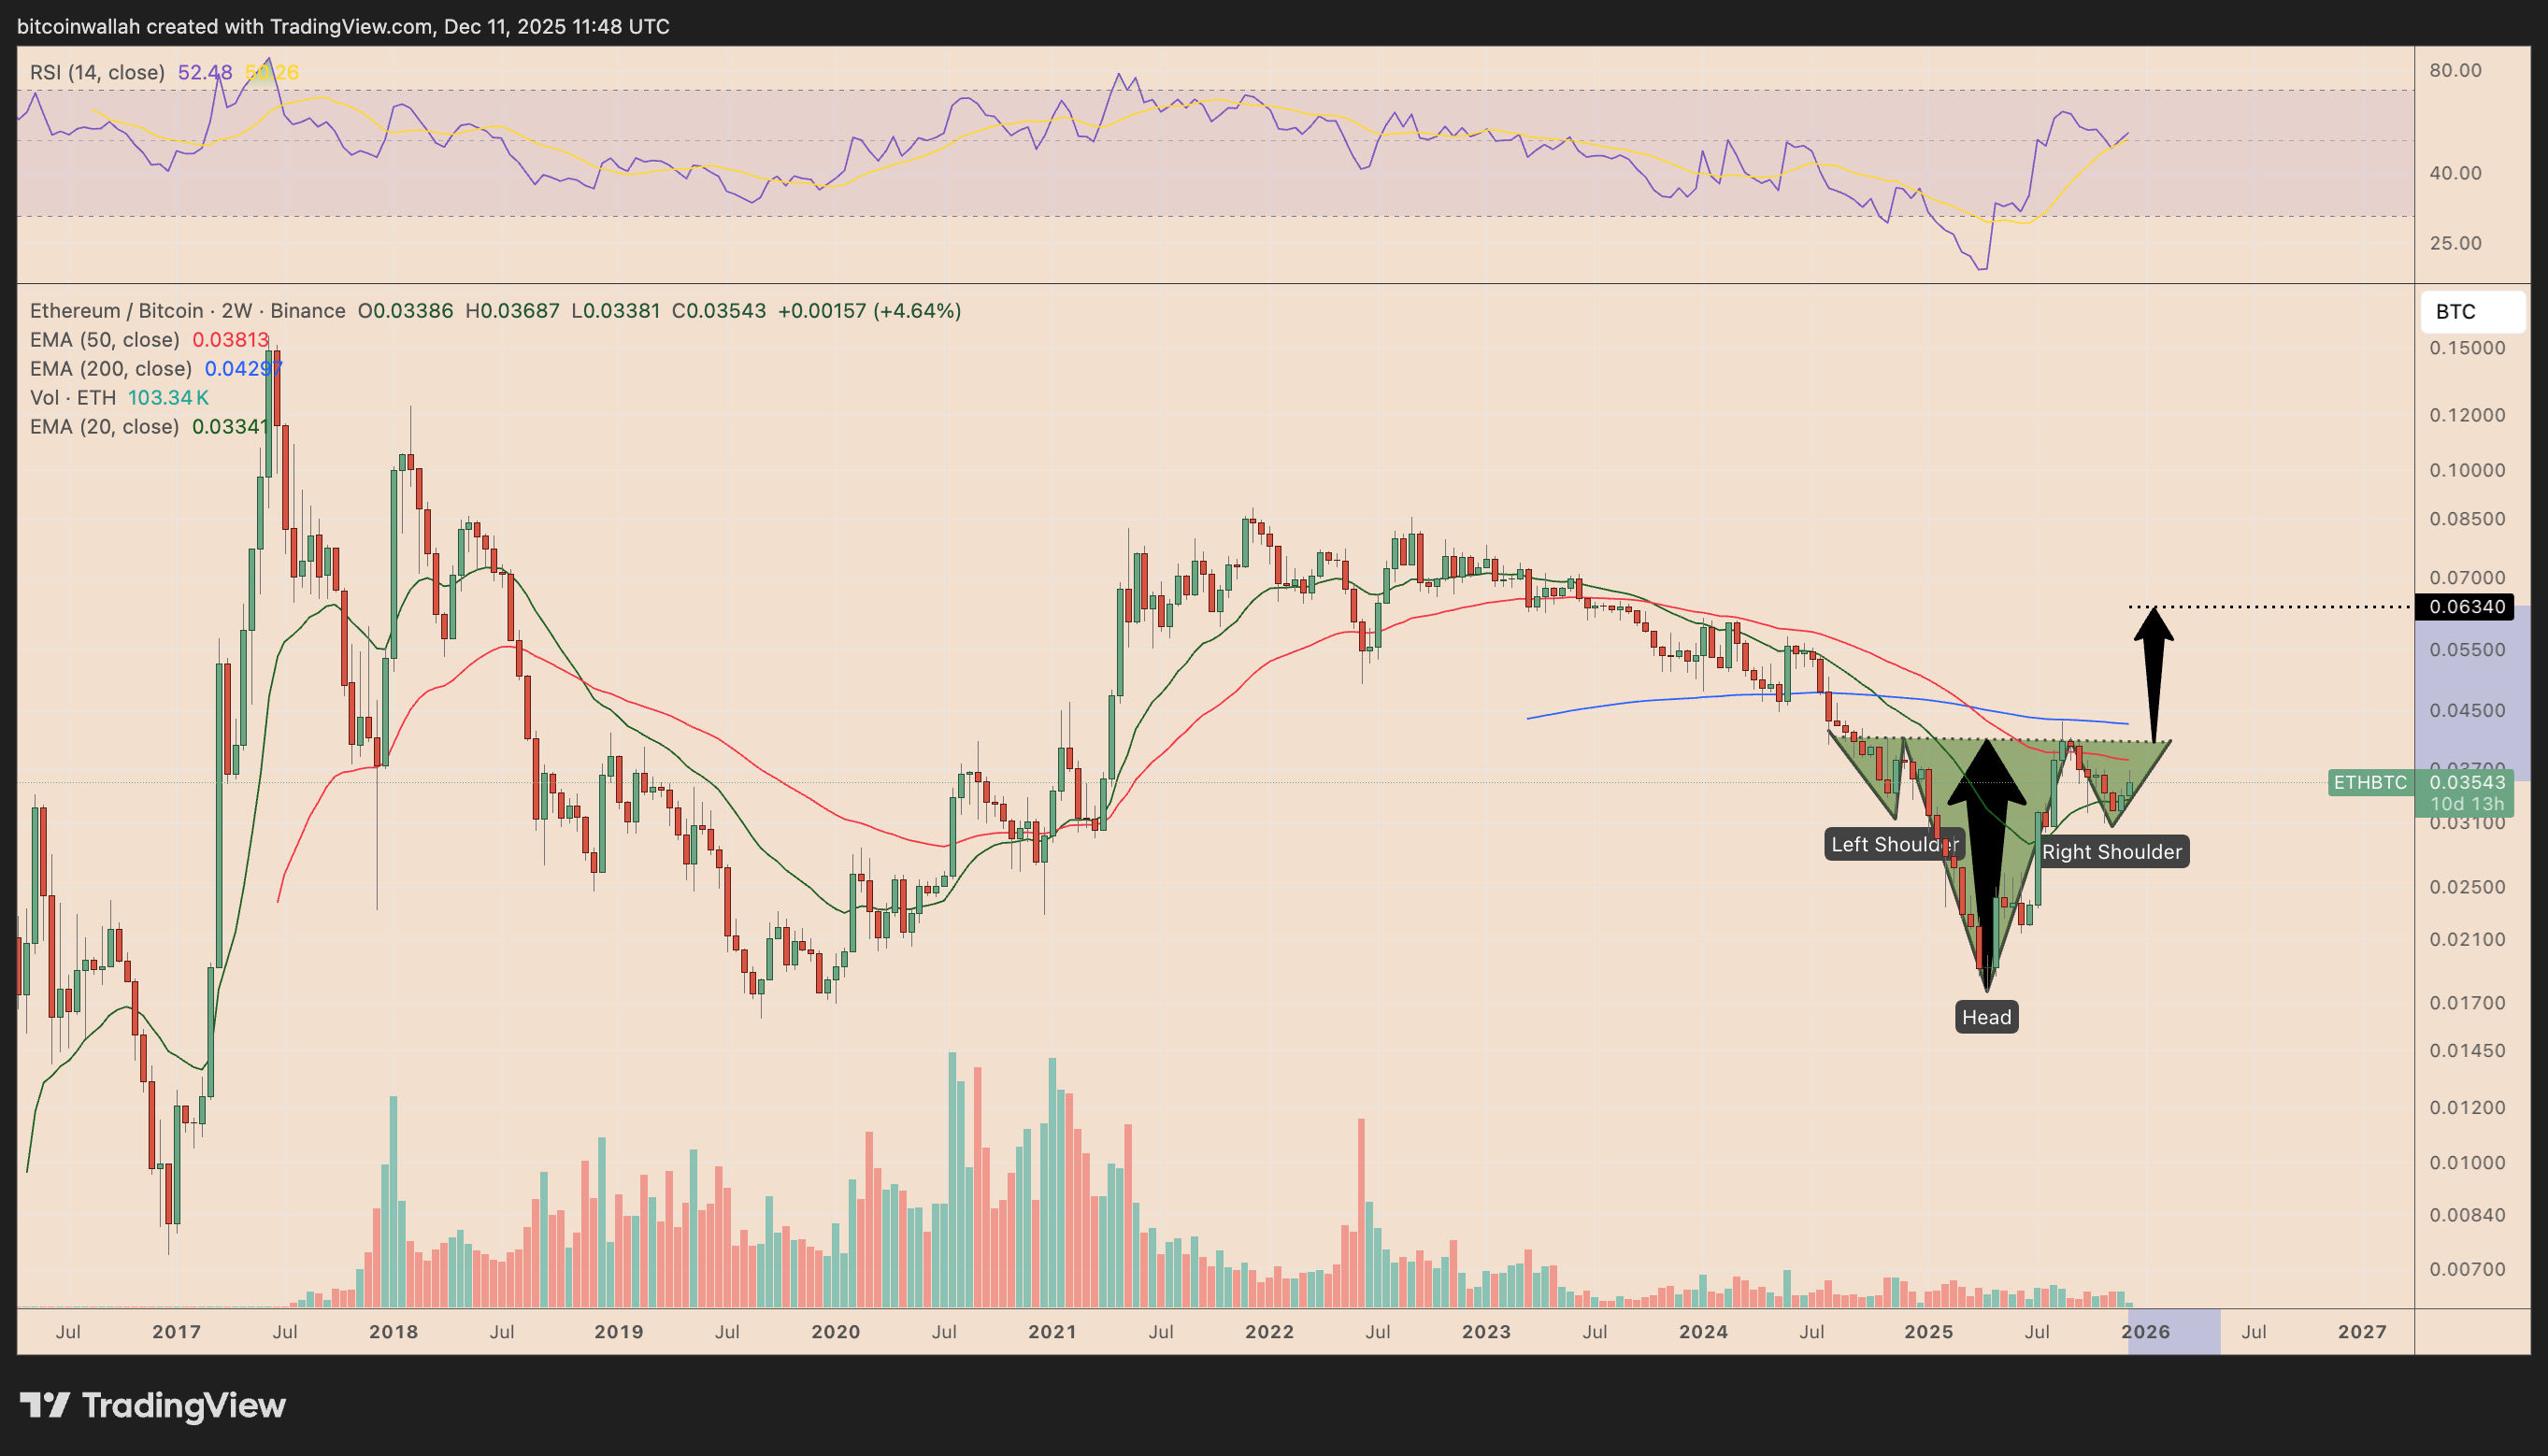
The left shoulder of this pattern formed during a weak period in late 2024, followed by a sharp sell-off in April 2025, forming the head near 0.0176 BTC. The subsequent recovery in Q4 2025 established higher lows, forming the right shoulder.
The neckline is near 0.0400 BTC, between the 50-week (red) and 200-week (blue) exponential moving averages (EMAs).
Analysts point out that breaking through this area would likely confirm the IH&S pattern, paving the way for a move toward the 0.063 BTC target price in 2026.
This upward target is 80% higher than Thursday's recorded ETH/BTC exchange rate.
Can ETH Replicate the 2020 450% Parabolic Rally?
The current rebound height of ETH/BTC is similar to its breakout after the accumulation phase in 2019-2020.
After bottoming in the same 0.0160-0.0200 BTC demand zone, the pair rose by nearly 450%.
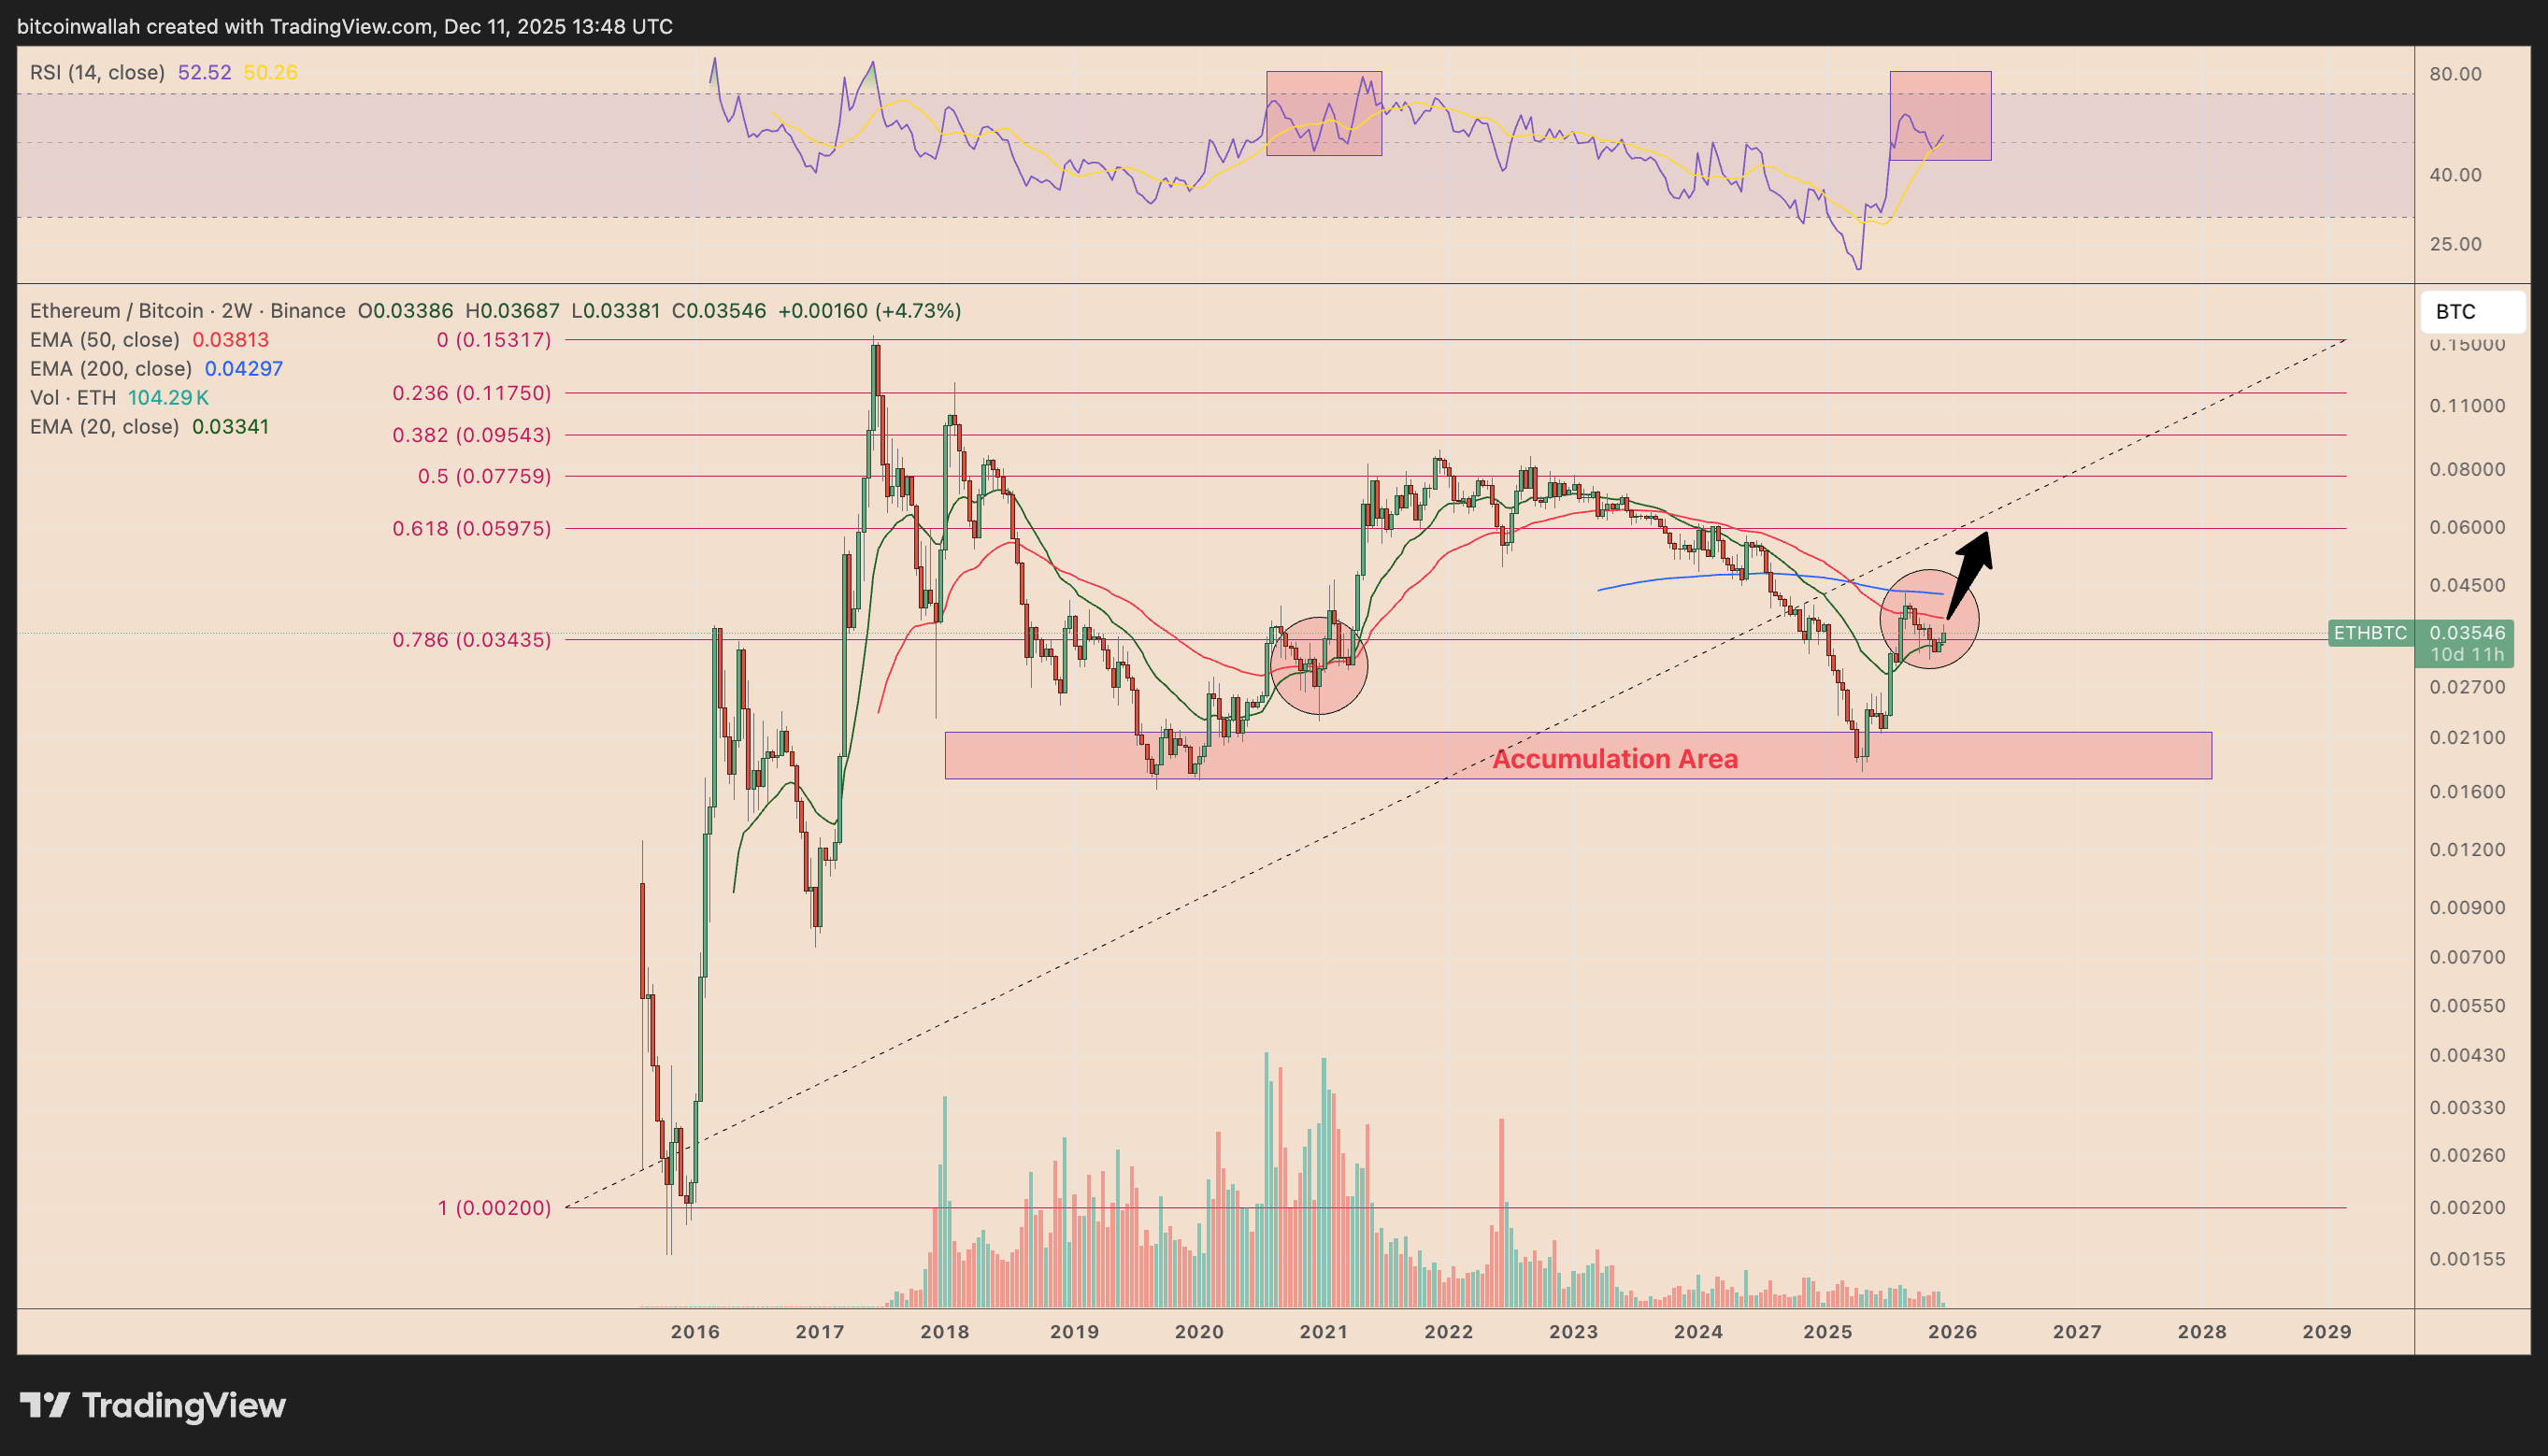
Ether's 2025 recovery stems from this same structural bottom, with the price now squeezing into the same early-stage resistance cluster (indicated by red circles in the chart above) as before the 2020 parabolic expansion.
Market experts believe that if this pattern continues to play out, ETH/BTC could climb to the 0.059 BTC Fibonacci region, a level consistent with the 2026 IH&S breakout trajectory.
Ethereum Still in Downtrend Relative to BTC
However, ETH bulls will need to prove that the long-term downtrend has indeed ended.
ETH is still constrained by a multi-year downtrend line, which has rejected every attempt to break through against BTC since 2017.
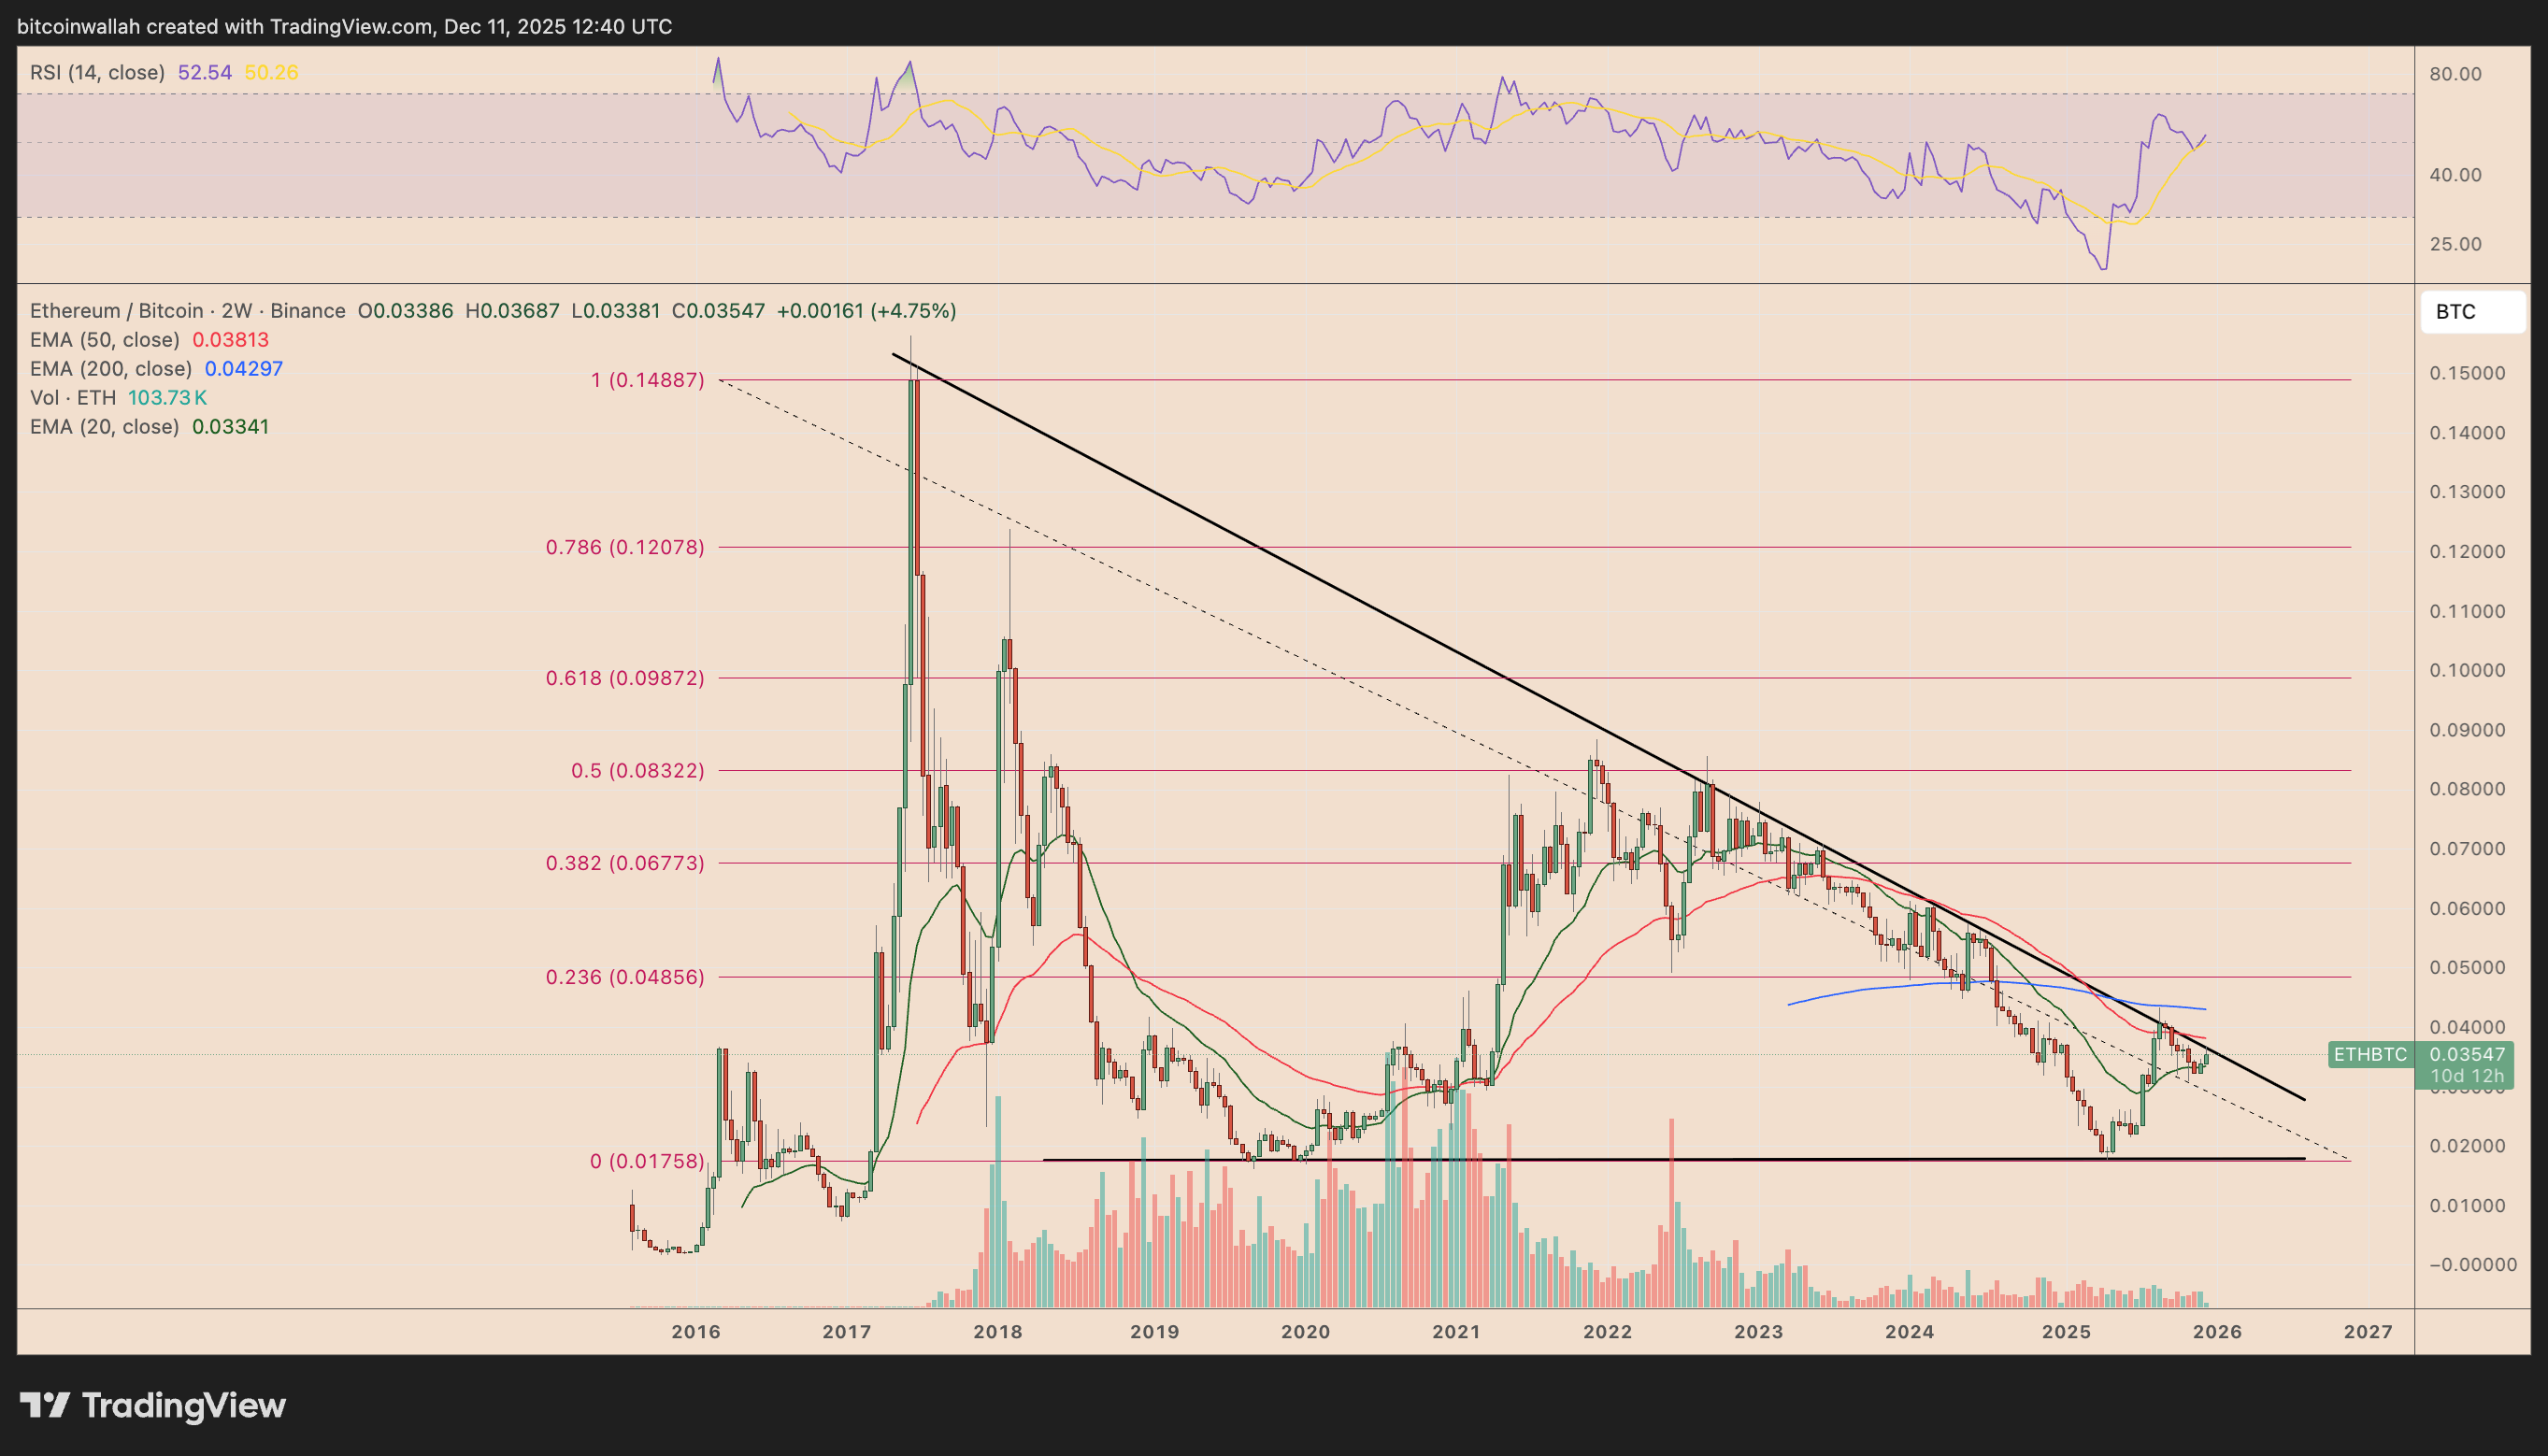
Technical analysts indicate that another failure at this obstacle would weaken the IH&S and the pattern setup, increasing the risk of a pullback toward the long-term 0.0175 BTC support in 2026.
Related recommendation: ETHZilla enters the on-chain housing finance领域 by acquiring 15% equity in Zippy
This article does not contain investment advice or recommendations. Every investment and trading move involves risk, and readers should conduct their own research when making a decision. Although we strive to provide accurate and timely information, Cointelegraph does not guarantee the accuracy, completeness, or reliability of any information in this article. This article may contain forward-looking statements that are subject to risks and uncertainties. Cointelegraph is not responsible for any losses or damages arising from your reliance on this information.