Ethena rallies 14.5% in a day, but THIS will limit further gains

ambcryptoPublicado em 2026-04-09Última atualização em 2026-04-09

Resumo

Ethena (ENA) rallied 14.6% in 24 hours, extending gains from earlier in the week, partly driven by a broader crypto market boost following former President Trump's ceasefire announcement. The project's plan to diversify its USDe stablecoin reserves into non-crypto assets has also contributed to positive momentum, aiming to address declining yields and supply since the October 2025 market downturn. Despite the recent surge, ENA's overall trend remains bearish. Technical analysis on the 1-day chart shows lower highs, with the RSI below 50 and declining OBV, indicating sustained selling pressure. The price has struggled to break the key $0.095-$0.10 resistance zone, where a cluster of short liquidations is located. The 4-hour chart structure is also bearish, and a break above $0.095 is needed to shift momentum bullishly. Traders are advised to consider taking profits near current levels, as the relief rally may be over, and a downward move could follow. The resistance band remains a significant barrier to further gains.

Ethena [ENA] has rallied 14.6% over the past 24 hours, extending the gains it made on Monday, the 6th of April. The crypto market saw a bullish boost from the short liquidations that followed President Trump’s ceasefire announcement.

Ethena plans to diversify its USDe reserve assets into non-crypto assets, which is why ENA has been rallying even before the announcement. The crypto rout since October 2025 saw declining USDe supply and yield.

The protocol’s founder, Gary Young, had said that Ethena was poorly positioned since that crash. Including non-crypto reserve assets will boost its falling yield and aid market performance.

ENA’s trend remains bearishly poised
Source: ENA/USDT on TradingView

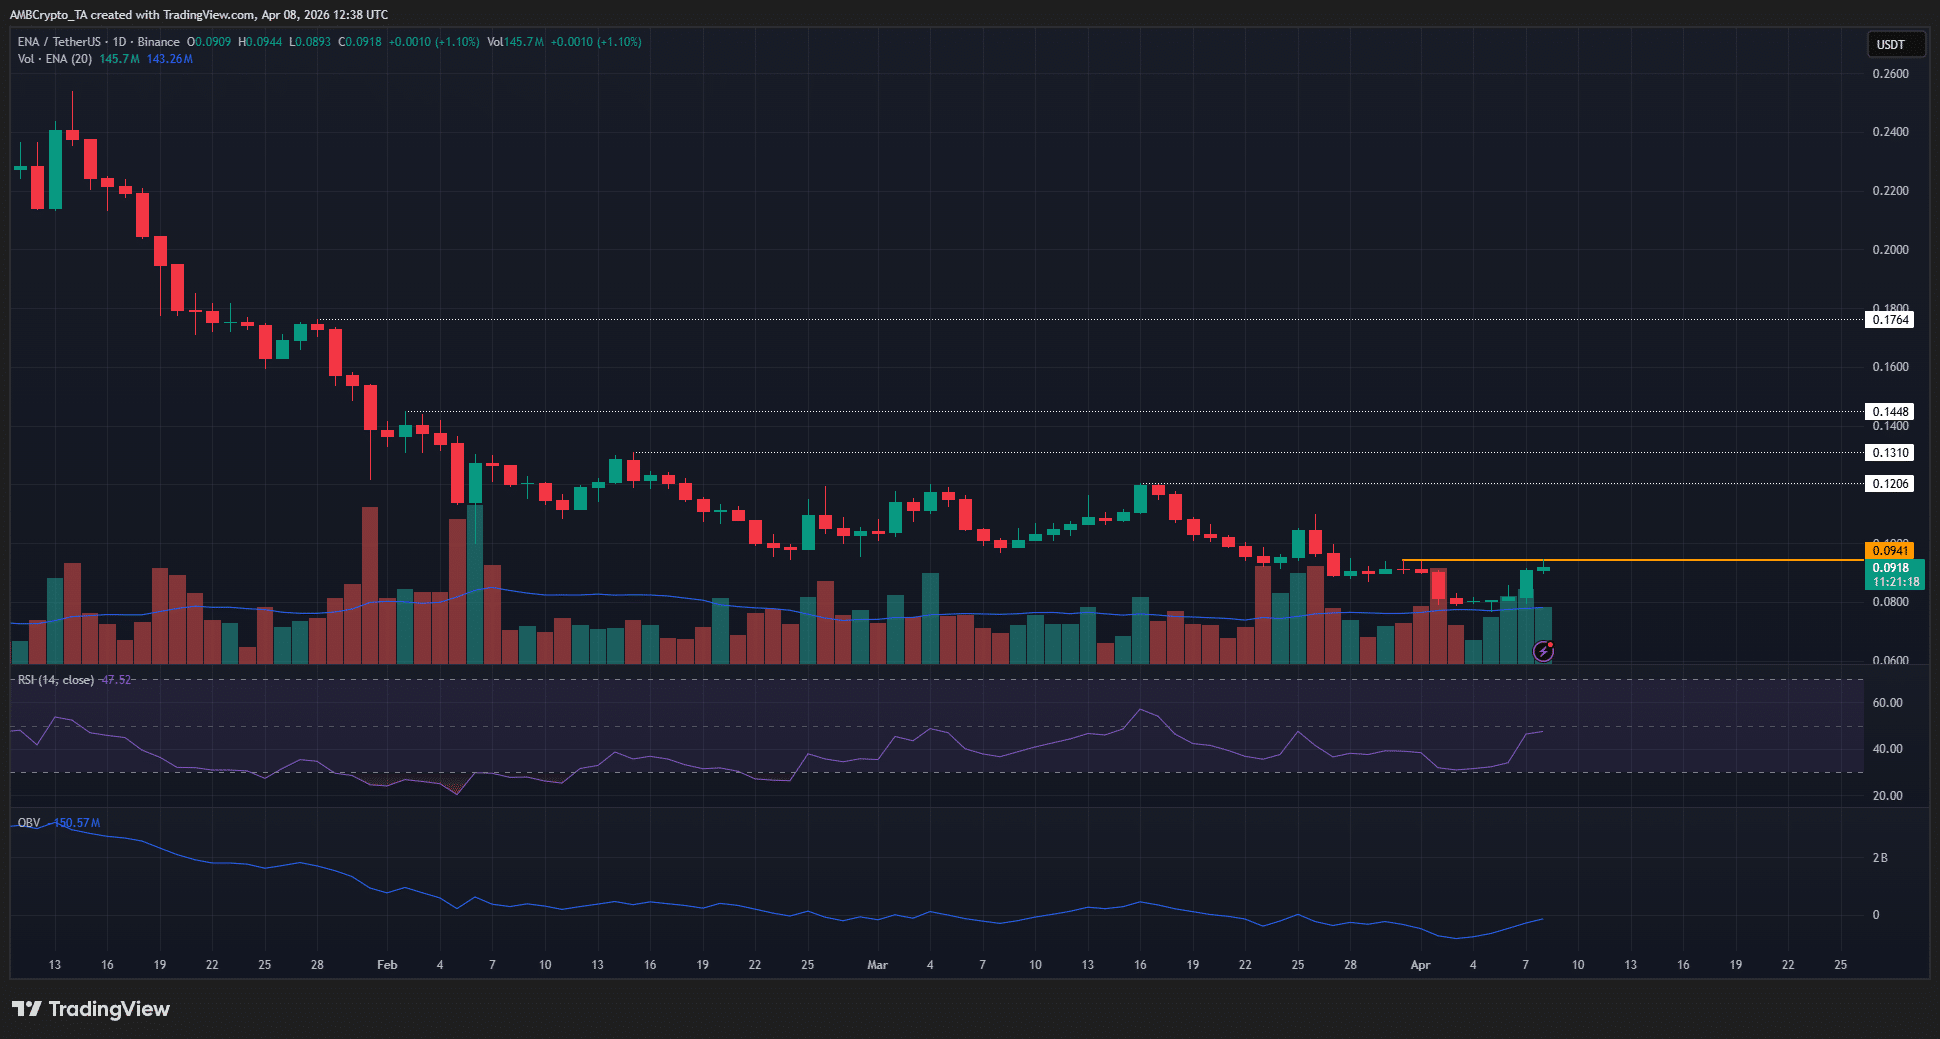
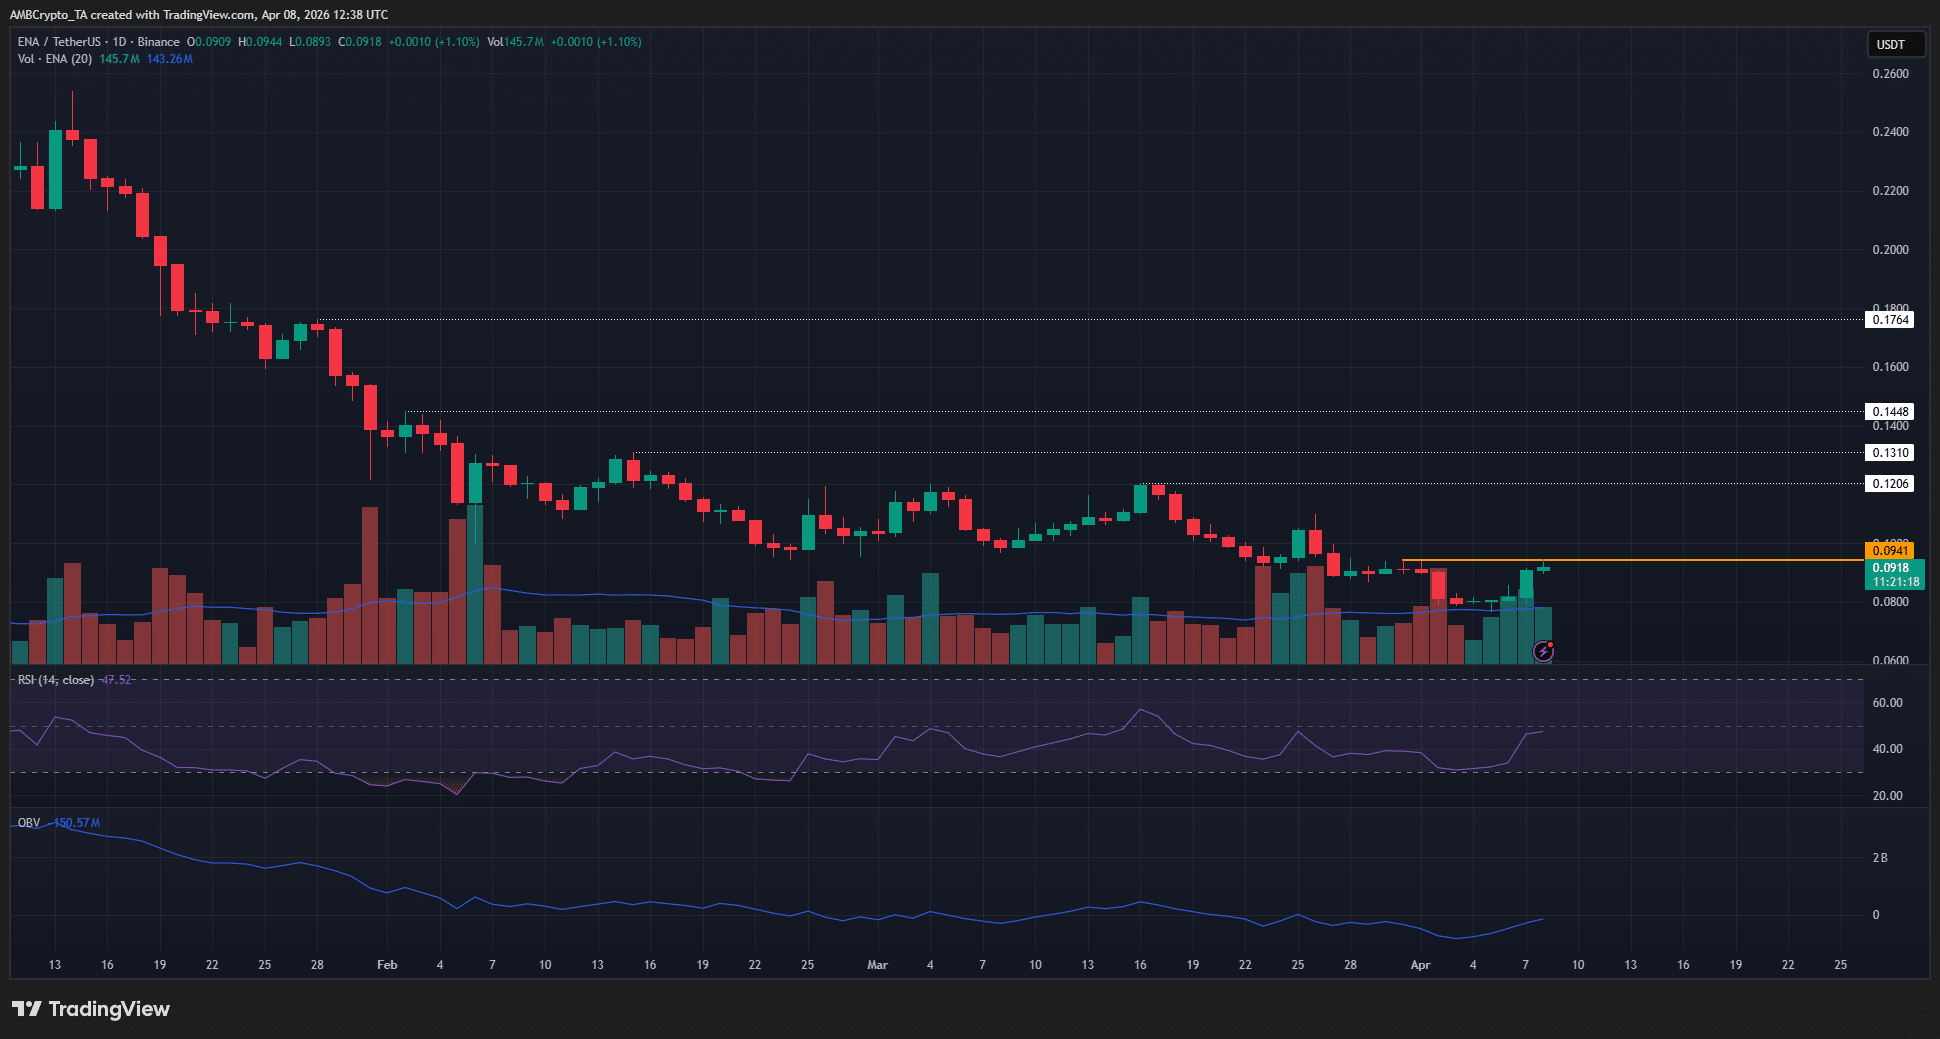
The lower highs on the 1-day timeframe, highlighted in white, showed that Ethena continued to labor under a bearish trend. The RSI was below neutral 50, and the OBV was in a slump, too.

This showed that the trend, selling pressure, and market structure were all in favor of the sellers. Even the rally in recent days, though it was high-volume, was unable to convincingly smash past the $0.094 local highs.

This was a complication for ENA bulls. Or, in a way, some pessimistic participants would say it makes the picture clearer. The sweep of the $0.095-$0.10 local highs means that the Ethena relief rally is over.

A new leg downward can commence from these liquidity pockets.

Traders’ call to action – Sell
Source: CoinGlass

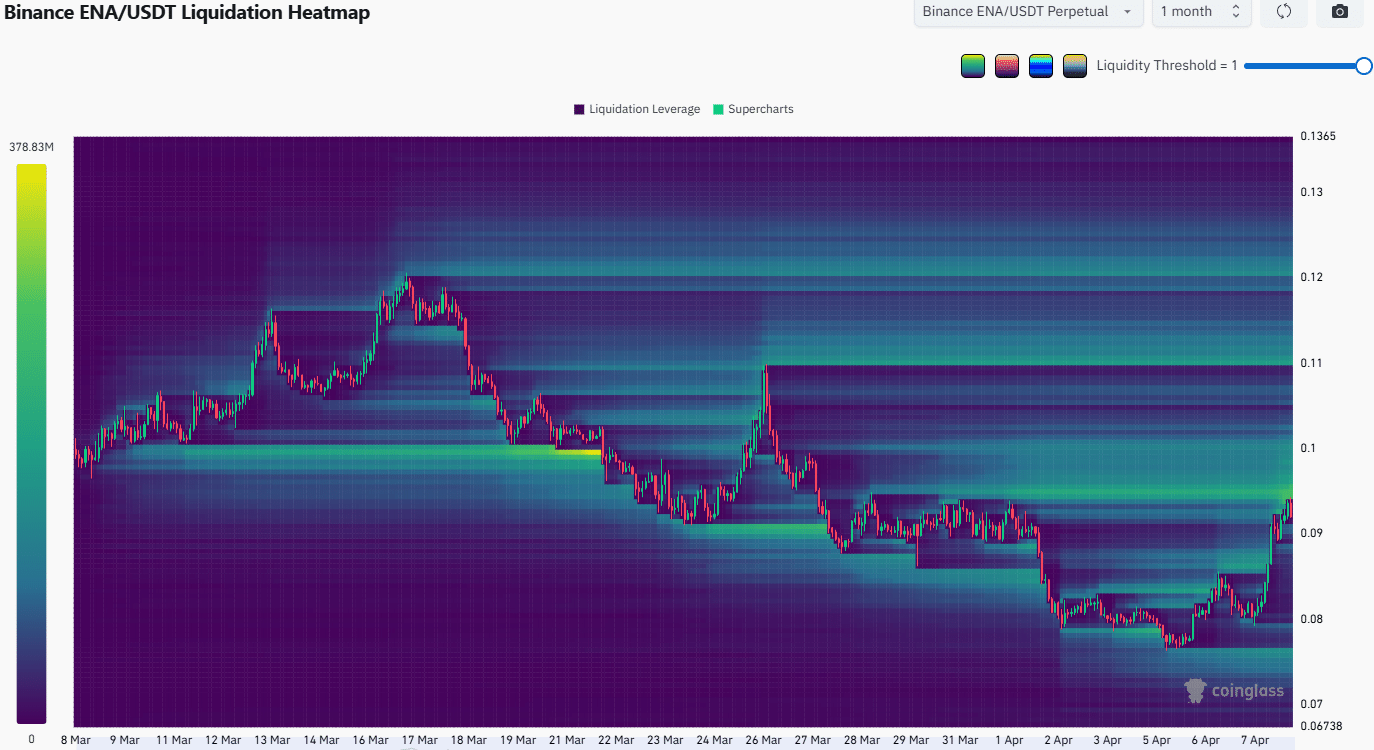
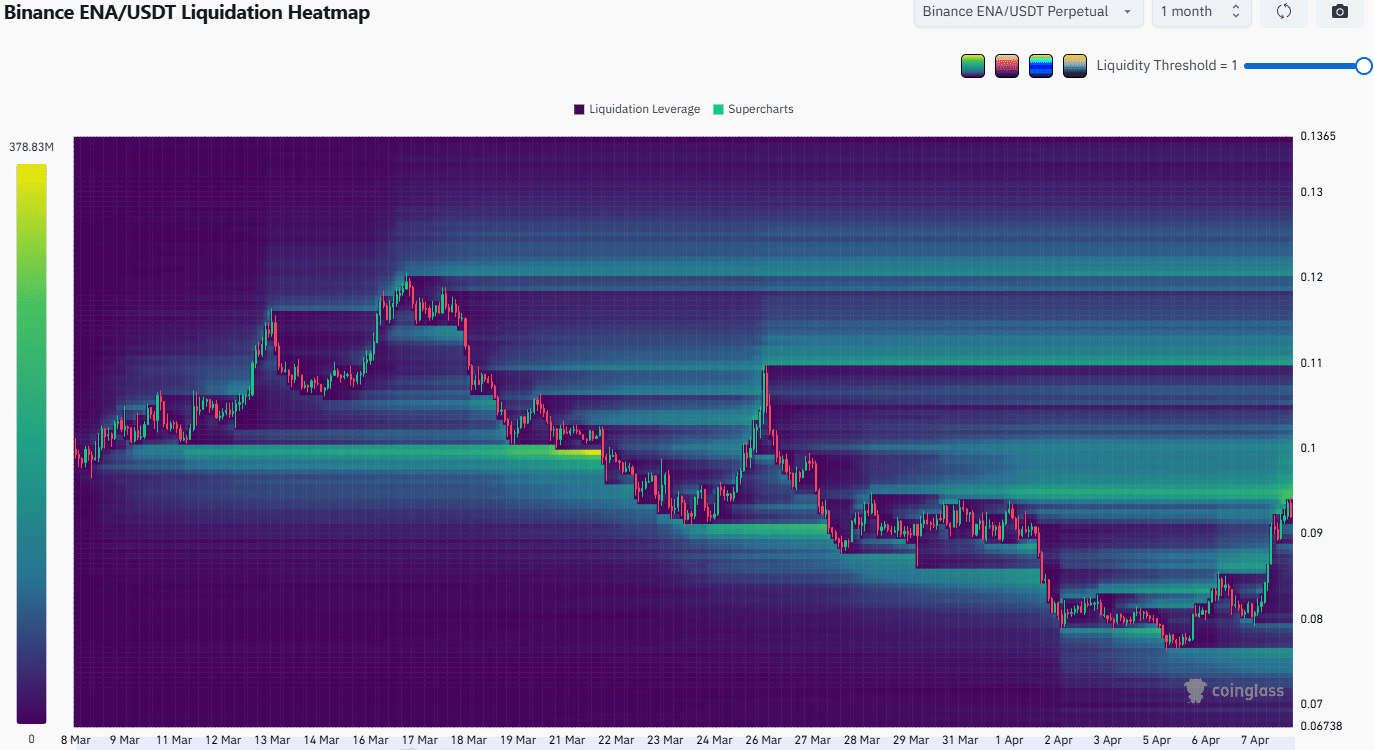
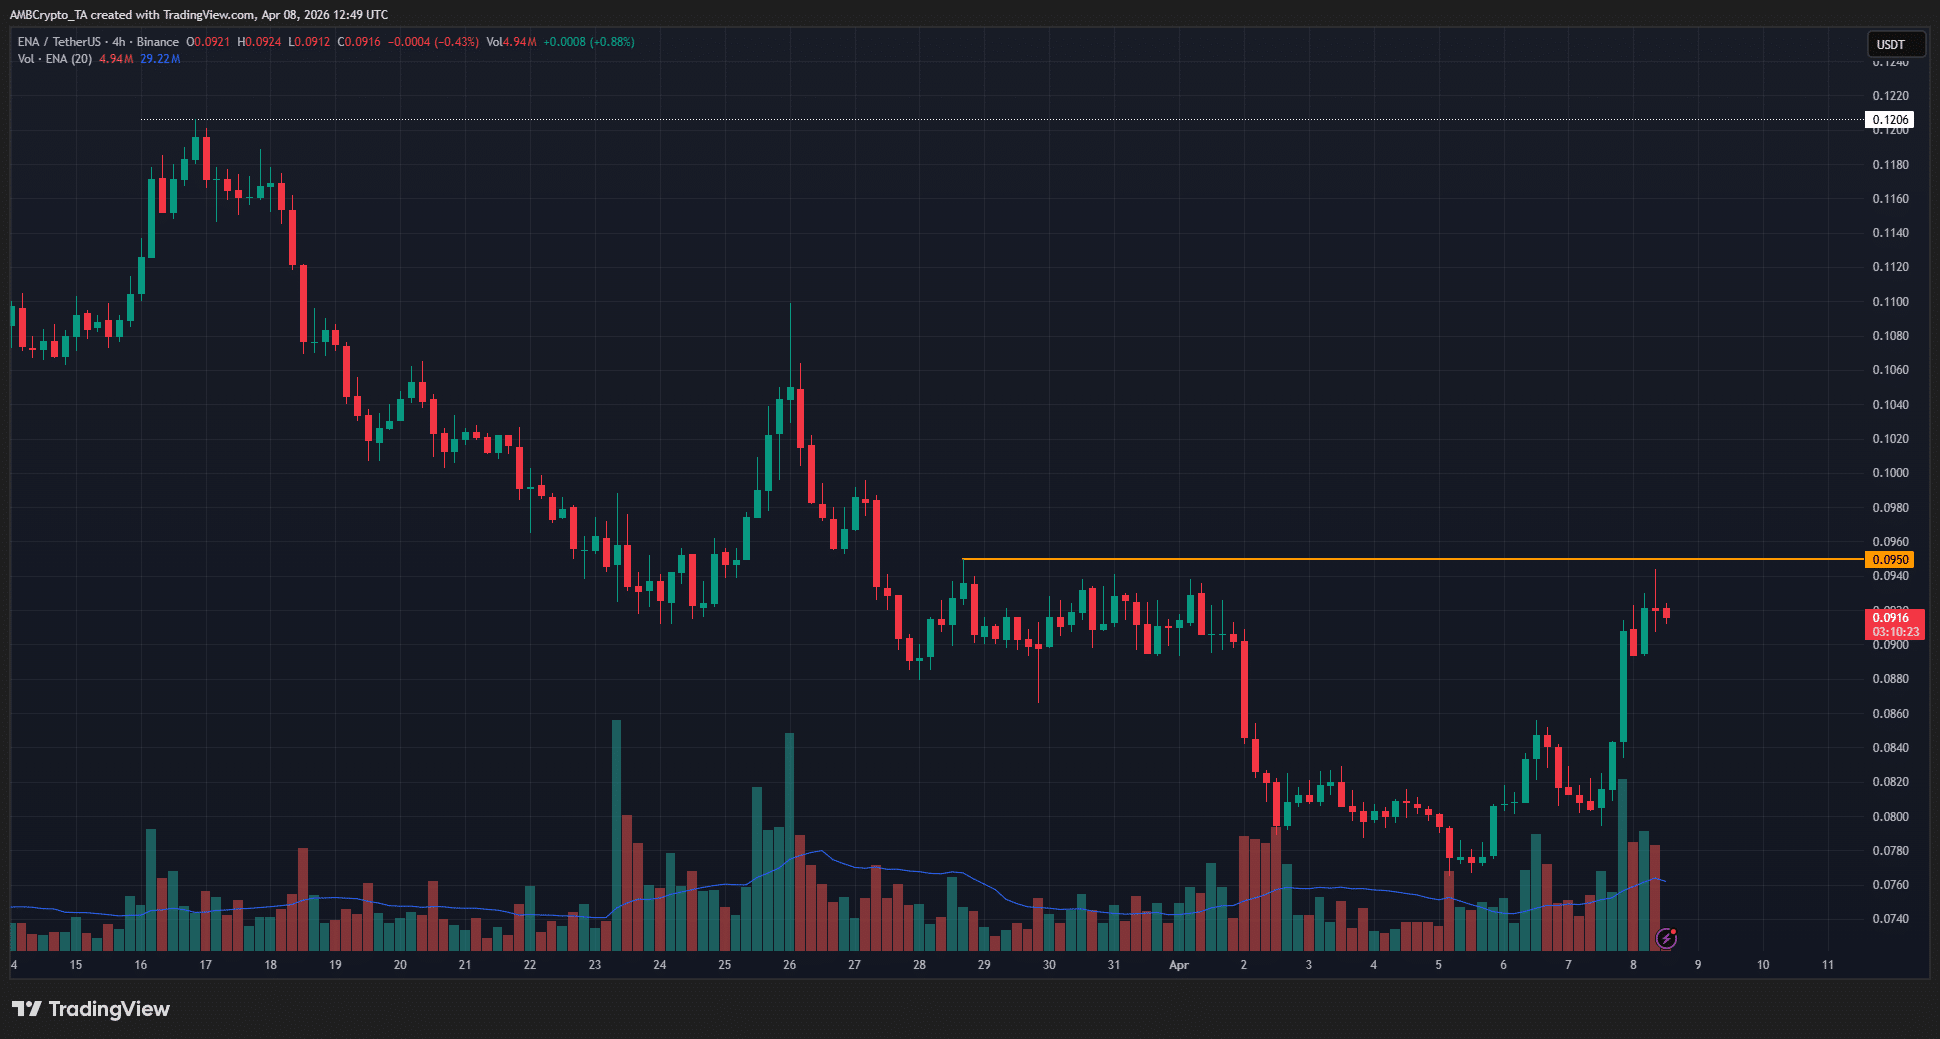
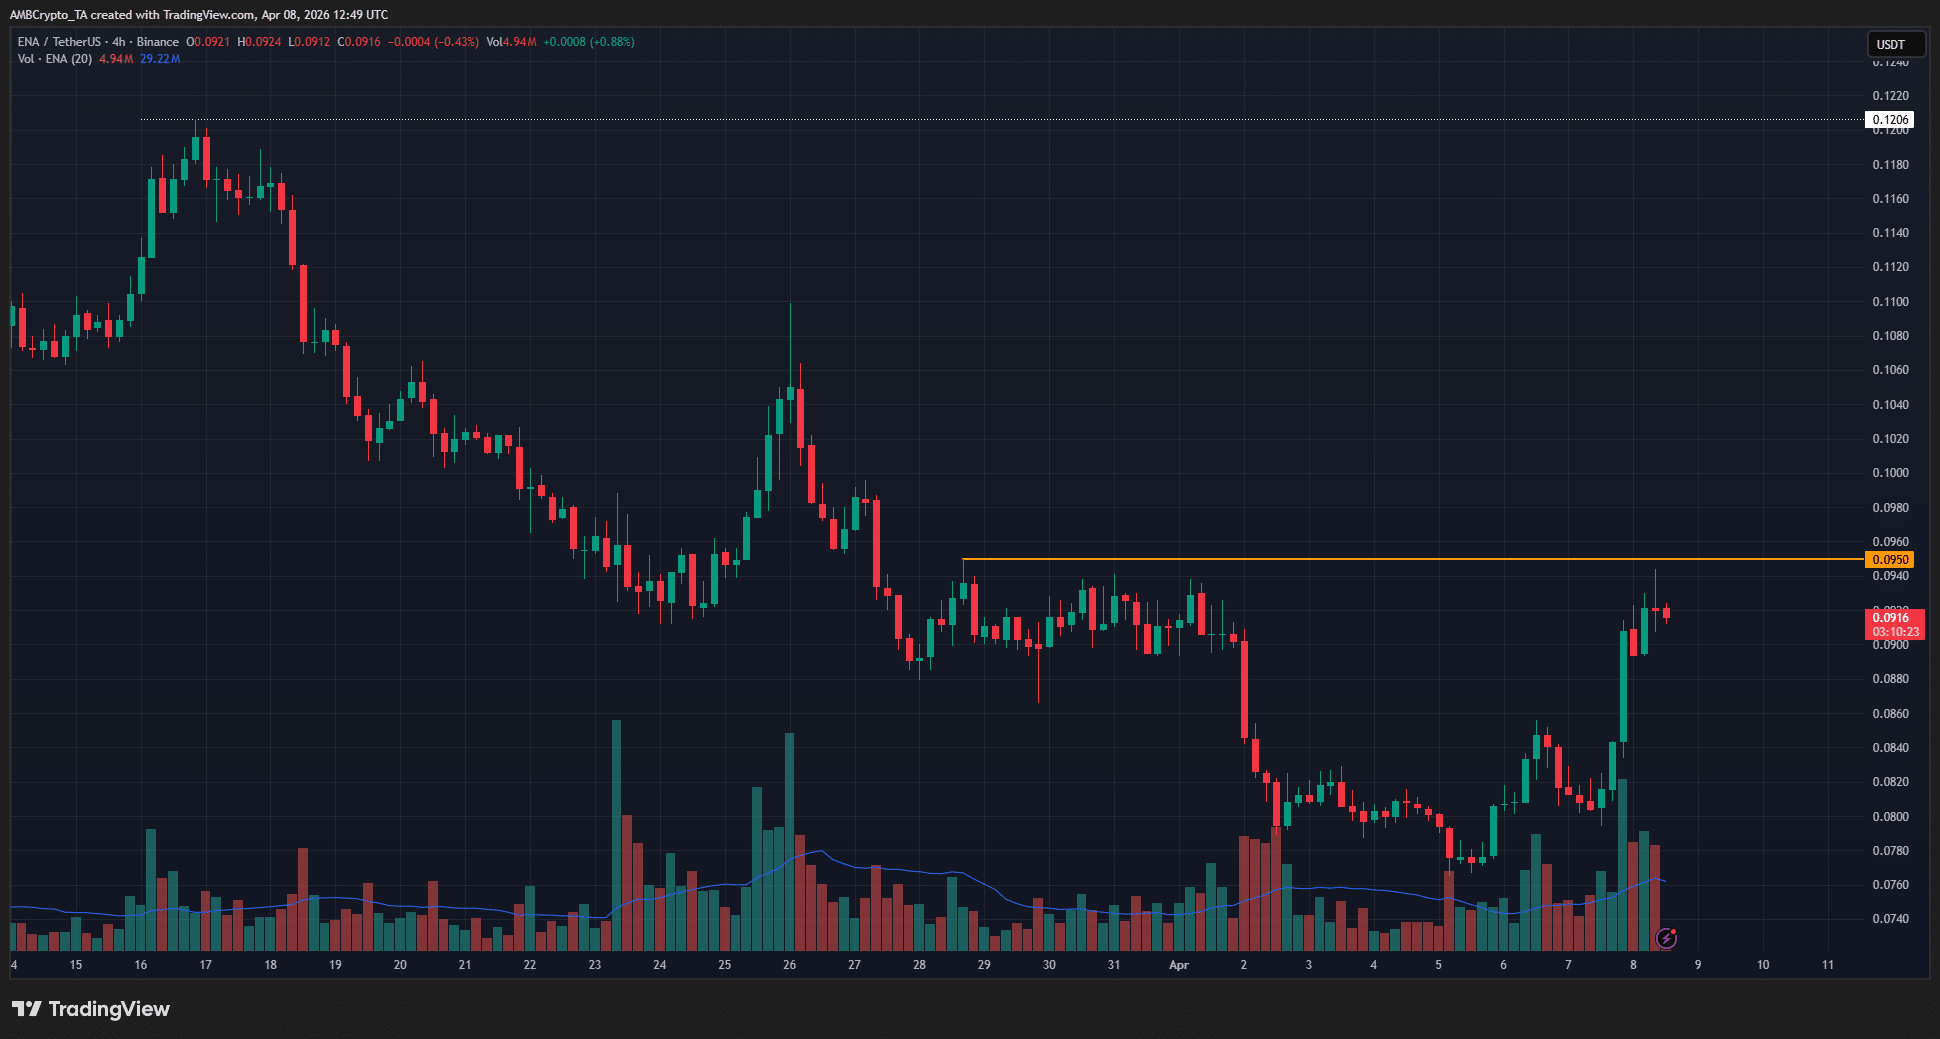
The past month’s liquidation heatmap showed a cluster of short liquidations from $0.094 to $0.10. This was the same band of resistance that the price has struggled to clear in the past 12 hours of trading.
Source: ENA/USDT on TradingView

The 4-hour timeframe’s structure remained bearish. The $0.095 level must be beaten for the swing structure to shift bullishly. A breakout and retest as support can inform bulls that the momentum might continue.

Until then, traders can maintain a bearish bias and look to take profits from the bounce.


Final Summary

  • Ethena has racked up sizeable gains since the start of the week and was aided by the ceasefire announcement and crypto market bounce.
  • The $0.095-$0.10 resistance level remained in place, and traders should be prepared to take profits in this area as the swing structure remained bearish.


Perguntas relacionadas

QWhat was the main reason behind Ethena's 14.6% price rally in the past 24 hours?

AThe rally was primarily driven by a bullish boost from short liquidations following President Trump's ceasefire announcement, as well as Ethena's plan to diversify its USDe reserve assets into non-crypto assets.

QWhy is Ethena planning to diversify its USDe reserve assets into non-crypto assets?

AThe diversification aims to boost Ethena's falling yield and improve market performance, as the crypto rout since October 2025 led to declining USDe supply and yield, leaving the protocol poorly positioned.

QWhat key resistance level is ENA struggling to break, according to the technical analysis?

AENA is struggling to break the $0.095-$0.10 resistance level, which has been a significant barrier despite recent high-volume rallies.

QWhat do the RSI and OBV indicators suggest about ENA's market trend?

AThe RSI is below the neutral 50 level, and the OBV is in a slump, indicating that the trend, selling pressure, and market structure are all in favor of sellers.

QWhat trading bias does the article recommend for ENA based on its current market structure?

AThe article recommends maintaining a bearish bias and taking profits from the bounce, as the swing structure remains bearish unless ENA convincingly breaks and holds above $0.095.

Leituras Relacionadas

Why Bitcoin Holds Above $64,000 After Fed's Hard Pause

**Bitcoin Stabilizes Near $64,000 Following Hawkish Fed Pause** The cryptocurrency market, led by Bitcoin, remained stable around $64,000 despite a volatile reaction to the latest U.S. Federal Reserve meeting. The Fed paused interest rates but signaled a hawkish stance, with three committee members voting for an increase—the highest dissent since 2016. This limits risk appetite but hasn't triggered panic selling. Key market highlights include Bitcoin ETFs seeing a net inflow of $32.1 million, breaking a streak of outflows, while Ethereum ETFs experienced outflows of $18.65 million. Liquidations affected about 90,000 traders. Technically, Bitcoin finds support around $63,000-$63,500, with major resistance near $66,000. While its price is about 49% below its all-time high, institutional demand via ETFs and the absence of mass capitulation support a potential recovery scenario in the second half of the year. Major altcoins showed mixed movements, with Solana attracting capital while Ethereum faced selling pressure despite strong on-chain metrics like a growing staking queue. Regulatory news took a pause as the U.S. Senate delayed the CLARITY Act vote until at least autumn. For the final trading day of July, U.S. inflation and consumer spending data will be crucial. Bitcoin's key levels to watch are $63,000 support and $66,000 resistance. Sustained ETF inflows and Bitcoin holding above $63,000 are seen as positive signs for a potential market recovery later in the year.

cryptonews.ruHá 1h

Why Bitcoin Holds Above $64,000 After Fed's Hard Pause

cryptonews.ruHá 1h

Trading

Spot
活动图片