Double Zero has moved decisively lower following a major liquidity shift that triggered broad capitulation.
At press time, the altcoin was down over 12%, with rebound prospects appearing muted as momentum remains notably weak. While market participants continue to anticipate a reversal, the technical confluence needed to support such a move has yet to materialize.
Downtrend deepens as 2Z loses momentum
Double Zero’s [2Z] decline does not appear to be slowing at the time of publication. From a technical perspective, the chart showed an absence of immediate support levels—zones that typically act as buffers for price stabilization or rebounds.
However, the chart does reveal a lower ascending support that could serve as a potential pivot for price action.
This structure aligns with a demand zone between $0.114 and $0.118, an area that may provide the necessary footing for the price to stabilize or attempt a recovery.
A rebound from this zone toward the $0.15 level would represent a potential 28% upside, with additional gains possible if momentum improves.
That said, trader confidence remains fragile. Over the past 24 hours, long-positioned traders have incurred losses exceeding $719,700, compared to just $2,400 in losses recorded by short sellers.
Technical indicators tilt firmly bearish
Technical indicators continue to argue against aggressive accumulation at current levels. The Moving Average Convergence Divergence (MACD) remained firmly bearish after printing a classic “death cross.”
This pattern forms when the MACD line crosses below the signal line and is often associated with prolonged downside pressure. Historically, such setups have preceded sharper declines as selling momentum accelerates.
The Relative Strength Index (RSI) reinforces this bearish setup. At the time of publication, the RSI had slipped into the bearish zone between 30 and 50 and printed a reading of 46, with momentum still trending lower.
A sustained decline in the RSI typically reflects weakening market strength and raises the likelihood of continued downside price action.
If both indicators remain under pressure—particularly with the MACD firmly in negative territory—2Z could face deeper losses in the near term.
Spot demand lags as derivatives traders hold long bias
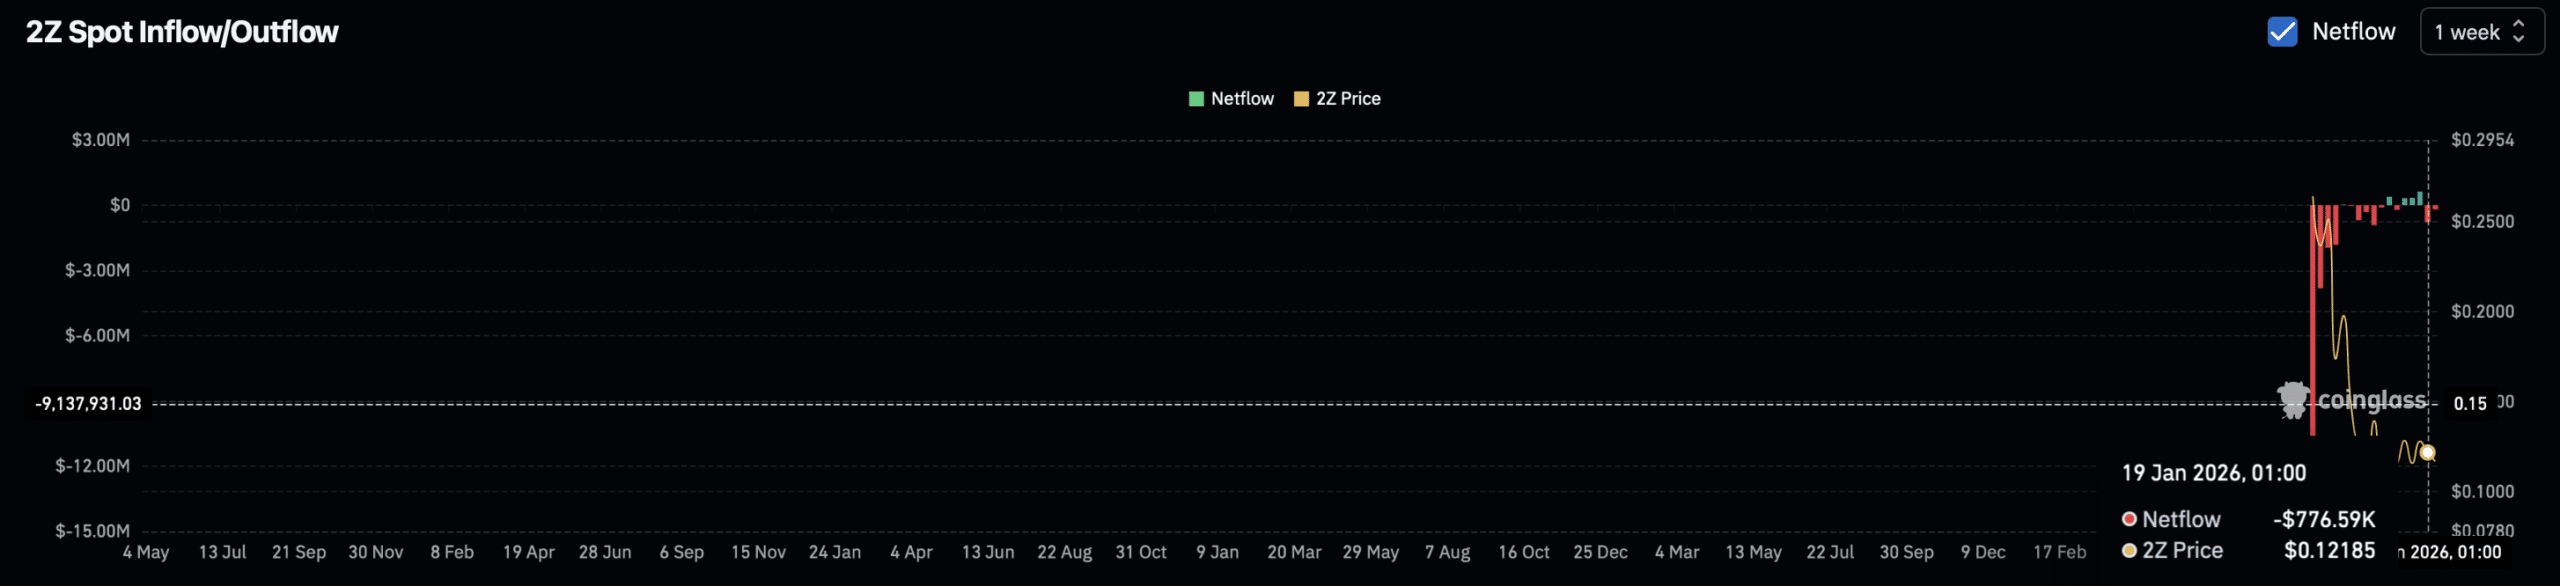
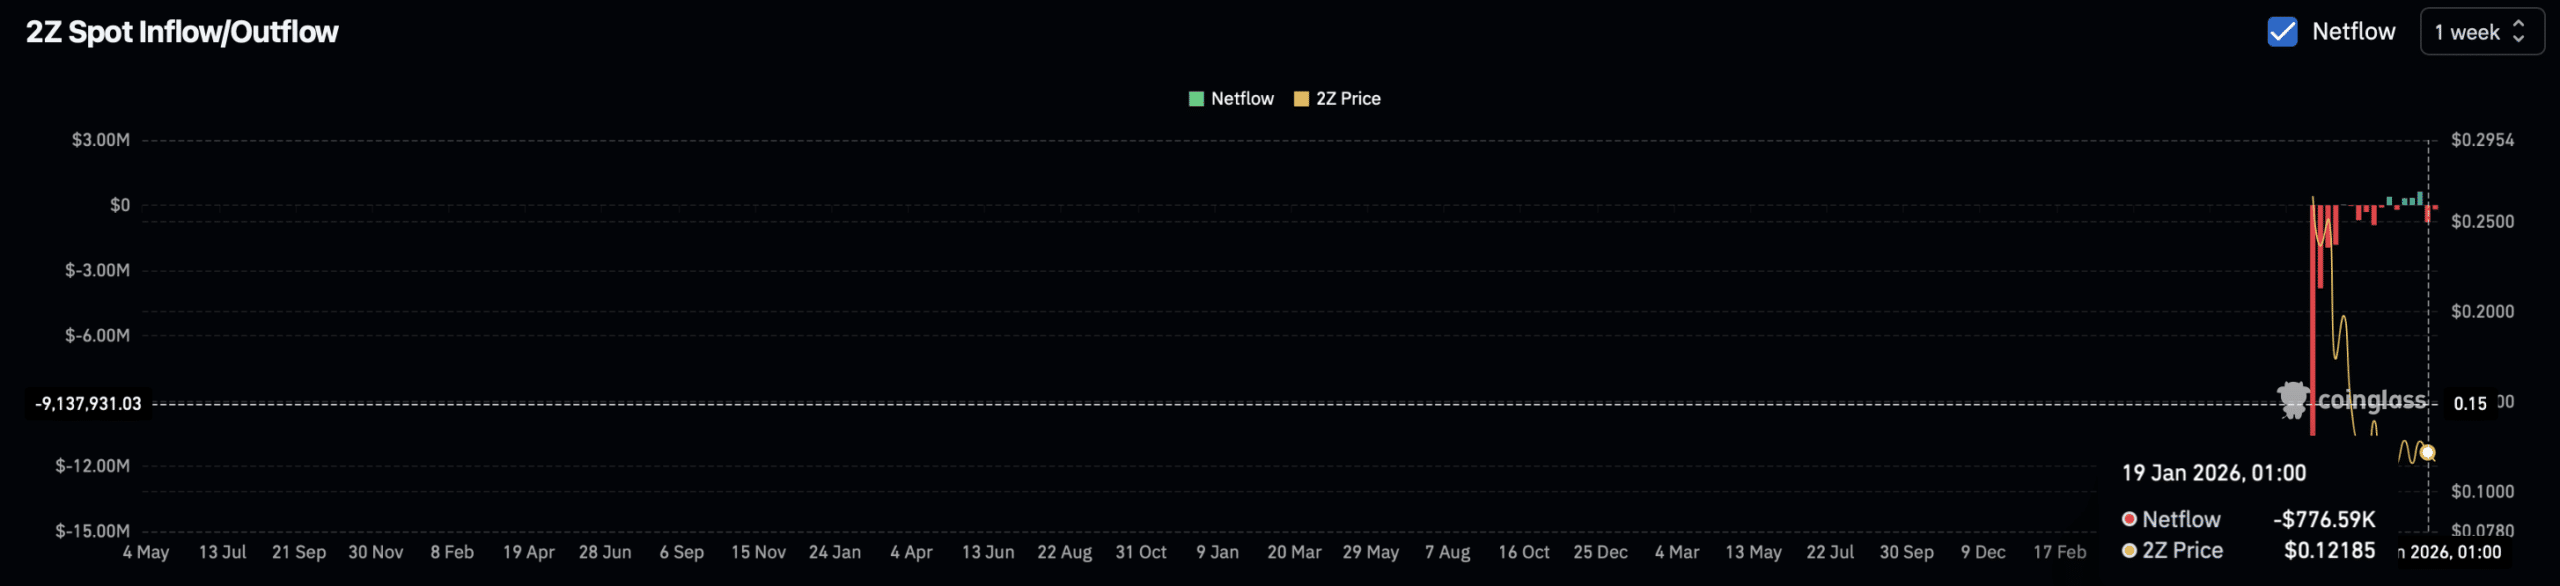
Spot market activity showed signs of accumulation, with buyers adding to positions over the past two weeks. However, the scale of these purchases remains modest.
According to CoinGlass Spot Netflow data, total spot purchases over this period amounted to approximately $874,400. While this inflow may help slow the pace of the decline, it remains insufficient to provide meaningful price support.
Meanwhile, sentiment in the 2Z perpetual market continued to hint at a potential rebound near the previously identified support zone.
The Long-to-Short Ratio, which tracks directional positioning—above 1 indicating long dominance and below 1 signaling short control—supports this view.
At press time, the ratio stood at 1.043. In addition, the Open Interest–Weighted Funding Rate printed a positive 0.0019%, suggesting that capital positioning remained tilted in favor of bullish traders.
This indicates that despite recent liquidation losses, trader conviction on the long side remains intact. Whether this positioning holds may prove pivotal in shaping 2Z’s next directional move.
Final Thoughts
- 2Z may extend its decline until it finds a support level capable of cushioning further losses, even as a potential 28% rebound remains in view.
- Indicators point to a short-term pullback, although spot traders and perpetual 2Z traders continue to maintain a bullish bias.







