Double Zero: Explaining why 2Z’s 10% rally faces downside risks

ambcryptoPublicado em 2026-01-24Última atualização em 2026-01-24

Resumo

The Double Zero (2Z) protocol's token rallied over 10% in 24 hours, driven by speculative inflows into derivatives rather than organic spot demand. While open interest surged to $22.6M and funding rates turned positive, indicating bullish sentiment among retail traders, key risks remain. Binance’s top traders are increasingly bearish, with a taker sell ratio of 0.73, suggesting caution at the whale level. Liquidation clusters below the current price also pose downside risks, potentially acting as magnets for a correction if momentum weakens. Despite the rally, the lack of broad holder growth and whale skepticism highlights fragility in the uptrend.

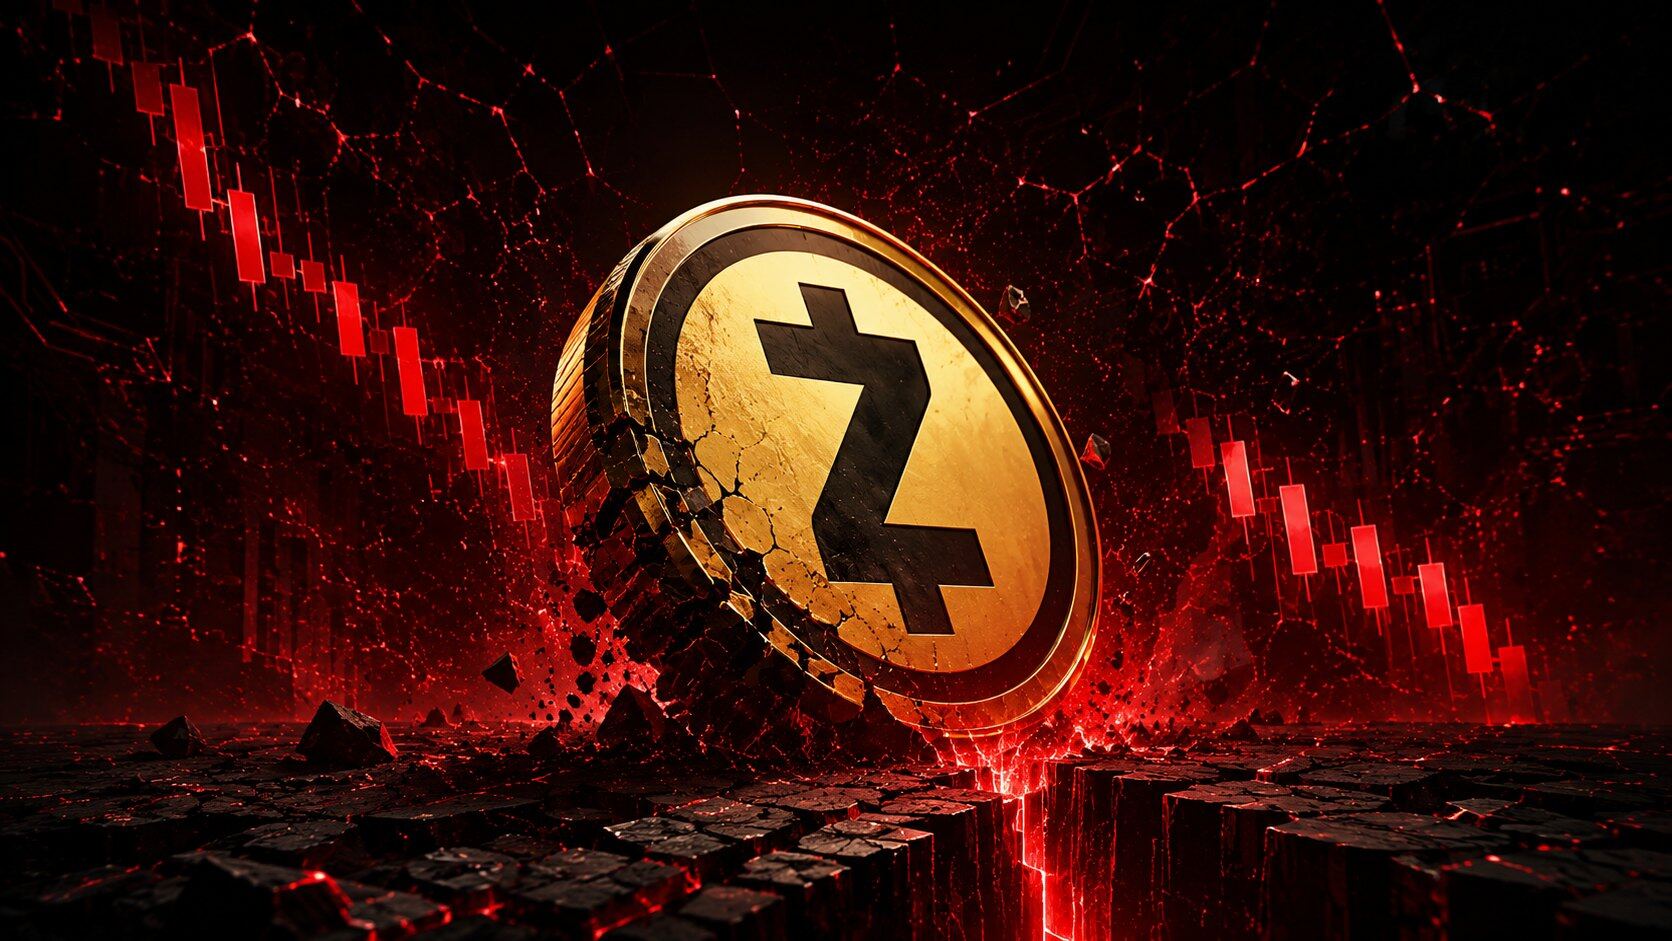
The Double Zero [2Z] protocol, a performance management and creation network for blockchain infrastructure, has seen its token rally over 10% in the past 24 hours, at press time, amid rising inflows into the derivatives market.

Despite the price increase, market participation remains heavily skewed toward speculation. Spot market involvement stays limited, while the number of token holders has remained largely unchanged at around 6,710, highlighting the lack of organic demand behind the move.

Adding to the caution, perpetual whale participation on the buy side remains muted. Binance top traders have yet to commit meaningfully to bearish positioning, raising concerns over the durability of the current rally.

What’s driving 2Z’s price increase?

The recent upside in 2Z has been fueled primarily by a surge in speculative capital rather than sustained spot buying.

In the past 24 hours, traders opened $9.22 million worth of 2Z perpetual contracts, pushing Open Interest to $22.6 million, as of writing. This represents a heightened conviction across both sides of the market.

The spike in derivatives activity follows Double Zero achieving a throughput of 4.45 TBps (terabytes per second), a performance milestone that makes the network roughly 4,450 times faster than a standard home internet connection.

This upgrade significantly expands bandwidth capacity for blockchains built on or integrated with the protocol.

While the development improves the network’s technical appeal, bullish positioning has been validated more clearly through Funding Rate data than price action alone.

Funding Rates, which indicate which side of the market pays a premium to maintain positions, have turned decisively positive.

Moreover, long traders were paying a Funding Rate of 0.0047%, signaling that bullish participants are willing to absorb higher costs to maintain exposure. This adds confidence to 2Z’s broader outlook, at least among retail and mid-sized traders.

Binance whales remain cautious

The Taker Buy/Sell Ratio provides insight into whether perpetual market volume favors buyers or sellers.

On a market-wide basis, the ratio remains above 1, indicating that bullish trades still outweigh bearish ones across total volume. This suggests that long positions continue to dominate overall market activity.

However, a closer look at top trader behavior reveals a contrasting picture. Data shows a steady increase in bearish positioning among whales, with taker sell orders beginning to outweigh taker buys at the top-trader level.

Top trader positioning currently stands at 0.73, well below the neutral threshold of 1. This indicates that large traders are increasingly skewed bearish, a notable risk factor given their influence over both liquidity and price direction.

These traders continue to account for a significant share of activity in 2Z’s perpetual market, which is currently seeing volumes around $34.62 million.

Despite this divergence, broader market conditions remain relatively balanced. At the time of writing, the overall Binance Taker Buy/Sell Ratio stood at 1.36, as retail traders are still providing bullish momentum and offsetting whale-driven selling pressure.

Downside risks remain in focus

While 2Z’s recent gains have attracted attention, they do not guarantee a continuation of the rally.

An examination of the liquidation heatmap points to potential downside risk. Several liquidation clusters have formed below the current price level, creating areas where price could gravitate if momentum weakens.

These clusters often act as magnets for price action, pulling the market toward zones of concentrated liquidity. With multiple clusters positioned beneath the current level, 2Z could still face a corrective move in the near term.

That said, liquidation data does not dictate price direction with certainty. In some instances, markets move away from these zones without triggering pending liquidations, especially when sentiment shifts abruptly or fresh capital enters the market.


Final Thoughts

  • Capital inflows into 2Z remain elevated as speculative traders bet on continued price appreciation.
  • Binance top traders, however, have increased sell-side exposure, with short contracts dominating volume at key levels.

Perguntas relacionadas

QWhat is the primary reason behind the 10% price rally of the 2Z token in the past 24 hours?

AThe recent upside in 2Z has been fueled primarily by a surge in speculative capital from the derivatives market, rather than sustained organic spot buying.

QWhat key technical milestone did the Double Zero protocol achieve, and what is its significance?

ADouble Zero achieved a throughput of 4.45 TBps (terabytes per second), a performance milestone that makes the network roughly 4,450 times faster than a standard home internet connection and significantly expands bandwidth capacity for integrated blockchains.

QDespite the overall market being bullish, what is the concerning trend among Binance's top traders (whales)?

AData shows a steady increase in bearish positioning among whales, with their taker sell orders outweighing buys. Their positioning ratio stands at 0.73, well below the neutral threshold of 1, indicating they are increasingly skewed bearish.

QWhat does a positive Funding Rate of 0.0047% indicate for the 2Z market?

AA positive Funding Rate of 0.0047% signals that bullish participants (long traders) are willing to pay a premium to maintain their positions, adding confidence to the broader outlook among retail and mid-sized traders.

QWhat is the main downside risk for 2Z's price mentioned in the article, according to the liquidation heatmap?

AThe liquidation heatmap points to potential downside risk as several liquidation clusters have formed below the current price level. These clusters often act as magnets, pulling the price down toward these zones of concentrated liquidity if bullish momentum weakens.

Leituras Relacionadas

Bitcoin's 'Rally Ends,' Officially Entering the Later Stage of a Bear Market?

Bitcoin prices declined 13% this week, reversing the recent rebound and signaling a likely transition into the later stages of a bear market. Key on-chain metrics deteriorated, with the short-term holder cost basis falling below the Realized Price—a pattern last seen in early 2022, characteristic of bear market maturity. The rally to ~$82k proved to be a bear market bounce, as evidenced by the 90-day realized profit/loss ratio failing to sustain above the bullish threshold of 2. Daily realized losses surged to $1.35B, including significant selling from long-term holders who accumulated near cycle tops, indicating ongoing supply redistribution. Price was rejected almost precisely at the aggregate US spot ETF cost basis of ~$83k, turning that level into resistance and leaving the average ETF investor underwater again. Spot market selling pressure intensified, with the 7-day volume delta turning significantly negative to its weakest level since February. While a major long liquidation event cleared over $400M in leverage, spot demand has not yet stepped in to absorb the resulting supply. Options markets continue pricing in higher future volatility (elevated volatility risk premium) and maintain a skew toward put options, reflecting persistent demand for downside protection, though not yet panic. Overall, market structure remains fragile. Sustained recovery likely requires a reclaim of the ETF cost basis, a shift back to positive spot demand, and a slowdown in realized loss-taking. Until then, the market risks further downside or extended consolidation within the broader bear trend.

Foresight NewsHá 40m

Bitcoin's 'Rally Ends,' Officially Entering the Later Stage of a Bear Market?

Foresight NewsHá 40m

How Risky is the "Death Spiral" of MSTR and STRC?

Summary: This article explores the perceived "death spiral" risk between MicroStrategy (MSTR), its Bitcoin holdings, and its perpetual preferred stock (STRC), drawing comparisons to the LUNA-UST collapse. While both systems feature price anchors, high yields for holders, and potential feedback loops, their core mechanisms differ fundamentally. The MSTR-STRC structure relies on continuous financing to sustain its high dividend payouts, primarily through stock ATM offerings. A negative feedback cycle could occur: falling MSTR stock price makes raising equity capital harder, increasing pressure to sell Bitcoin, which undermines STRC confidence and further depresses MSTR. However, unlike LUNA-UST's automated, direct linkage, the MSTR-STRC loop is weaker and has brakes: STRC dividends can be deferred or rates lowered, and STRC holders have a $100/share liquidation preference in bankruptcy, providing a price floor. The company's sustainability hinges on its ability to continue financing. Its current ~$900 million USD reserves cover only about 6.3 months of its ~$1.71 billion annual interest/dividend burden. The next six months are critical, aligning with both the potential bottom in Bitcoin's four-year cycle and the depletion timeline of its reserves. While a LUNA-style catastrophic collapse is deemed highly unlikely due to structural differences, the key question is whether MicroStrategy can navigate this period through healthy deleveraging to restart its capital engine.

Foresight NewsHá 58m

How Risky is the "Death Spiral" of MSTR and STRC?

Foresight NewsHá 58m

How Much Debt Does Strategy Really Have? Is There a Risk of Implosion?

MicroStrategy's Debt Risk: A Turning Point in the "Never Sell" Strategy As of June 3, 2026, MicroStrategy holds 843,706 bitcoins (valued at ~$53.1B) but faces significant financial obligations. Its capital structure includes $6.75B in convertible notes and $15.48B in perpetual preferred stock (led by the $8.5B STRC series), creating an annual payout burden of ~$1.71B. With software revenue at only ~$500M, interest and dividend obligations far exceed operating income. A critical shift occurred in late May 2026 when the company sold 32 bitcoins for ~$2.5M to cover dividends, breaking CEO Michael Saylor's long-standing "never sell" pledge. This symbolic move triggered a sharp decline in both Bitcoin's price and MSTR stock, reflecting market fears about cash flow sustainability. The core of the strain is the STRC perpetual preferred stock, designed as a "permanent loan" with no maturity date but requiring high monthly dividends (currently 11.5%). Its business model relies on a three-part cycle: issuing new STRC shares, using proceeds to buy more Bitcoin and fund a USD reserve, and using that reserve to pay dividends. This cycle depends on continuous investor demand for STRC and Bitcoin's price appreciation. Analysis shows Bitcoin needs to appreciate at least 2.3% annually to cover the $1.71B in yearly obligations at current holdings. With Bitcoin price down ~22% from March 2026 highs, this pressure has intensified. The company's $900M USD reserve can only cover about 7 months of payments if STRC issuance stalls. Key risks are not immediate bankruptcy or forced Bitcoin liquidation (as BTC is not collateral), but rather: 1) The erosion of MSTR's premium to its Bitcoin holdings (mNAV), which would cripple its ability to raise cheap capital; 2) A vicious cycle where stagnant Bitcoin prices reduce STRC demand, draining the USD reserve and forcing BTC sales, further depressing prices. The period from February 2027 to September 2028 is a crucial test, with over $5.9B in convertible notes facing put options or maturity. In essence, MicroStrategy has evolved from a simple Bitcoin holder into a complex financial entity acting like a "private Bitcoin bank," leveraging its BTC holdings to create layered financial products. Its survival depends on maintaining Bitcoin's price trend, its stock premium, and market appetite for its preferred shares. The recent token sale marks not a betrayal of its Bitcoin thesis, but an admission that the leveraged strategy must eventually be paid for.

marsbitHá 1h

How Much Debt Does Strategy Really Have? Is There a Risk of Implosion?

marsbitHá 1h

Trading

Spot
Futuros
活动图片