Crypto saw capital exit in Q1 – Can $10B stablecoin surge drive Q2 rebound?

ambcryptoPublicado em 2026-04-07Última atualização em 2026-04-07

Resumo

The crypto market experienced a significant bearish trend in Q1 2026, marked by a 20.8% drop in total market capitalization and capital outflows, as evidenced by a 1.6% decline in USDT's market cap. However, recent data suggests a potential reversal in Q2. Stablecoin activity has surged, with USDT issuance on Ethereum increasing by nearly 2.6% monthly and Circle minting $3.25 billion USDC on Solana in just one week—the largest weekly issuance of 2026. Ethereum’s stablecoin supply change reached $10.3 billion, the highest among L1 networks. These inflows indicate investors are redeploying capital, possibly due to Ethereum’s relative undervaluation (down 57% from its 2025 peak) and growing institutional involvement in DeFi. This stablecoin momentum may lay the foundation for a Q2 rally.

So far, the 2026 cycle has been a bear market.

Notably, one clear signal is when stablecoin market caps drop alongside crypto prices. In Q1, USDT fell 1.6%, showing that money was leaving crypto instead of sitting on the sidelines like it would in a bull market, where investors hold dry powder for the next risk-on move.

The result? The total crypto market dropped 20.8% over the same period, confirming the bearish trend.

Investors weren’t chasing dips. Instead, they were exiting. TOTAL2 (market cap ex-BTC) fell 19.17%, meaning capital didn’t rotate into altcoins either, which only adds to the bearish picture.

Source: TradingView (USDT)

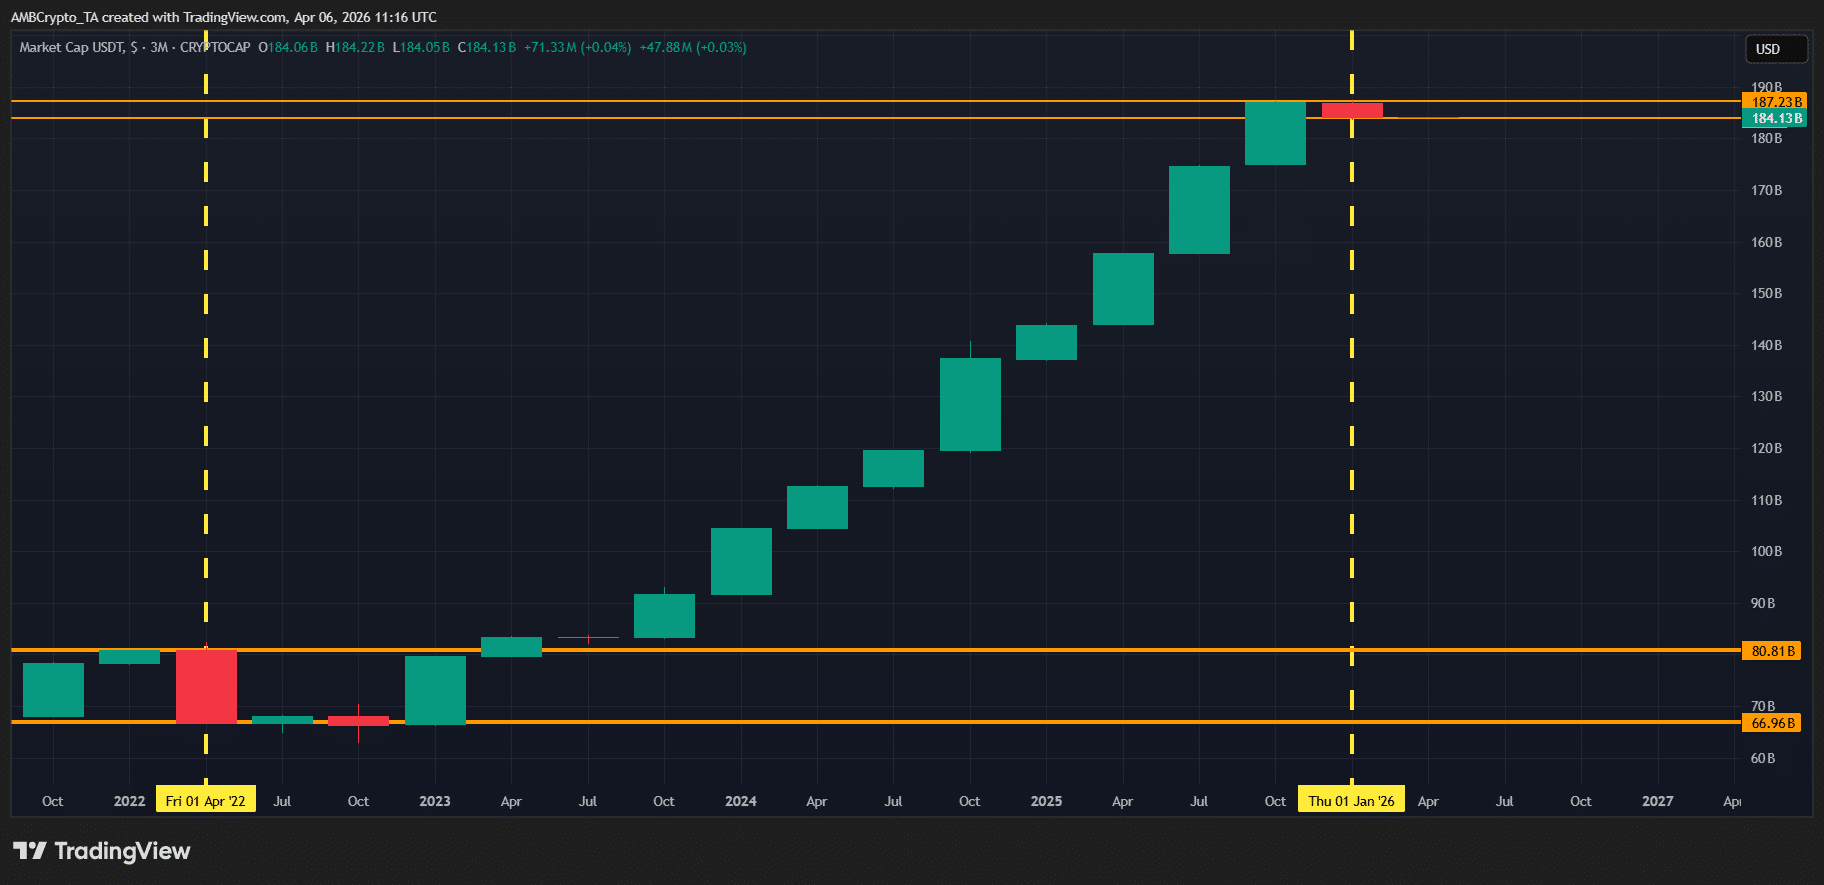
In essence, stablecoins played a central role in defining crypto’s Q1 trend.

According to AMBCrypto, this is where the recent 10x Research report becomes relevant.

It highlights that USDT issuance on Ethereum [ETH] has recently outpaced Tron [TRX], with a near 2.6% monthly jump in volume on ETH. That closes the gap with TRX, which is now just 1% higher, signaling that liquidity is starting to flow into high-cap networks, consistent with the total crypto market cap rising 1.6% so far in April.

From a technical standpoint, this combination of rising market cap and stablecoin inflows is significant.

When stablecoins move back into major networks, it suggests that investors are redeploying capital. This kind of flow often forms a base for price support, and we’re already seeing it in action.

ETH has rallied 1.87% from its $2.1k open, reinforcing that this setup is gaining traction.

Naturally, the question arises: With stablecoins back in play, could this momentum be laying the foundation for a broader Q2 rally, potentially reversing the bearish trend from Q1?

Stablecoin flows hit major networks, market eyes potential rally base

Apart from serving as a hedge or a bridge, stablecoins often act as an early signal for market activity.

A striking example is the recent activity around Solana [SOL].

Circle minted $3.25 billion USDC on Solana in just 7 days, the largest weekly issuance of 2026. This sudden influx of liquidity into the network naturally raises questions about investor intent and market positioning.

But it doesn’t stop there.

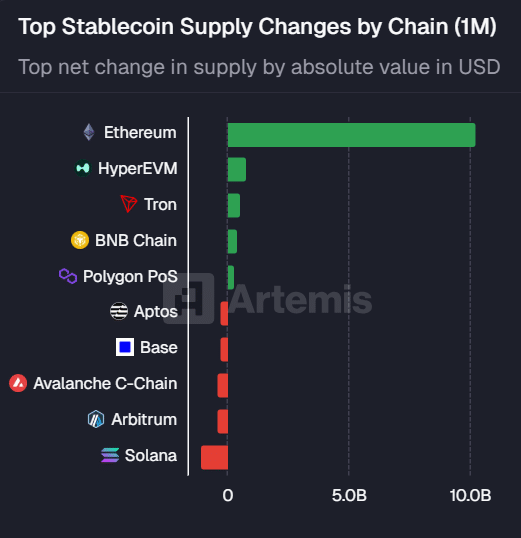
According to Artemis Terminal, monthly stablecoin supply changes on Ethereum have reached a staggering $10.3 billion, the largest among all L1 networks. This “coordinated” increase in stablecoin supply across major networks suggests that investors are actively redeploying capital.

Source: Artemis Terminal

Consequently, the critical question now becomes: Do these issuers have insight into opportunities or risks that the broader market hasn’t priced in yet?

According to the 10x Research report, Ethereum’s relative undervaluation appears to be driving much of this influx.

From a technical standpoint, Ethereum has dropped 57% from its August 2025 peak, making it look relatively cheap, especially when compared to Bitcoin, which is down roughly 42% over the same period.

This is particularly significant given that BTC dominance continues to face resistance around 60%.

Adding to this, Wall Street’s integration into DeFi is gaining momentum, bringing institutional capital to the market.

Taken together, these factors suggest that Ethereum and other high-cap L1s may be positioning for early Q2 momentum, with stablecoin flows acting as a leading indicator of where capital may move next.


Final Summary

  • Rising USDT issuance on ETH and large USDC minting on SOL indicate capital is redeploying.
  • With ETH down 57%, BTC dominance under pressure, and Wall Street entering DeFi, stablecoin inflows may act as a leading indicator for Q2 momentum.

Perguntas relacionadas

QWhat was the overall trend of the crypto market in Q1 2026, and what key metric confirmed this trend?

AThe crypto market was in a bear market in Q1 2026. This trend was confirmed by a 20.8% drop in the total crypto market cap over the period.

QHow did the behavior of stablecoins, specifically USDT, differ in the Q1 bear market compared to a typical bull market?

AIn the Q1 bear market, the stablecoin USDT's market cap fell by 1.6%, indicating that money was leaving the crypto ecosystem. In a bull market, investors typically hold stablecoins as 'dry powder' on the sidelines, waiting to deploy it for the next risk-on move.

QWhat recent development in stablecoin issuance on Ethereum suggests a potential shift in market sentiment?

ARecent data shows that USDT issuance on Ethereum has recently outpaced Tron, with a near 2.6% monthly jump in volume on ETH. This signals that liquidity is starting to flow back into high-cap networks.

QWhat was the significant USDC activity on the Solana network, and why is it notable?

ACircle minted $3.25 billion USDC on Solana in just 7 days, which was the largest weekly issuance of 2026. This massive and sudden influx of liquidity raises questions about investor intent and is a significant signal of market activity.

QAccording to the article, what are the three main factors suggesting Ethereum may be positioning for early Q2 momentum?

AThe three factors are: 1) Ethereum's relative undervaluation, being down 57% from its peak. 2) Bitcoin dominance facing resistance around 60%. 3) Wall Street's integration into DeFi, which is bringing institutional capital to the market.

Leituras Relacionadas

The Cost of an 11.5% Annualized Return: Will MicroStrategy's STRC Face a Moment of Reckoning?

This article analyzes the potential risks associated with MicroStrategy's (MSTR) use of structured financial products like STRC to leverage its BTC exposure. While these tools have enabled impressive returns (e.g., 11.5% annualized) and fueled significant capital inflows ($13.5B outstanding), they also create substantial annual dividend obligations (~$400M). The author argues that this structure, while effective in a bull market, could become a liability if BTC price stagnates or declines. The core risk is a potential negative feedback loop: the growing dividend burden from continued STRC issuance may eventually outweigh the benefits of increased BTC holdings. To meet these obligations, MicroStrategy might need to use new issuance proceeds for dividends instead of buying more BTC, which could disappoint equity investors. If the market capitalization (mNAV) falls below the value of its BTC holdings, the company could be forced to sell BTC instead of issuing new shares, potentially triggering a panic. The author estimates a potential inflection point in 6 months, where annual dividend costs reach $3-4B. At that stage, CEO Michael Saylor might face a difficult choice: sell BTC to meet obligations or sacrifice the credibility of the preferred shares by halting dividends. The article concludes that this financial engineering, while powerful, could ultimately "backfire" on MicroStrategy if market conditions turn.

marsbitHá 32m

The Cost of an 11.5% Annualized Return: Will MicroStrategy's STRC Face a Moment of Reckoning?

marsbitHá 32m

Trading

Spot
Futuros
活动图片