Consumer Confidence Hits Bottom, Macro Correlations Simultaneously Break Down: How Much Longer Can the U.S. Stock Market's Solo Rally Last?

marsbitPublicado em 2026-05-28Última atualização em 2026-05-28

Resumo

The U.S. stock market is exhibiting a rare divergence: while consumer confidence hits historic lows and traditional macro asset correlations break down, major indices like the Nasdaq 100 and S&P 500 continue reaching record highs, fueled primarily by AI and semiconductor momentum. The rally is now highly concentrated, with strength rotating from giants like Nvidia to higher-beta plays within semiconductors, particularly memory chips. This surge occurs despite a significant split between pessimistic consumer sentiment and still-resilient actual spending behavior, partially supported by fiscal stimulus. Goldman Sachs traders highlight a critical structural fissure: correlations between the S&P 500 and key macro assets (rates, gold, VIX, oil) have deviated extremely from long-term historical norms. Concurrently, the market is in a negative Gamma regime, making it more sensitive to price moves, and hedge fund positioning in momentum and semiconductors is at crowded levels. The sustainability of this "solo rally" faces three main constraints: 1) Oil price volatility linked to Middle East geopolitical risks, 2) Extreme crowding in semiconductor and momentum trades, increasing vulnerability to disappointments, and 3) The breakdown of traditional macro correlations, suggesting the rally reflects a specific mix of factors rather than broad-based risk appetite. The key question is not if indices can rise further, but which variable—oil, rates, or semiconductor momentum—might trigger ...

Author: Li Jia

Source: Wall Street News

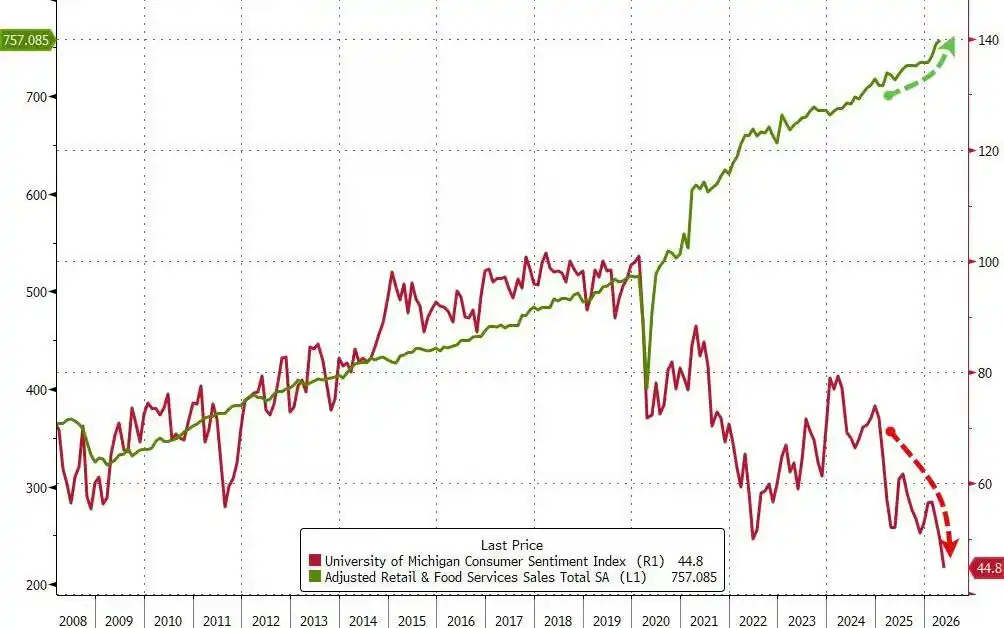
The U.S. stock market is currently displaying a rare split: on one side, consumer confidence has fallen to historic lows and correlations between macro assets have become completely distorted; on the other side, major stock indices continue to set new all-time highs driven by the AI and semiconductor rally. What the market is truly worried about is no longer whether the uptrend can continue, but how long this highly concentrated AI-driven rally can withstand the shocks from oil prices, interest rates, and crowded positioning.

Spurred by rising expectations for U.S.-Iran talks and a surge in the semiconductor sector, U.S. stocks hit new record highs again on Tuesday. The Nasdaq 100 Index surpassed 30,000 points for the first time, and the S&P 500 rose about 0.5%; meanwhile, a decline in oil prices led to lower U.S. Treasury yields, while a rebound in the dollar pressured the performance of gold and Bitcoin.

Semiconductors remain the core driver of this rally. After UBS Group significantly raised its target price for Micron Technology, trading sentiment for memory chips heated up rapidly, with the semiconductor sector rising 14% over the past five days. However, Nvidia has begun to underperform the overall semiconductor index, indicating that funds are shifting from the leader towards sectors with higher elasticity.

Nelson Armbrust, a Goldman Sachs trader, warned that the current correlations between the S&P 500 and interest rates, gold, the VIX, and oil prices have all deviated from their 20-year historical averages and entered extreme ranges. "One side of the market has to give," he said. "The stock indices are not reflecting the full reality of the market."
AI Theme Remains, But Driving Forces Rotate

The strongest driving force in the stock market currently comes from semiconductors, especially the memory chip segment. Goldman Sachs trader Pete Callahan pointed out that the semiconductor index has outperformed Nvidia by about 16.5 percentage points over the past five trading days, marking the largest five-day advantage for the SOX relative to Nvidia since 2018.

Notably, this rally is not being driven by a broad-based surge in mega-cap tech stocks. Large-cap tech stocks overall showed relative weakness, with Nvidia slightly lagging, indicating funds are rotating from the AI leader towards more elastic trading plays within the semiconductor sector. Memory chip-related stocks opened sharply higher, with DRAM ETF nominal trading volume reaching about $30 billion for the day, and Goldman Sachs' Meme-Stocks basket also rose noticeably.

AI remains the market's main theme. AI semiconductors, Agentic AI, and AI data center stocks led the market gains. Goldman Sachs noted that the strength in the momentum factor that day was almost entirely driven by long positions, with the best-performing stocks over the past 12 months continuing to significantly outperform.

Meanwhile, increasingly extreme structural signals are also appearing in the options market. SpotGamma data shows aggressive negative Delta flows in 0-DTE options, primarily driven by selling call options; and the combination of "rising volatility and rising spot prices" persists. This means the current rally is not a typical low-volatility expansion of risk appetite but is increasingly being driven by positioning squeezes and options trading structures.

Consumer Confidence Bottoms, But Behavior and Sentiment Diverge

Goldman Sachs trader Chris Hussey pointed out that many are puzzled: why are U.S. stocks still hitting new record highs when consumer confidence indicators have fallen to historic lows? His explanation is that what consumers "feel" and what they "actually do" are inconsistent. In other words, sentiment is pessimistic, but consumer behavior has not deteriorated in sync.

Meanwhile, fiscal stimulus is still supporting household cash flow. Chris Hussey mentioned that tax relief from the budget bill last July is improving household balance sheets, partially offsetting the pressure from rising gasoline prices.

U.S. macro data also shows clear divergence. The Chicago Fed National Activity Index rebounded sharply, the Conference Board Consumer Confidence Index beat expectations, and the Dallas Fed Manufacturing Index held steady; while the S&P CoreLogic Case-Shiller Home Price Index weakened and the Philadelphia Fed Manufacturing Index missed expectations. Overall, U.S. economic data maintains a state of "slightly stronger than expected."

This also explains the market's current contradiction: consumer sentiment is extremely weak, but economic data has not significantly deteriorated yet, and actual consumer behavior has not shown a synchronous decline. However, the AAII Bull-Bear Spread remains negative, indicating investor sentiment has not truly turned optimistic alongside the new stock market highs.

Macro Correlations Fail, Negative Gamma Intensifies: Goldman Sachs Warns of Structural Cracks in U.S. Stocks

Goldman Sachs trader Nelson Armbrust warned that current U.S. stock indices do not reflect the full reality of the market. Correlations between the S&P 500 and key macro assets have comprehensively deviated from long-term averages: correlation with interest rates is at a decade low, correlation with gold is at a decade high, correlation with the VIX is at a two-year high, and correlation with oil prices is at a decade low.

These are extremely rare levels even when viewed across a 20-year historical dimension. In other words, while U.S. stocks are still rising, their traditional联动 relationships with interest rates, volatility, commodities, and safe-haven assets are breaking down. For investors relying on historical correlations for asset allocation, hedging, and risk budgeting, this means model stability is declining.

Meanwhile, Gamma has turned negative. In a negative Gamma environment, the market becomes more sensitive to price fluctuations, and the state of "spot prices rising while volatility simultaneously increases" also means the current market action is not a typical low-volatility one-sided bull market, but increasingly driven by positioning and options structures.

Goldman Sachs HF Trend Monitor data shows hedge funds' current allocation to the momentum factor has risen to the 90th percentile, semiconductor positioning has reached a record 10%, while software positioning has fallen to its lowest since 2019. Highly crowded positioning implies that the rally may still continue upward in the short term driven by chasing funds, but once a reversal occurs, the pullback could also be more severe.

How Far Can U.S. Stocks Go? It Depends on Three Constraints

The first constraint comes from oil prices. Diplomatic progress can quickly depress geopolitical risk premiums, but cannot immediately repair the buffer capacity of shipping, insurance, refineries, and real supply chains. As long as uncertainty remains around the Strait of Hormuz situation and the prospects for a U.S.-Iran ceasefire, oil prices may fluctuate repeatedly between optimistic expectations and tail risks.

The second constraint comes from semiconductor positioning. The current U.S. stock rally relies increasingly on AI and semiconductors, especially memory chips and momentum long trades. If funds continue chasing this direction, indices may maintain strength; but the more crowded the positioning, the higher the market's sensitivity to earnings, guidance, or fund flow changes—any slight disappointment could be rapidly amplified.

The third constraint comes from correlation breakdowns. The simultaneous deviation of the S&P 500's relationship with interest rates, gold, the VIX, and oil prices from long-term averages means the current rally does not equate to a comprehensive easing of macro risks. More accurately, it is the result of a combination of declining geopolitical risk premiums, falling U.S. Treasury yields, AI/semiconductor momentum, and positioning squeezes.

Therefore, the U.S. stock market's "solo party" may continue, but the stability of the rally is declining. What truly matters is not whether the indices can set new highs, but which variables will force a repricing of this trading logic—whether oil prices will rise again, whether interest rates will re-ascend, whether semiconductor momentum will cool, and when those distorted correlations will revert.


Perguntas relacionadas

QWhat is the main contradiction in the current U.S. stock market as described in the article?

AThe main contradiction is that while consumer confidence is at a historical low and traditional macro correlations have broken down, major stock indices like the Nasdaq 100 and S&P 500 continue to hit record highs, driven primarily by a highly concentrated AI and semiconductor rally.

QWhich sector is identified as the core driving force of the current market rally, and what shift within it is observed?

AThe semiconductor sector is the core driving force. A shift is observed where capital is moving from the AI leader, Nvidia, towards more elastic segments within semiconductors, particularly memory chips, as evidenced by the outperformance of the broader semiconductor index.

QWhat warning does Goldman Sachs trader Nelson Armbrust issue regarding market correlations?

ANelson Armbrust warns that the correlations between the S&P 500 and key macro assets (interest rates, gold, VIX, and oil) have deviated to extreme levels from their 20-year historical averages. This means the market is not reflecting the full reality, and traditional models for asset allocation and hedging are losing stability.

QAccording to the article, what three main constraints could limit the continuation of the U.S. stock market's 'solo celebration'?

AThe three main constraints are: 1) Oil price volatility, influenced by geopolitical risks like the Strait of Hormuz situation and U.S.-Iran negotiations. 2) Overcrowded positioning in the semiconductor sector, making it vulnerable to any negative news. 3) The breakdown of traditional macro correlations, indicating the current rally's foundation is fragile and dependent on a specific mix of factors.

QHow does the article explain the divergence between low consumer confidence and strong stock market performance?

AThe article explains this divergence by highlighting a split between what consumers 'feel' and what they 'actually do.' While sentiment is pessimistic, actual consumer behavior has not deteriorated in sync, partly supported by fiscal stimuli like tax credits, and economic data remains 'slightly stronger than expected.'

Leituras Relacionadas

Must-Watch Events Next Week|CLARITY Act Could Face Senate Vote; SpaceX, Circle to Report Earnings (8.3-8.9)

**Summary: Key Events and Developments to Watch (August 3-9)** The upcoming week is marked by significant financial disclosures, key legislative deadlines, and notable product updates. **Major Financial Events:** Several companies are scheduled to release their Q2 2026 earnings. American Bitcoin (ABTC) will report on August 3, followed by SpaceX and Hut 8 Mining Corp. on August 4, and Circle on August 5. Notably, a significant portion of SpaceX shares (up to 12% of total shares) will be unlocked on August 6 following their earnings release. **Key Legislative Deadline:** The U.S. Senate faces an August 7 deadline to secure 60 votes for the CLARITY Act, a bipartisan bill aiming to establish a federal regulatory framework for cryptocurrencies. The Senate may hold a full vote on the bill during the week. **Economic Data:** The U.S. July Non-Farm Payrolls report will be released on August 7, providing crucial labor market data. **Technology & Product Updates:** * **Shutdowns:** DeFi portfolio tracker Zapper and wallet app Ctrl Wallet will cease operations on August 3. * **Upgrades:** LayerZero will deprecate its v1 relayers on August 3. XRP Ledger's new version 3.3.0, featuring five new functions, is expected next week. * **AI:** Elon Musk announced that the advanced Grok 4.6 AI model is set for release around August 7. * **Bitcoin:** The BIP-110 forced signaling for a potential Bitcoin network change is scheduled to begin around August 8. **Other Notable Events:** Chinese robotics firm Unitree Tech has set its preliminary price inquiry for its IPO for August 5. South Korean exchange Upbit will delist AQT and AERGO tokens on August 3.

marsbitHá 2h

Must-Watch Events Next Week|CLARITY Act Could Face Senate Vote; SpaceX, Circle to Report Earnings (8.3-8.9)

marsbitHá 2h

Stocks Are Plummeting More Sharply Than Cryptocurrencies. Where Has the Money Gone?

Stock Markets Plunge Deeper Than Cryptocurrencies: Where Did the Money Go? In late July, Seoul's Kospi index triggered circuit breakers for two consecutive days, plummeting over 40% from its June high. The collapse was led by heavyweight stocks like SK Hynix, whose record profits still disappointed investors, and devastating leveraged ETFs, with one major product losing over 83% of its value. This signaled a global, forced deleveraging targeting the most crowded trades. Interestingly, while stocks exhibited extreme volatility akin to crypto markets, Bitcoin rose nearly 15% in July after a prior steep drop. Analysis shows the money fleeing equities did not flow into Bitcoin. Instead, Bitcoin had already absorbed its sell-off in May-June, when U.S. spot Bitcoin ETFs saw historic outflows. The true safe-haven beneficiary was gold, whose price rose over 20% year-on-year, highlighting a decoupling between Bitcoin and gold as "digital gold." The sell-off was a targeted unwinding of leveraged positions in tech and semiconductors, accelerated by broker-dealer risk management and shifts in the AI narrative, including new competition from Chinese memory chipmakers. The retreat path was clear: from high-valuation tech stocks to cash and U.S. Treasuries, then to gold. For Bitcoin to attract sustained institutional inflows, conditions like eased global liquidity pressure, a "soft-landing" Fed rate cut, and U.S. regulatory clarity via legislation like the stalled CLARITY Act are needed. Currently, Bitcoin is not a safe haven but an already-cleared asset. Its low correlation with tech stocks, however, makes it a potential diversification play for institutional portfolios once the storm passes. The money isn't here yet, but the positioning is underway.

marsbitHá 2h

Stocks Are Plummeting More Sharply Than Cryptocurrencies. Where Has the Money Gone?

marsbitHá 2h

In Conversation with Ray Dalio: We Are Currently in an AI Bubble, with 1% of My Portfolio in Bitcoin

Ray Dalio, founder of Bridgewater Associates, warns in an interview that the current AI boom shows classic bubble characteristics, which could lead to significant economic downturns as seen in past cycles like 1929 or 2000. He explains that speculative enthusiasm, fueled by debt and overvaluation, often precedes a crash when rising rates or taxation force asset sales, causing widespread losses and recession. Dalio also outlines his "Big Cycle" theory, describing an approximate 80-year pattern where widening wealth gaps, massive government deficits, and shifting geopolitical power (like China's rise) create internal conflict and global instability. He emphasizes that we are in a late-cycle, transitional phase where traditional powers like the US and UK face decline. For personal wealth protection, Dalio advises diversification beyond cash into assets like stocks, bonds, real estate, and particularly gold, which he prefers over Bitcoin. While he holds about 1% of his portfolio in Bitcoin as a non-printable hard asset, he views gold as more secure from technological or governmental threats. Regarding AI's impact, Dalio believes it will disproportionately benefit capital owners, worsening inequality by replacing both physical and cognitive labor. He suggests that human intuition and emotional intelligence, combined with AI, will be key for future workers. On taxation, Dalio argues that wealth taxes are impractical and risk triggering asset sell-offs, reducing productive investment. He points to the UK as a cautionary example of debt, low productivity, and political strife. Geopolitically, Dalio foresees a more regionalized world, with the US showing weakness in prolonged conflicts like with Iran, akin to past imperial declines. The ideal outcome, he suggests, is coexisting powerful blocs (e.g., Americas, China-Asia Pacific) without major war.

marsbitHá 5h

In Conversation with Ray Dalio: We Are Currently in an AI Bubble, with 1% of My Portfolio in Bitcoin

marsbitHá 5h

Trading

Spot
活动图片