Authors: Glassnode, Coinbase Institutional
Compiled by: Jiahuan, ChainCatcher
Outlook: Recovery Is Here, Maintain a Positive View for Q4
We hold a positive view on the outlook for the crypto market in Q4 2026. Despite the Federal Reserve re-tightening policy, Bitcoin still rose 43% in Q3 to $83,600. This shows that the market shift toward accumulation we described last quarter has developed into an initial recovery.
The bigger variable is the policy shift toward tightening. In September, the Federal Reserve raised rates by 25 basis points, lifting the target range to 3.75% to 4.00%, the first hike since July 2023, even though core CPI had fallen to 2.4%. The 10-year U.S. Treasury yield rose 85 basis points during the quarter to 5.29%, the highest since 2002. The market currently expects about 64 basis points of further rate hikes over the next six months. Even so, Bitcoin still outperformed gold and several stock markets, indicating that new demand was driven by multiple factors, not just the liquidity factor that dominated the first half of the year.
On-chain conditions have improved markedly. Entity-adjusted NUPL rose from 0.11 to 0.38, pushing Bitcoin back into the "optimism/anxiety" zone. The share of supply in profit rose from 46% to 71%, moving back above the lower boundary of the statistical range. Supply that has not moved for more than one year still increased by about 340,000 BTC, indicating that long-term holders largely continued to hold through this rally. MVRV was 1.56, and realized price was about $53,600, indicating that valuations have returned to normal but are not yet close to levels seen at previous cycle tops.
Caution is still warranted. This rally brought more coins back into circulation, with supply that moved within the past three months increasing 16% to 2.8 million BTC. Long-term holders turned to slight net selling in August. About 1.7 million BTC last changed hands at prices between $89,600 and $93,700, forming a dense supply zone just above the current price.
The long-term factors supporting the market are still expanding. This quarter, ETH outperformed Bitcoin by about 20%, Ethereum DeFi total value locked (TVL) rose from $37 billion to $53 billion, and U.S. spot Bitcoin ETFs saw $7 billion in net inflows. These changes indicate that the foundation of institutional and on-chain demand is broadening, although short-term price action remains more sensitive to real yields and positioning conditions than to long-term adoption trends.
To help investors navigate this environment, we are pleased to provide the latest market data and on-chain analysis to help investors better understand the trends currently shaping the market and how these trends may affect the crypto economy in the future. We hope this article can help you participate in the crypto market, and we welcome your feedback and questions.
Crypto Market View
Our Overall Market View
We are bullish on Q4 2026.
We hold a positive view on the outlook for the crypto market in Q4 2026, because even with tighter policy, Bitcoin has moved from a bottoming phase into an initial recovery.
- Bitcoin rose 43% in Q3 2026, outperforming gold and stocks, despite Federal Reserve rate hikes and the 10-year U.S. Treasury yield rising to 5.29%.
- U.S. spot Bitcoin ETFs saw $7 billion in net inflows in Q3 2026, reversing outflows from the first half and pushing assets under management up to $127 billion.
- Although short-term signals suggest caution and there is an overhead supply zone around $90,000 to $94,000, we still view a pullback toward the 200-day moving average as an accumulation opportunity.
What Would Change Our View
What would make us more optimistic:
If the Federal Reserve pauses rate hikes after the September increase and the three-month annualized gain in core PCE remains at 2.1%, it would help ease pressure from real yields. A clear Bitcoin breakout above the $90,000 to $94,000 supply zone, continued ETF inflows, and continued coin outflows from exchanges would all strengthen our confidence in a sustained uptrend.
What would make us more concerned:
If the 10-year U.S. Treasury yield rises further toward 5.5%, or oil prices remain around $90 and keep headline inflation elevated, the market may begin to price in more rate hikes and financial conditions would tighten accordingly. If price stalls in the overhead supply zone and then falls below the 200-day moving average (currently around $71,000), while ETFs see renewed sustained outflows, it would indicate that the market recovery needs more time.
Market Overview
Total Crypto Market Capitalization
In Q3 2026, total crypto market capitalization (excluding stablecoins) rose about 48% to $2.55 trillion. More than half of the increase occurred in the week of August 17, when Bitcoin rose 24%. Stablecoin supply remained basically unchanged at $311 billion, still below the record $321 billion set in May. As a result, stablecoins' share of market capitalization fell from about 15% to 11%. This reflects rising crypto asset prices, not a contraction in stablecoin supply.
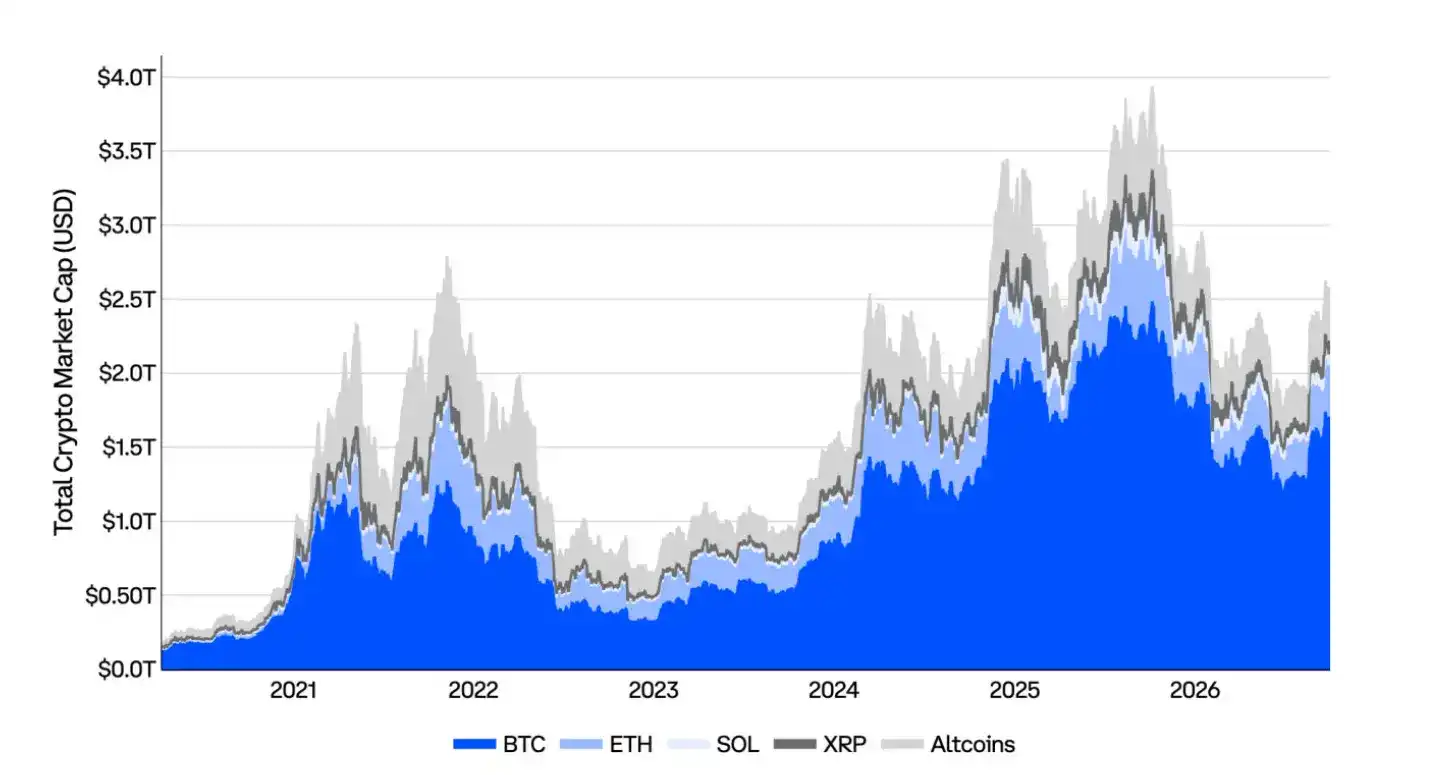
Chart: Total crypto market capitalization
BTC Price Performance Since Cycle Low
Bitcoin has already gone through four complete cycles, each including a bull market and a bear market (the chart does not show the cycle from genesis to 2011). The current cycle began in 2022, and its first two years were highly similar to the 2015 to 2018 cycle, but it began to diverge in Q1 2025 because some market participants, mainly long-term holders, reduced risk exposure.
The current cycle has lasted more than 46 months, and the top appears to have formed in October 2025, when the price was 7.9 times the cycle low. In Q3 2026, Bitcoin recovered from 3.8 times the cycle low to 5.4 times, suggesting that the post-top low may have already occurred, but it is not yet clear whether these historical patterns still apply.
Past performance does not guarantee future results.
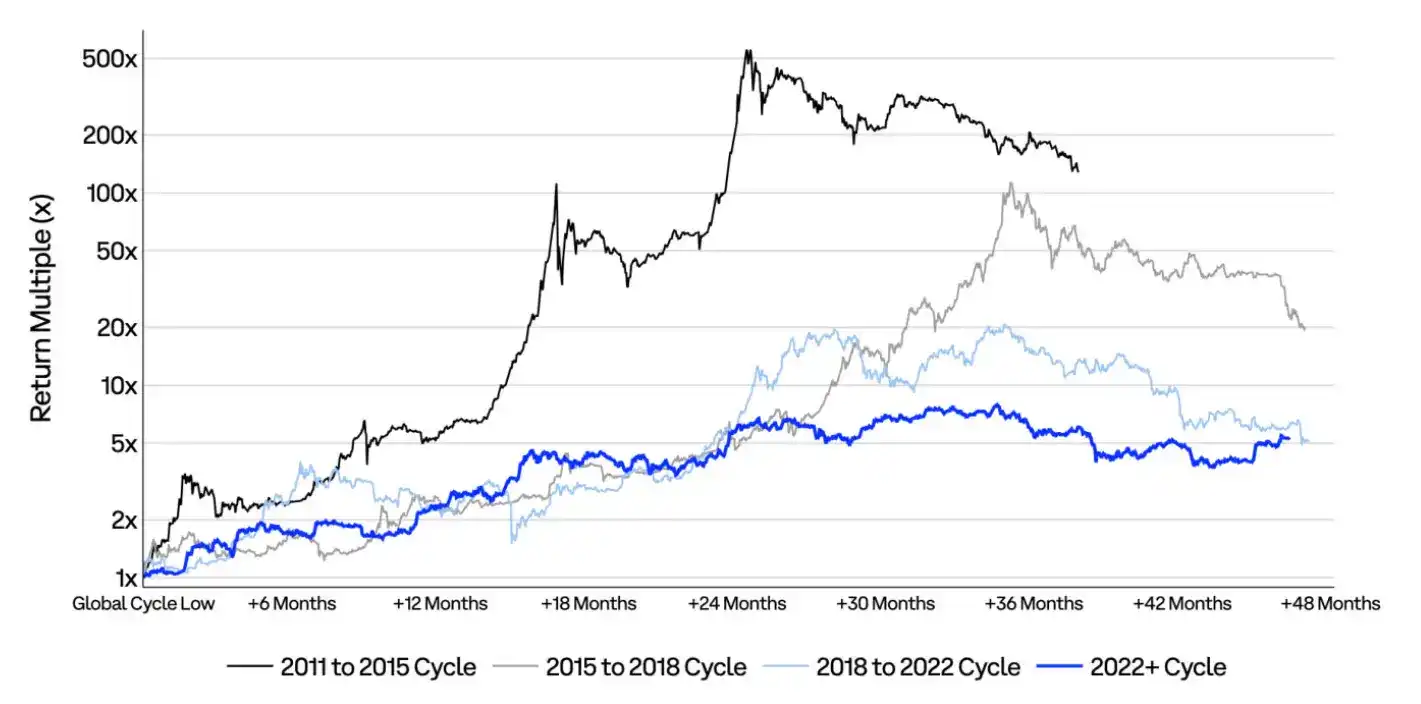
Chart: Comparing Bitcoin's price multiples and duration since cycle lows across different cycles.
ETH Price Performance Since Cycle Low
Ether has gone through at least two complete cycles, each including a bull market and a bear market. The current market cycle formally began in 2022, and its first two years tracked the 2018 to 2022 cycle, but it has since diverged significantly from the previous cycle.
The current cycle has lasted more than 46 months. In Q3 2026, Ether recovered from 1.4 times its November 2022 low to 2.4 times, outperforming Bitcoin by about 20%. However, after the rebound, ETH is still far below the 4.4 times level of this cycle's high and is also clearly off the path of the 2018 to 2022 cycle, which had reached 17.3 times the low at the same stage. This divergence is consistent with a maturing market structure: returns increasingly depend on actual utility, regulatory clarity, and real adoption, rather than the speculative surges common in earlier cycles.
Past performance does not guarantee future results.
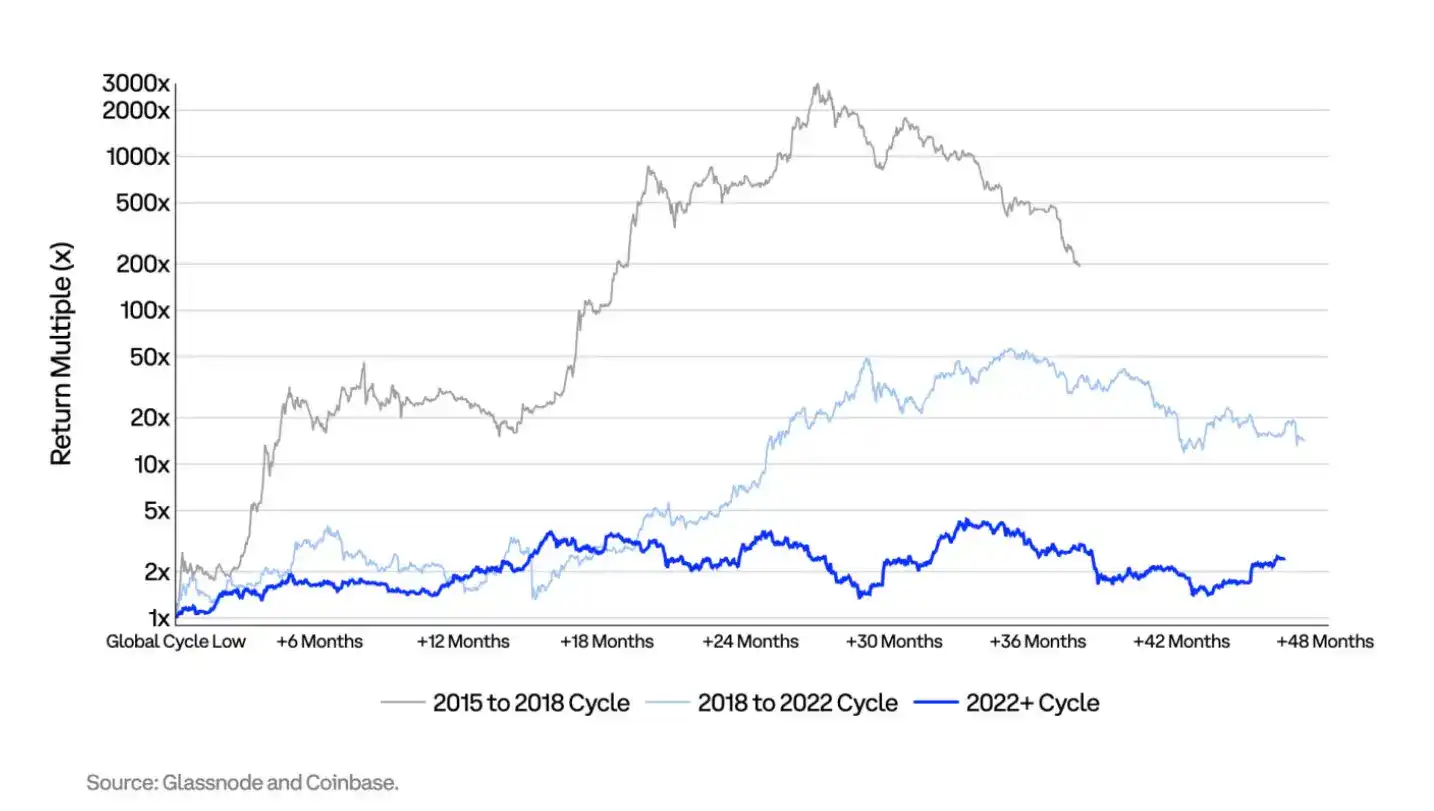
Chart: Comparing Ether's price multiples since cycle lows in the 2015 to 2018, 2018 to 2022, and 2022-starting cycles.
Correlation Matrix
Outside crypto assets, Bitcoin's price action in Q3 2026 was closest to precious metals. Its daily return correlation with gold and silver was 0.61 each, and its correlation with the U.S. dollar index was -0.43. Bitcoin's correlation with U.S. equities was relatively low: 0.30 with the S&P 500 and 0.29 with the Nasdaq; its correlation with 2-year and 10-year U.S. Treasury yields was negative. These relationships suggest that this rally was driven more by demand for alternatives to the dollar than by a broad rebound in risk appetite. This is also consistent with Bitcoin performing strongly relative to U.S. Treasuries when Treasury yields rise.
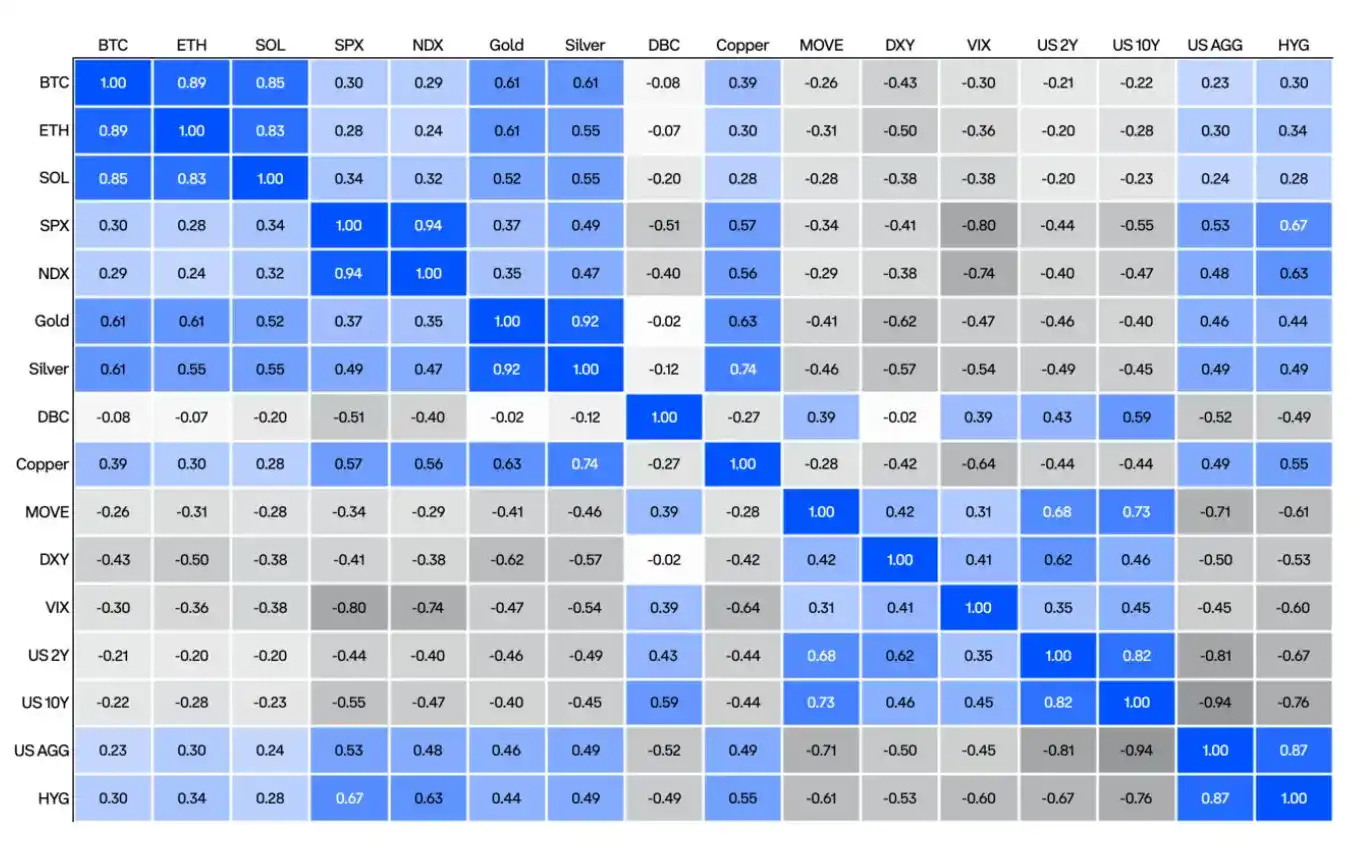
Chart: Return correlation matrix for crypto assets, stocks, precious metals, the dollar, Treasury yields, and other assets and indicators.
Volatility and Rolling Correlation
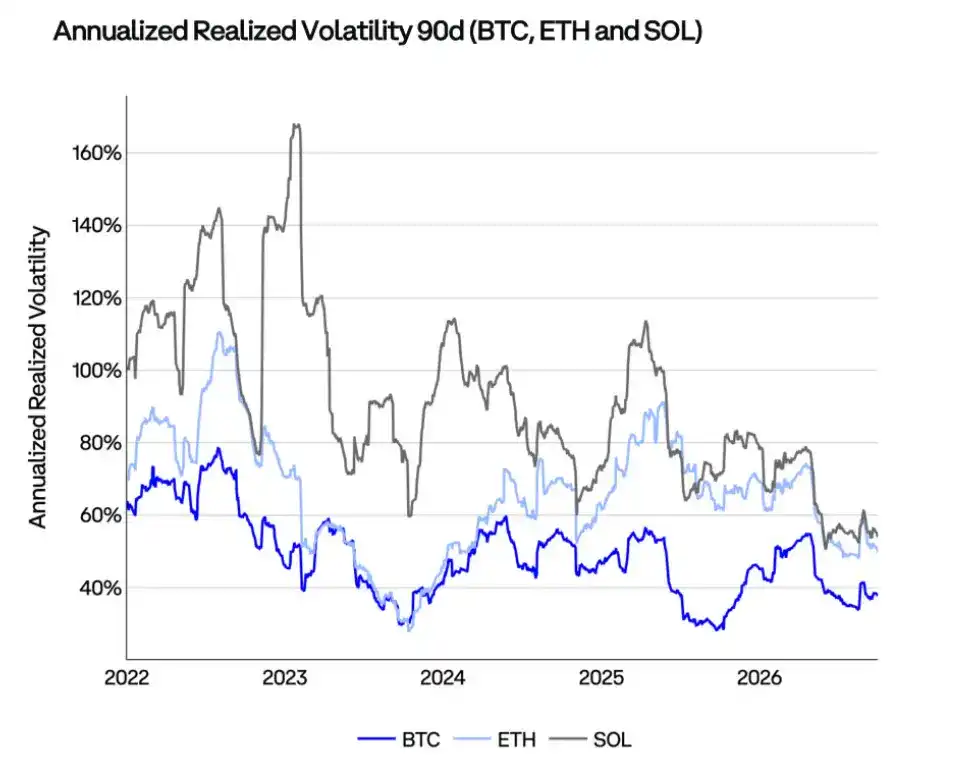
Chart: 90-day annualized realized volatility of BTC, ETH, and SOL, calculated using a three-month rolling window.
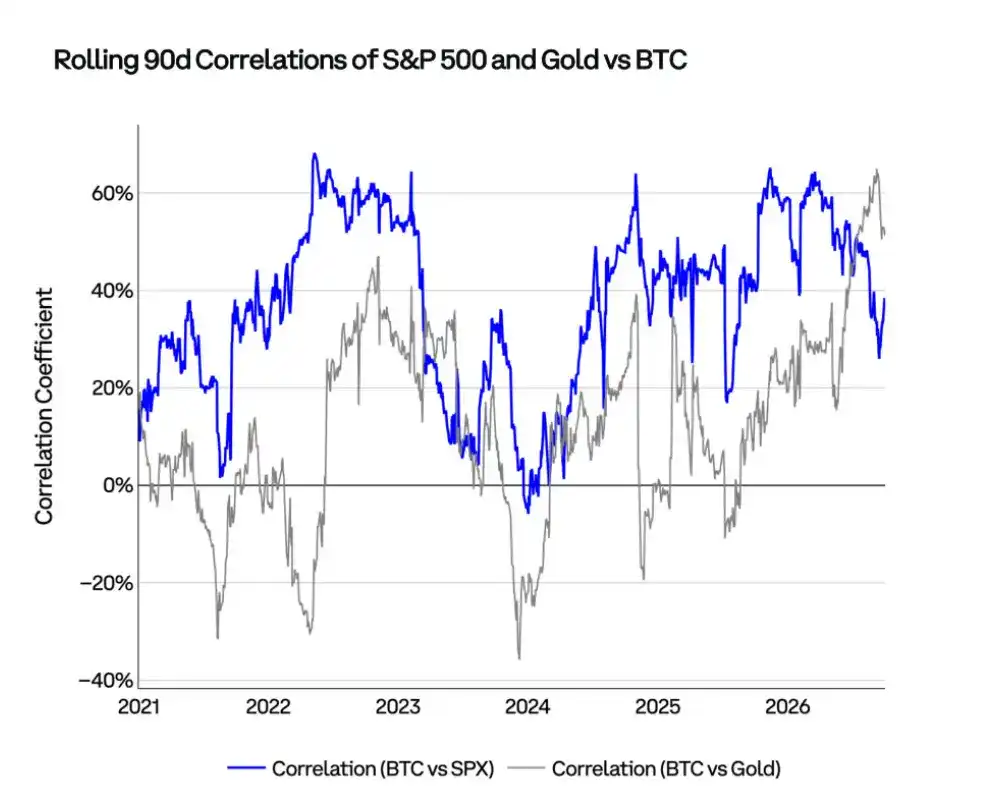
Chart: 90-day rolling correlation of BTC with the S&P 500 and gold, calculated using a three-month rolling window.
Spot ETF Fund Flows,
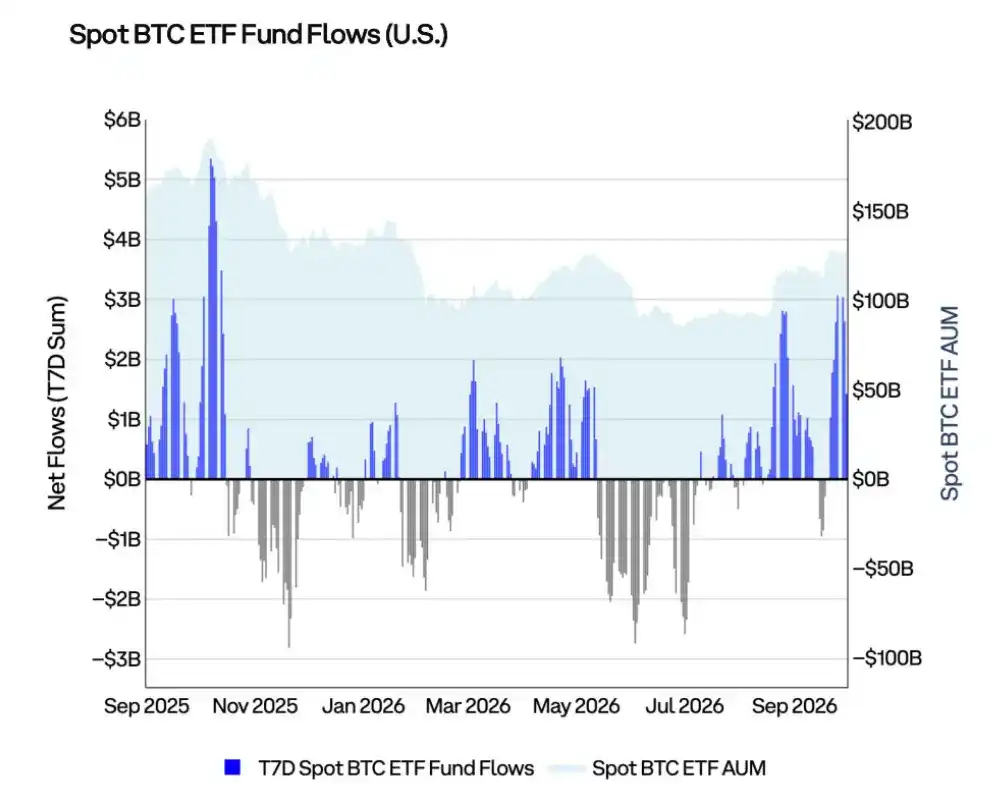
Chart: 7-day cumulative net inflows and assets under management (AUM) of U.S. spot Bitcoin ETFs.
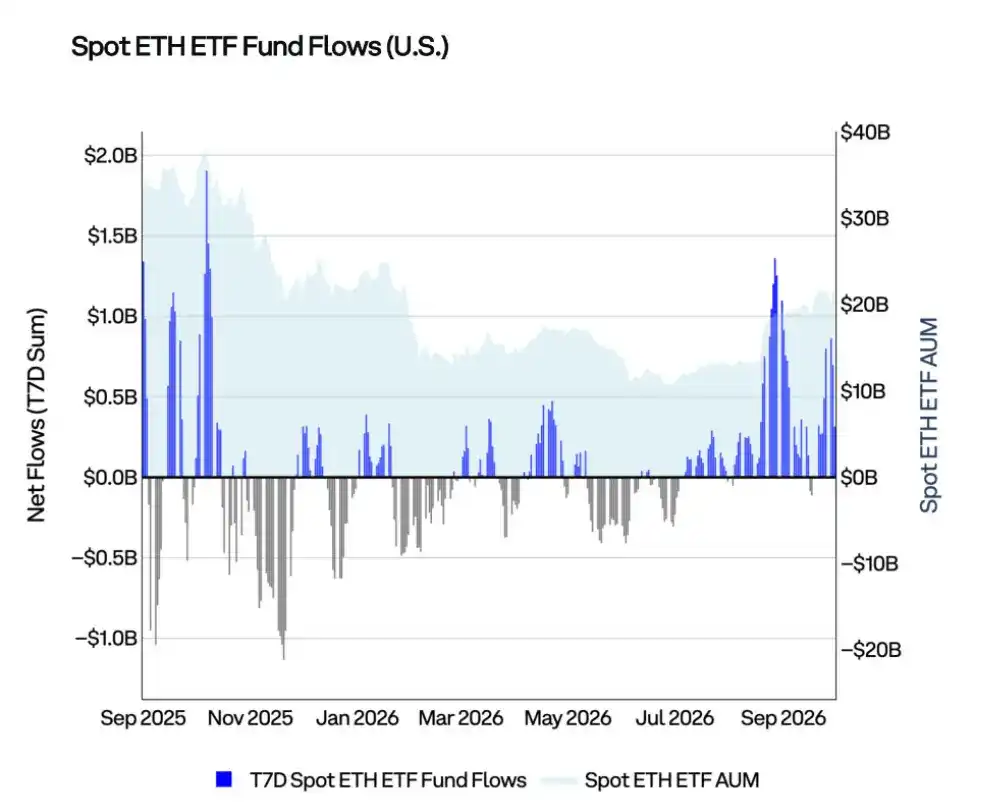
Chart: 7-day cumulative net inflows and assets under management (AUM) of U.S. spot Ether ETFs.
Stablecoins
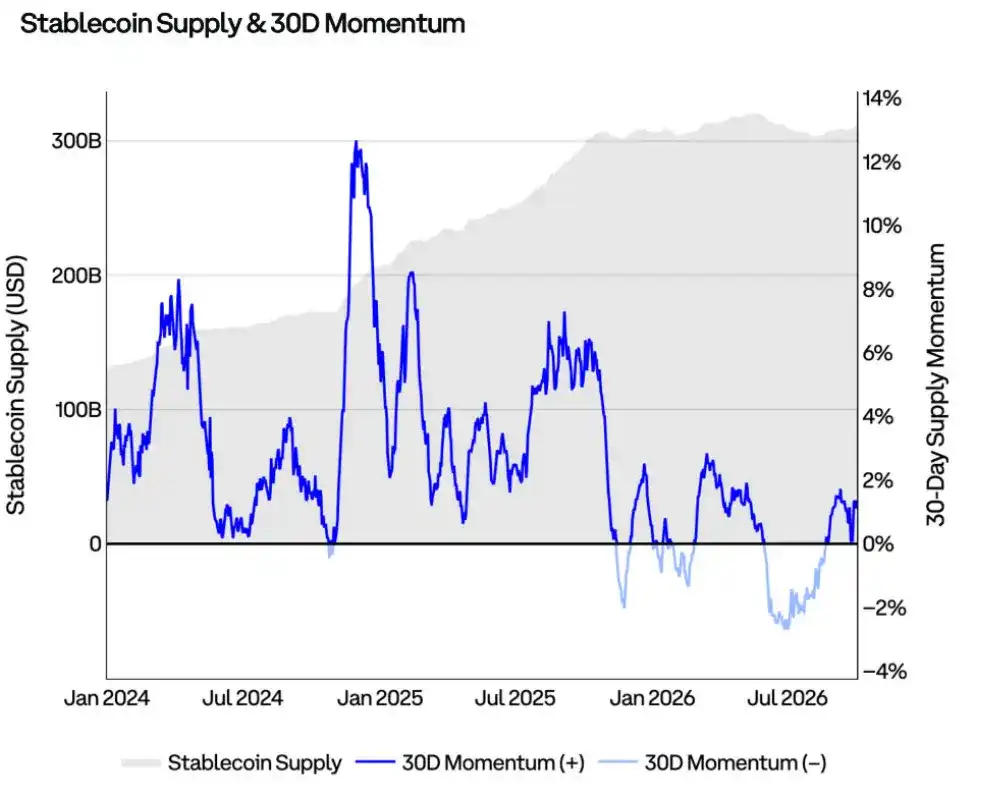
Chart: Total stablecoin supply and its 30-day rate of change, distinguishing positive and negative growth.
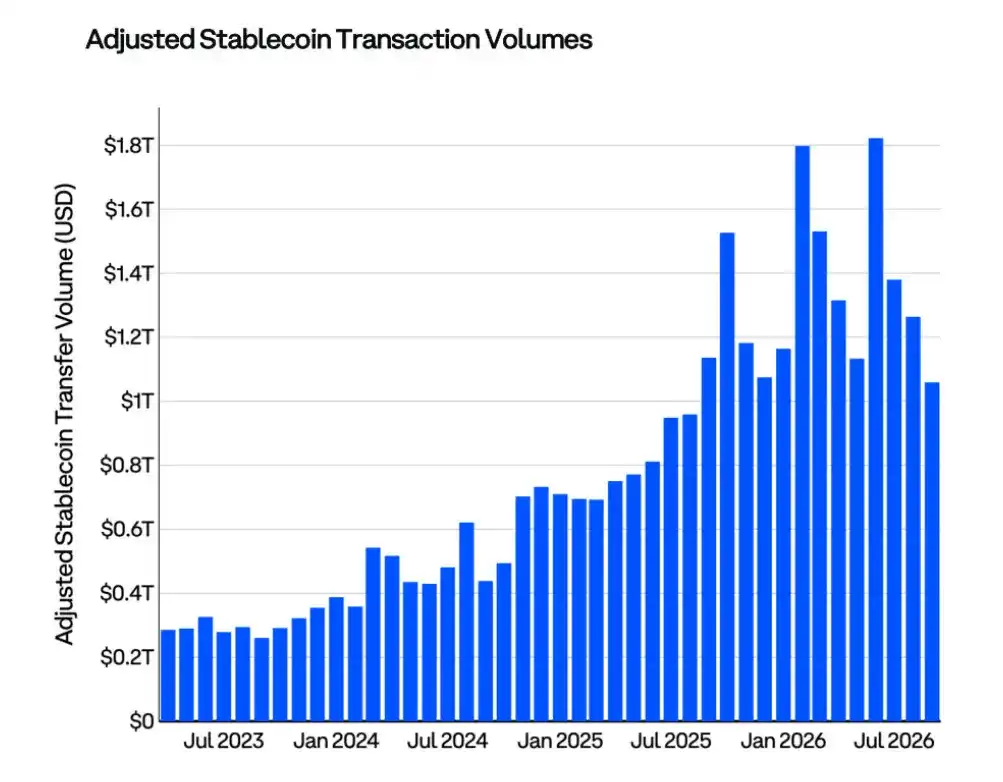
Chart: Adjusted stablecoin transfer volume.
Bitcoin
Bitcoin (BTC) is the world's first widely adopted cryptocurrency. It is important to distinguish between "bitcoin" as a token and the "Bitcoin" network that carries its transactions. The network enables secure, seamless peer-to-peer transactions over the internet through blockchain. The Bitcoin blockchain is a public ledger containing the history of all Bitcoin transactions. BTC is decentralized: two people anywhere in the world can send Bitcoin to each other without going through a bank, government, or other institution.
- Developer: Bitcoin was created by Satoshi Nakamoto. Satoshi Nakamoto is a pseudonym used by an individual or team that described the technology in a 2008 whitepaper.
- Reference price: Bitcoin Reference Rate (BRR), CME CF Benchmark Reference Rate
- Bloomberg ticker: XBT Currency
- Circulating supply: 20.09 million coins
- Share of circulating supply: 95.7%
- Inflation rate: 0.8%
Bitcoin: Key Takeaways
- In Q3 2026, Bitcoin derivatives open interest rose 36% to about $80 billion, driven mainly by options. Meanwhile, the annualized basis on CME futures widened from about 4% to 6%. Open interest rebounded with prices, but remains below the peak of about $114 billion in October 2025.
- Entity-adjusted net unrealized profit/loss (NUPL) shows that BTC market sentiment gradually recovered in Q3 2026. The metric rose from 0.11 to 0.38, moving from the "hope/fear" zone back into the "optimism/anxiety" zone. However, it remains clearly below the 0.48 threshold for the "belief/denial" zone, indicating that sentiment has normalized but is not yet overheated.
- Although Bitcoin rose 43% in Q3 2026, coins that had not moved for more than one year still increased by about 340,000 BTC. At the same time, coins that moved within the past three months increased 16% after touching their lowest level since late 2023 in July. This combination suggests that long-term holders mostly continued to hold during the rally, while newer market participants began to return.
BTC Indicator Map
This map screens 533 sets of on-chain and macroeconomic indicator series and examines their relationship with Bitcoin's subsequent 30-day return. Only indicators that simultaneously meet the following conditions are displayed: they pass significance tests after multiple comparison correction; their current value is sufficiently far from their own median to be testable; and the signal direction is consistent with their historical relationship. Square size indicates the degree of confidence in this relationship, while color and number indicate the implied difference in the next 30-day return relative to the usual level, in percentage points.
As of September 30, 41 of the 533 indicator sets passed the above tests, of which 27 pointed to below-usual returns over the next 30 days. Macro indicators were slightly positive overall: Bitcoin's strength relative to small caps, long-term U.S. Treasuries, and gold was partly offset by its distance from 52-week highs relative to the dollar and emerging markets. On-chain indicators were more clearly weak, with 8 of 9 pointing to below-usual returns after the Q3 rally.
The combination of these signals looks more like a short-term consolidation than a trend reversal. Among on-chain indicators, the biggest drags came from the share of supply in profit, the ratio of open interest to market capitalization, and on-chain transaction volume being weaker on up days than on down days.
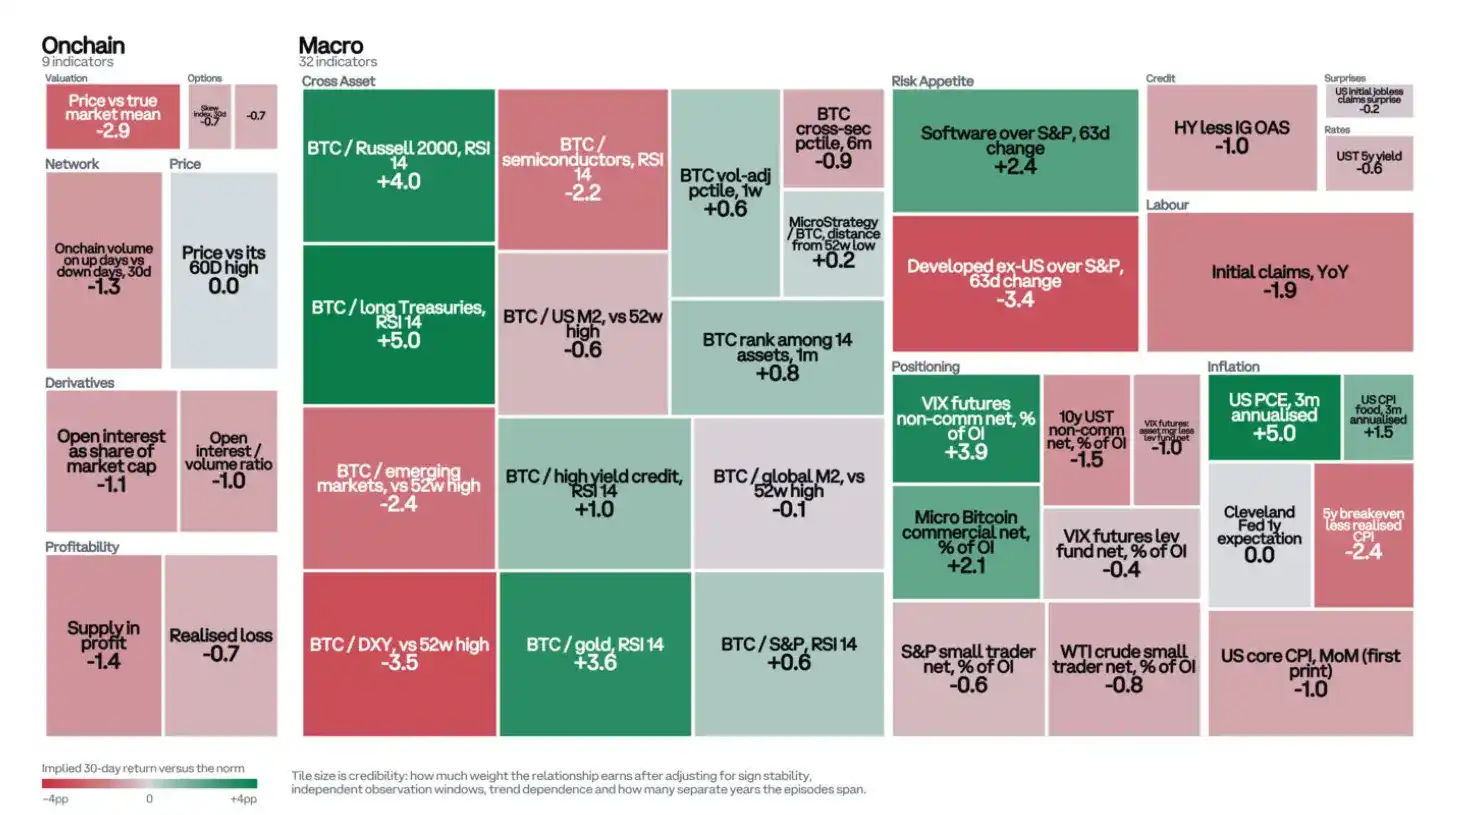
Chart: BTC indicator map, divided into 9 groups of on-chain indicators and 32 groups of macro indicators. Green indicates expected 30-day returns above usual levels, and red indicates below usual levels.
BTC Support and Resistance Levels
This heatmap marks support and resistance levels based on confirmed price turning points in 4-hour candles. The trading volume at each turning point is assigned to a narrow price range, given higher weight before price retests that level, and gradually decays over time. Therefore, darker ranges represent more important price levels in the market. Blue indicates support below the current price, while gray indicates resistance above the current price.
At the end of Q3 2026, Bitcoin was trading at about $83,600. The nearest resistance is at $87,000 to $87,800, the area that capped September's high; slightly higher, around $90,000 to $94,000, there is a denser cost basis supply area. The strongest support below is at $74,500 to $75,200, just above short-term holders' cost basis of $73,500; the 200-day moving average at about $71,200 provides a second layer of support.
This distribution suggests that if price falls back to the low $70,000s, it will encounter multiple overlapping supports. This is consistent with our view of treating that area as an accumulation opportunity. A deeper support level remains near $58,000, where this quarter's low was located.
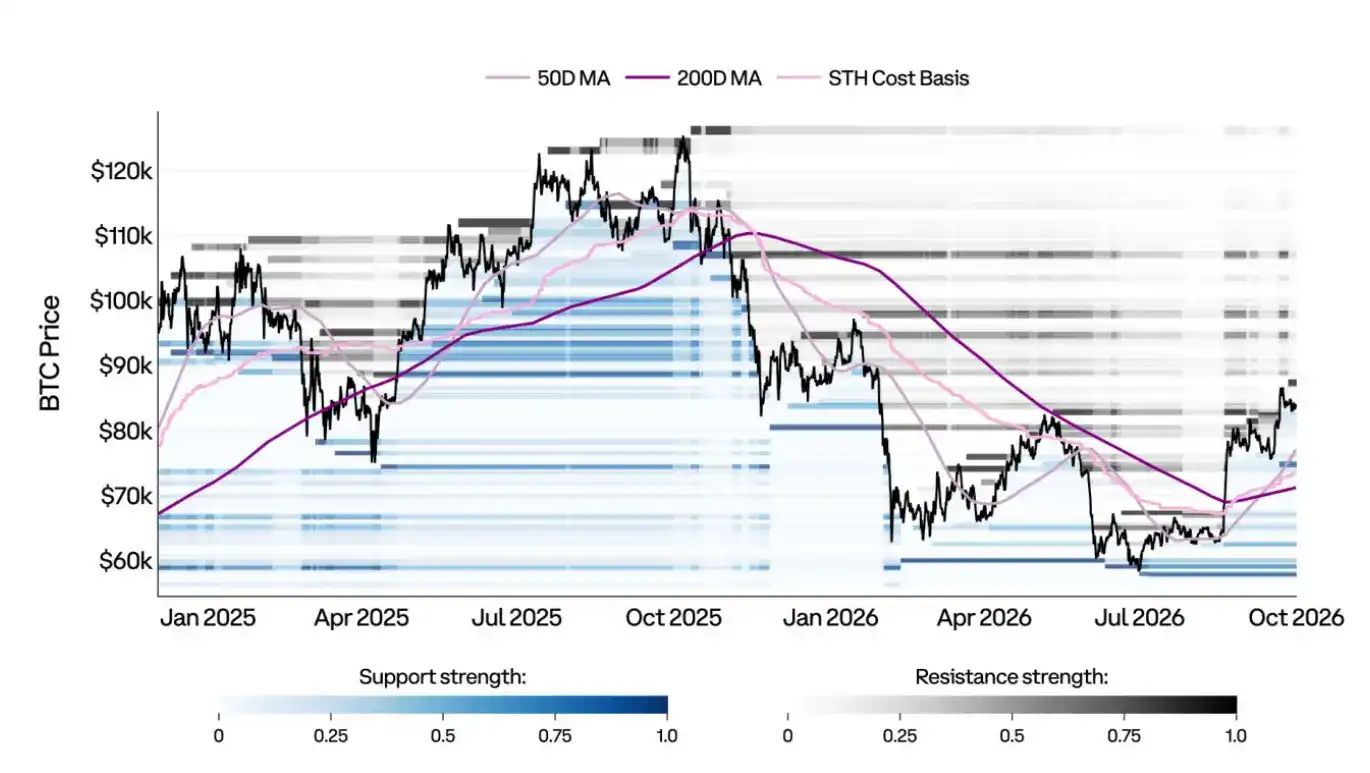
Chart: BTC support and resistance heatmap, overlaid with the 50-day moving average, 200-day moving average, and short-term holder cost basis.
BTC Entity-Adjusted Net Unrealized Profit/Loss (NUPL)
Net unrealized profit/loss (NUPL) is the difference between relative unrealized profit and relative unrealized loss. The zones in the chart are used to reflect investor sentiment from different perspectives. Because markets are hard to predict, each phase is described with two words of opposite meaning. These phases follow the traditional market cycle: when the market recovers from a deep bear market, it often passes through "capitulation -> hope -> optimism -> belief -> euphoria"; after a new all-time high and then a bear market, it may pass through "greed -> denial -> anxiety -> fear -> capitulation."
Entity-adjusted NUPL is an improved version of NUPL that removes transactions between different addresses of the same entity, that is, "internal transactions." As a result, entity-adjusted NUPL counts only real economic activity and provides a better market signal than the unadjusted UTXO-based version.
As prices rose, investor sentiment gradually recovered in Q3 2026. NUPL rose from 0.11 to 0.38, returning from the "hope/fear" zone to the "optimism/anxiety" zone, but still clearly below the threshold for "belief/denial."
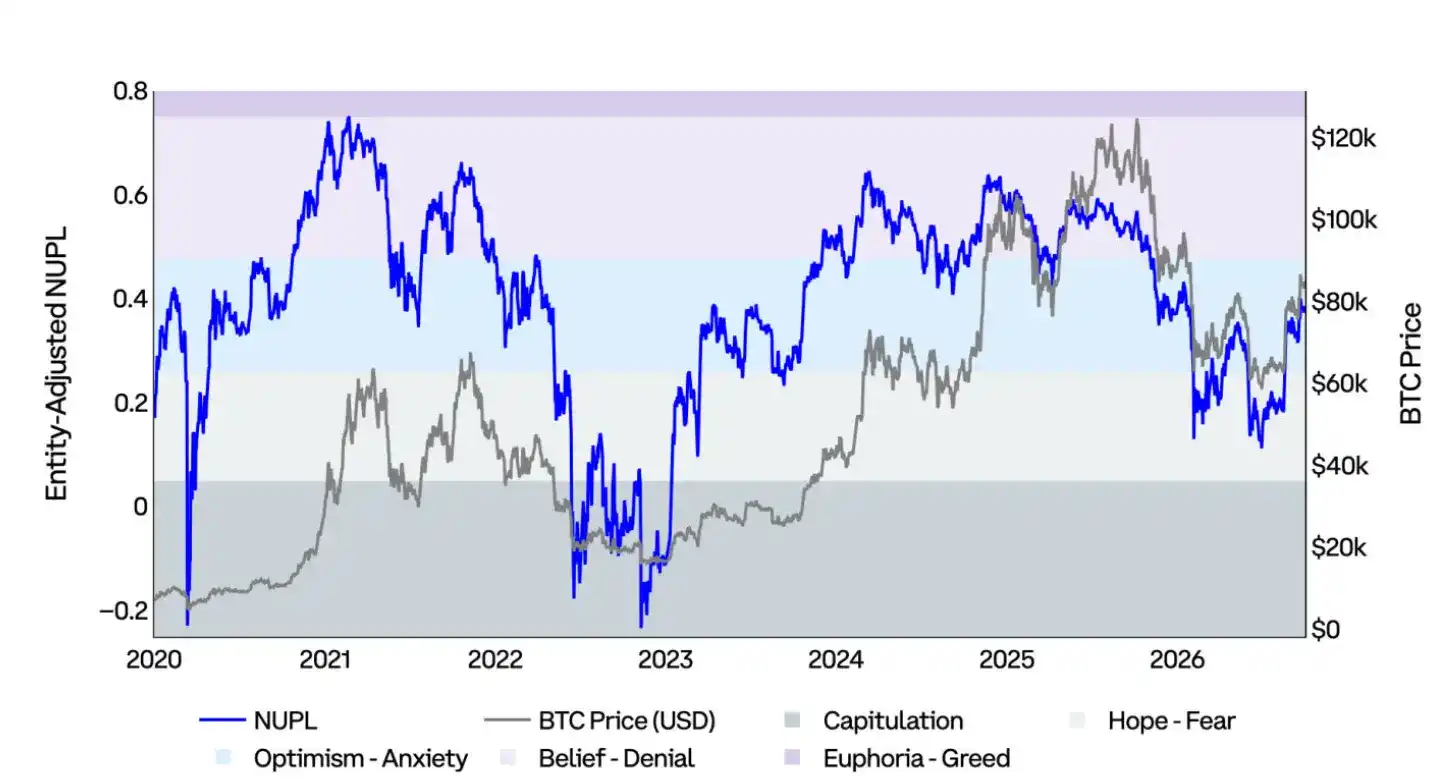
Chart: Entity-adjusted BTC net unrealized profit/loss and BTC price, with different sentiment zones marked.
BTC Realized Price and MVRV
Realized price (or "on-chain cost basis") values each bitcoin at the price on the day of its last on-chain transaction and calculates the average price of the entire bitcoin supply.
The MVRV ratio compares market value (spot price) with realized value (realized price) and is used to measure the multiple of investors' unrealized profit or loss:
- MVRV at 2.0: price is 2 times the average cost (the average holder's return is 2x).
- MVRV at 1.0: price equals average cost (the average holder is at breakeven).
- MVRV at 0.85: price is 15% below average cost (the average holder has a 15% unrealized loss).
Extreme MVRV values help identify when the market is overheated or undervalued, and when investor profitability significantly deviates from the average.
In Q3 2026, as prices recovered, MVRV rose from 1.10 to 1.56, but remained below its median of 1.76 since 2020.
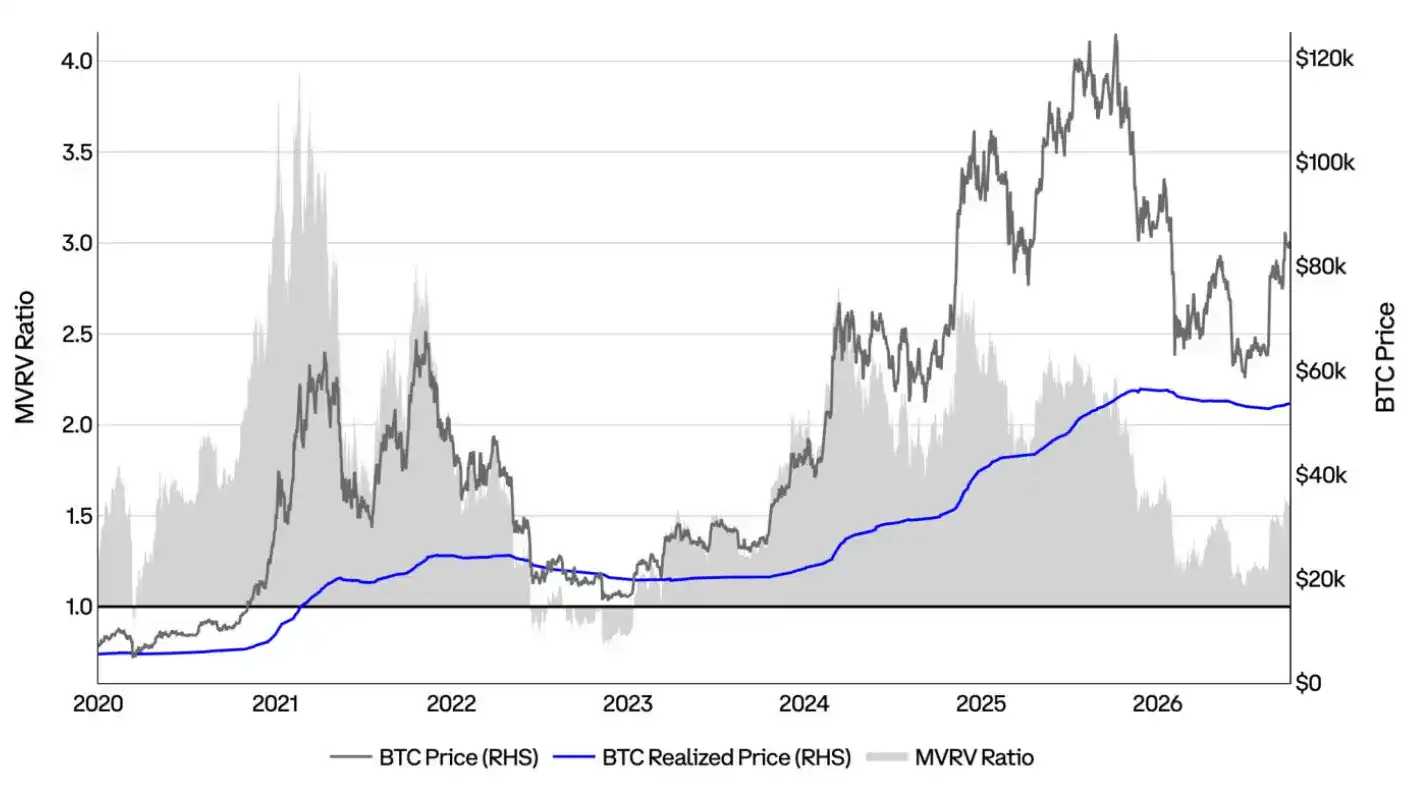
Chart: BTC spot price, realized price, and MVRV ratio.
Profit/Loss Status of BTC Supply
This chart shows the share of BTC supply in profit and sets two statistical boundaries at plus and minus 1 standard deviation. They represent important warning and accumulation zones, respectively. This indicator helps to understand investors' positioning and assess the periods in which most of the supply is in profit or loss.
In Q3 2026, the metric rose from 46% to 71%, moving back above the minus 1 standard deviation line, leaving the historical accumulation zone, but still clearly below the 91% warning line.
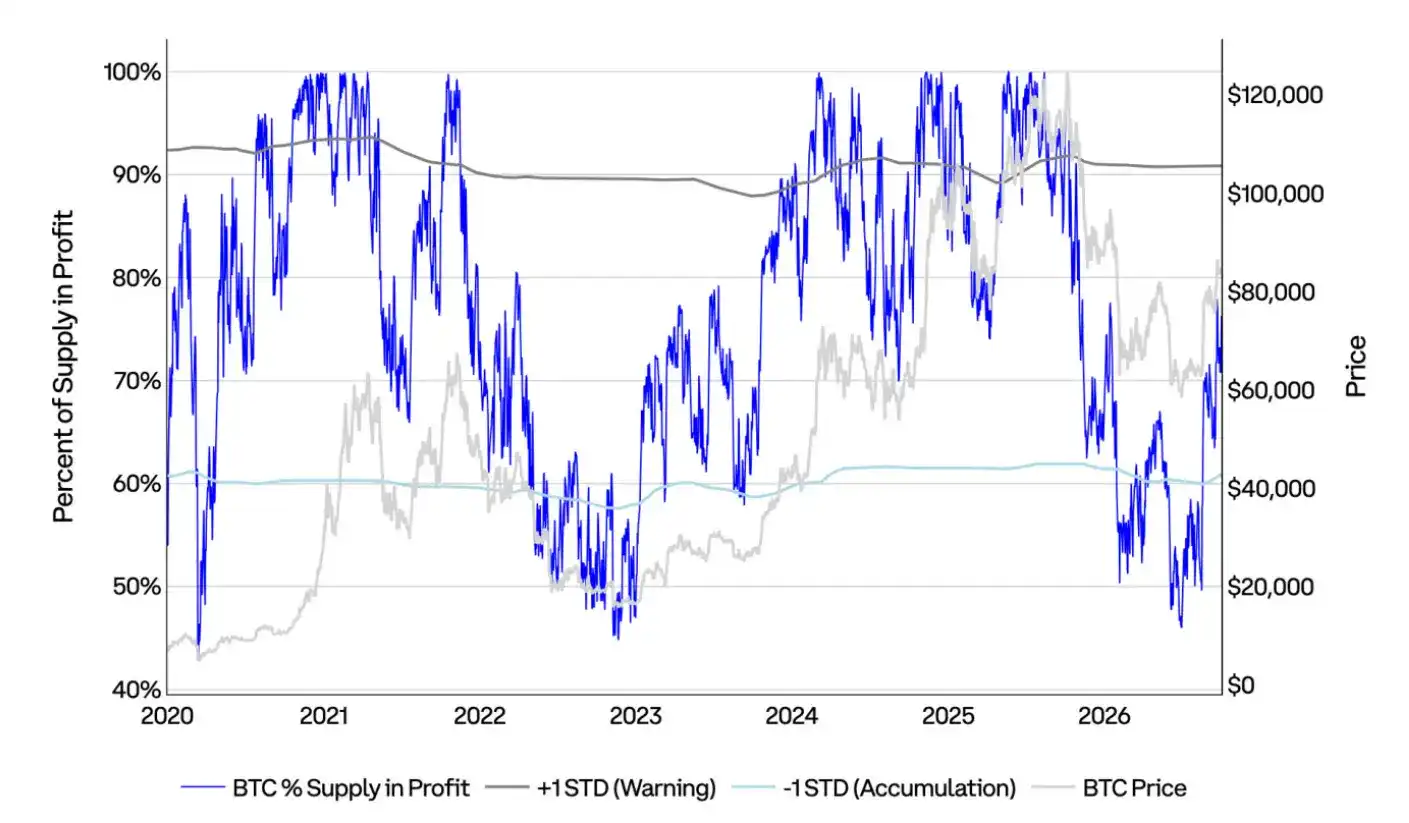
Chart: BTC share of supply in profit, plus 1 standard deviation warning line, minus 1 standard deviation accumulation line, and BTC price.
BTC Dormant Supply and Active Supply
This chart compares the circulating supply of BTC that has not moved for at least one year with the circulating supply of BTC that has been active in a short period (less than three months).
The amount of BTC that last moved within the past three months increased 16% in Q3 2026 after touching its lowest level since late 2023 in July. This rally brought some supply back into circulation. At the same time, supply that has not moved for more than one year still increased by about 340,000 BTC, indicating that long-term holders largely continued to hold during the rally.
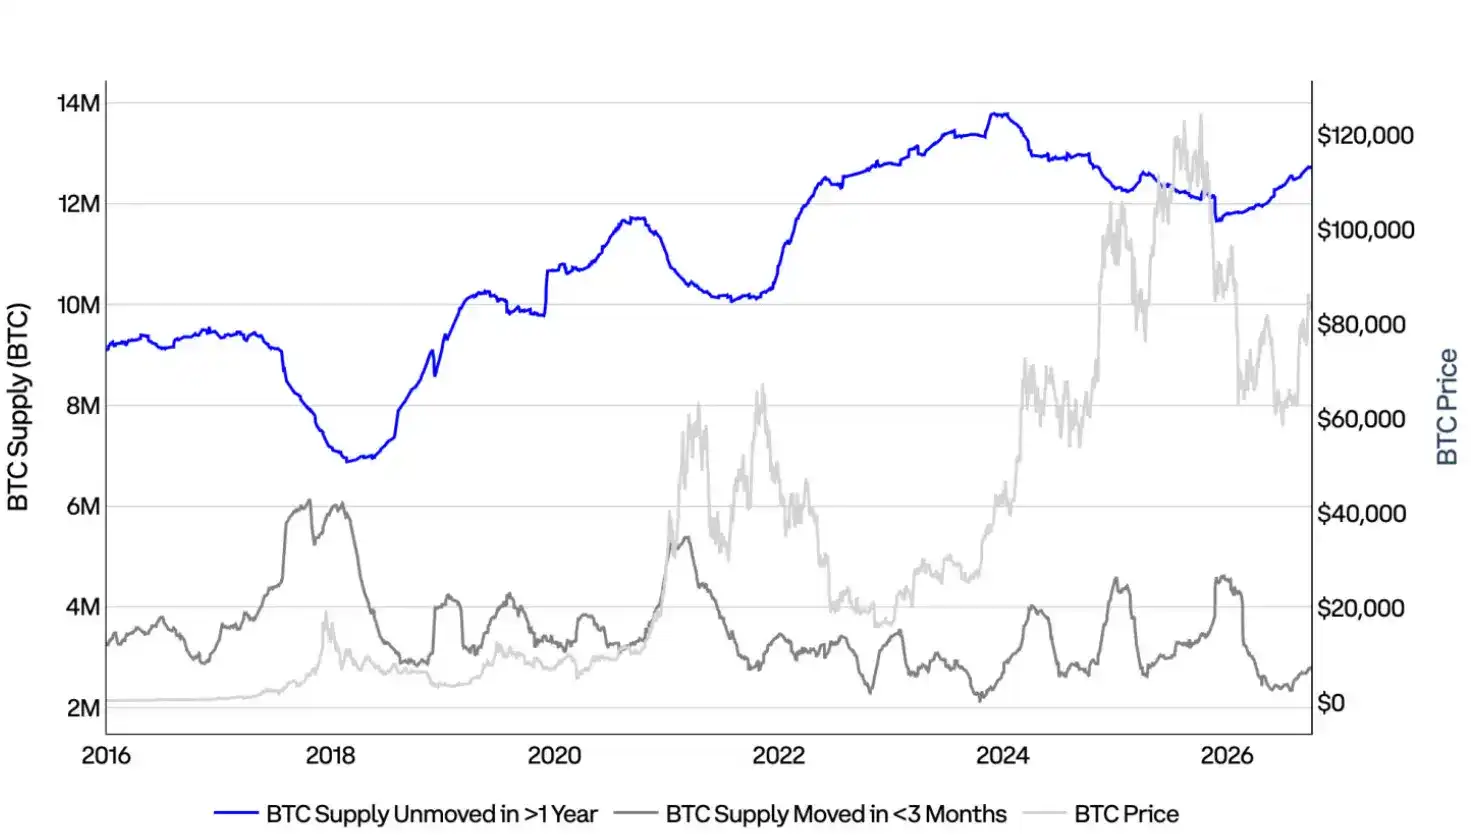
Chart: BTC supply that has not moved for more than one year, BTC supply that moved within the past three months, and BTC price.
BTC Puell Multiple (30-Day Average)
The Puell Multiple is a fundamental on-chain indicator widely used in Bitcoin analysis to measure asset valuation relative to mining fundamentals. Specifically, it is calculated by dividing the USD value of BTC's daily new issuance by the 365-day moving average of that daily issuance value.
This calculation helps determine whether Bitcoin's price is significantly oversold or overbought, especially when compared with historical average mining revenue. It reflects miners' selling pressure and revenue conditions relative to historical norms.
In Q3 2026, the Puell Multiple recovered from 0.67 to 1.02, moving back above the declining annual average of 0.83, indicating that as prices rose, miner revenue returned to around the usual level of the past year.
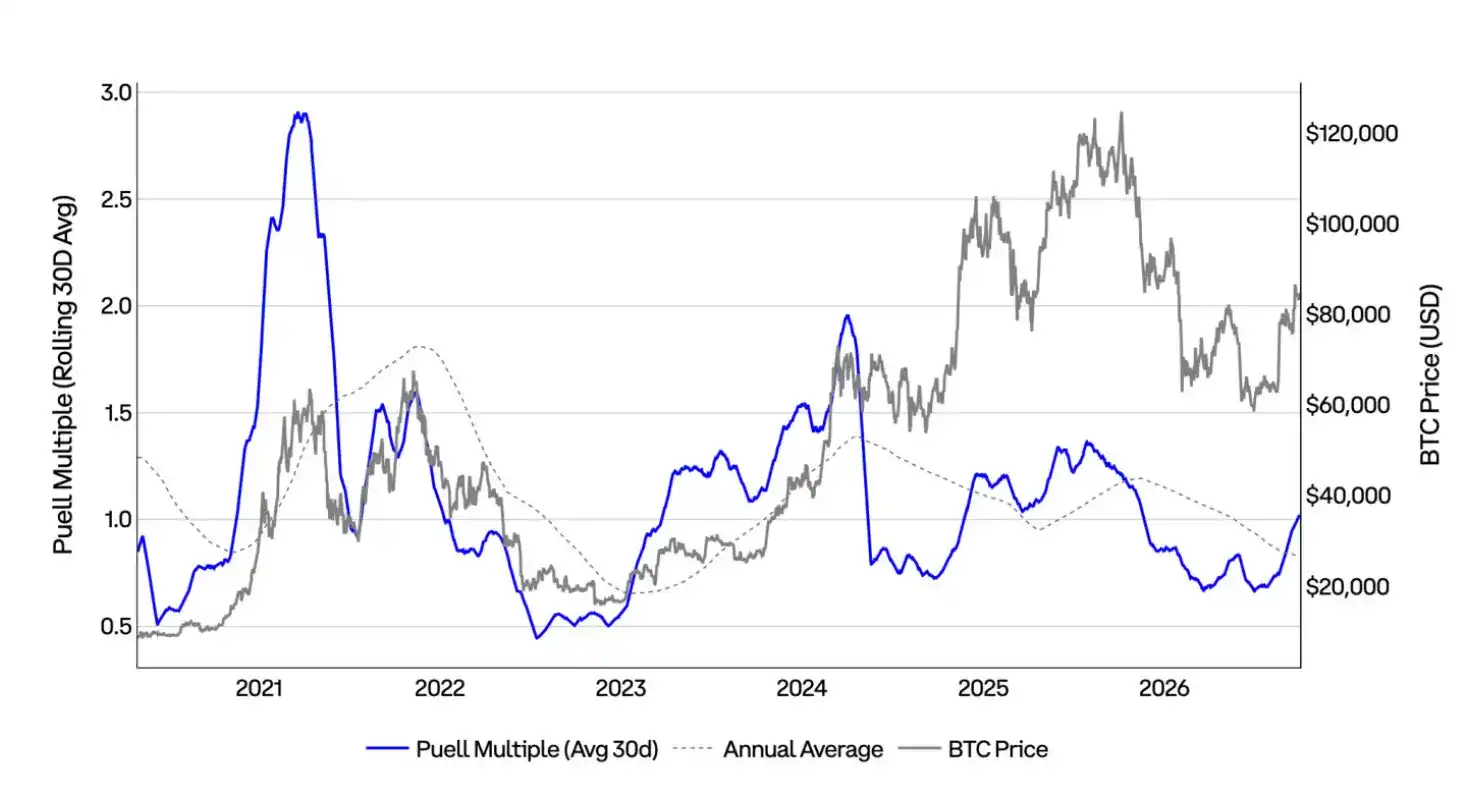
Chart: 30-day rolling average of the BTC Puell Multiple, annual average, and BTC price.
BTC Long-Term Holder Net Position Change
This chart compares the net position change of long-term holders (LTH, holding for 155 days or more) with the net position change on exchanges. We believe that rising long-term holder positions combined with falling exchange positions may indicate that investors are actively accumulating.
Applying this framework to Q3 2026 shows that long-term holders continued to accumulate in July, but around the August price breakout they turned to slight net selling as coins flowed back into exchanges. In September, both trends reversed: long-term holder net position change turned positive again, and exchange balances began to decline.
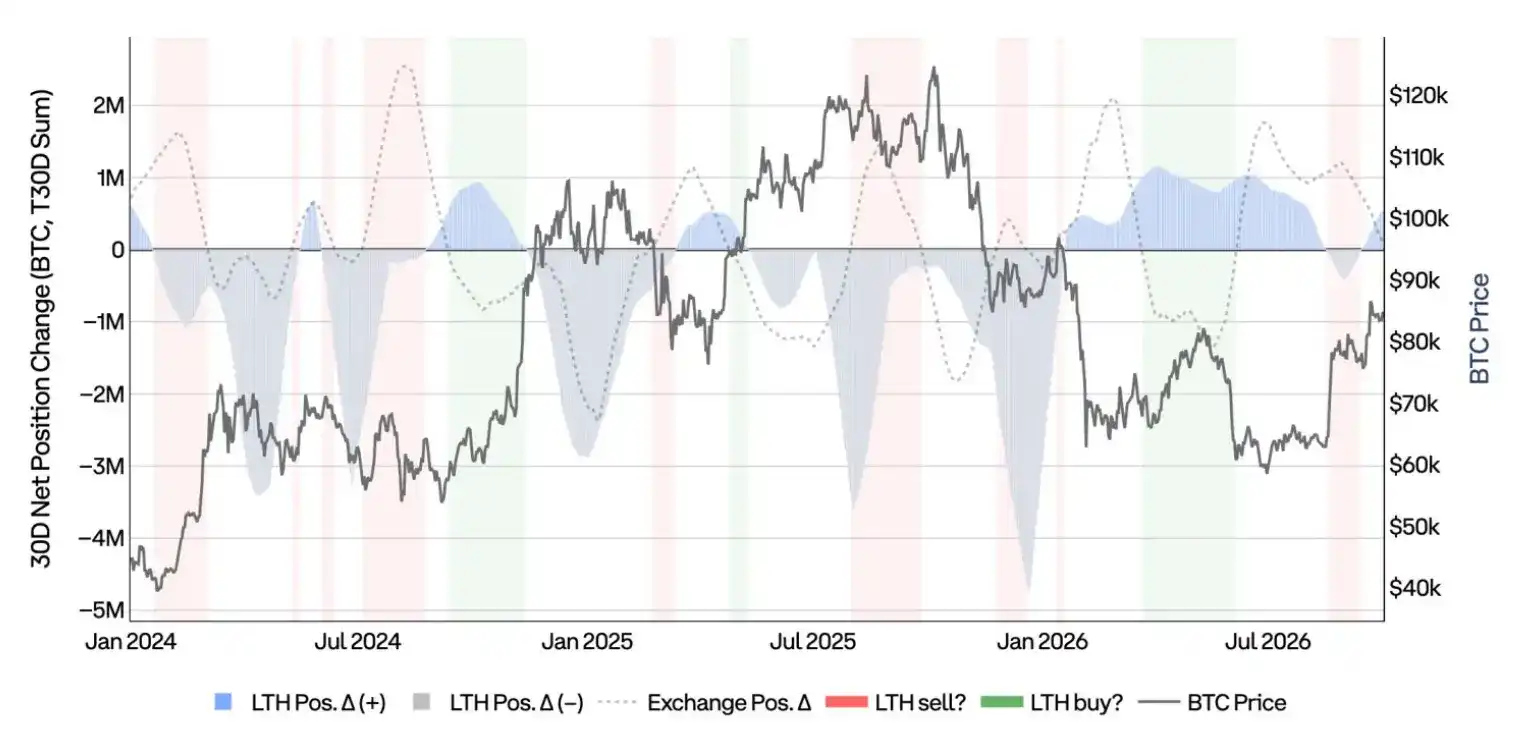
Chart: 30-day net change in long-term holder positions and exchange positions, overlaid with BTC price.
BTC Derivatives Market
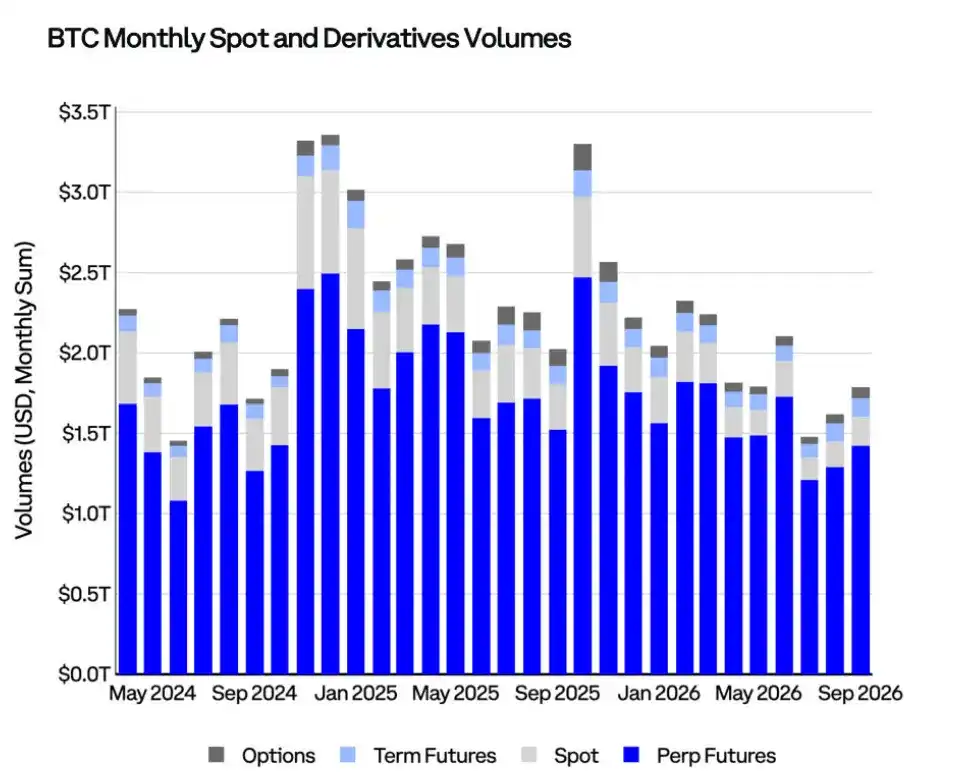
Chart: Monthly BTC spot, perpetual futures, dated futures, and options trading volume.
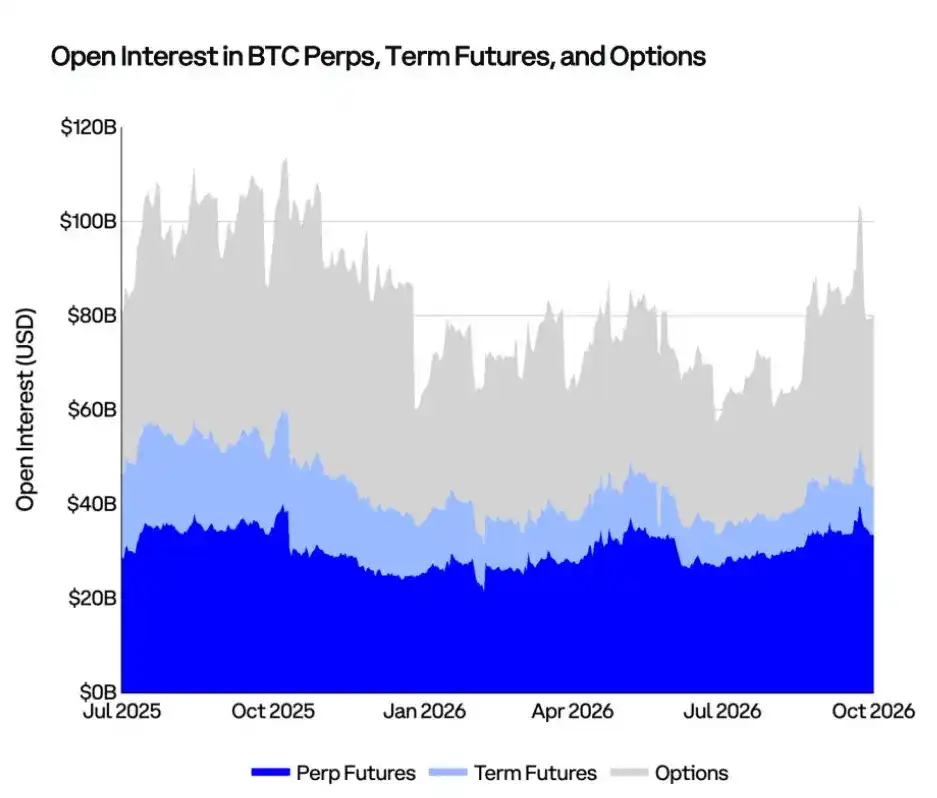
Chart: USD notional value of BTC perpetual futures, dated futures, and options open interest.
Ethereum
Ethereum is an open-source blockchain platform where developers can run decentralized applications (dApps) and create and deploy smart contracts. Ether (ETH) is the native cryptocurrency of the Ethereum network, and its market capitalization ranks second among all cryptocurrencies, behind only Bitcoin.
- Developers: Ethereum was conceived by Vitalik Buterin, who published the whitepaper in 2014 and launched the project in 2015. Co-founders include Gavin Wood, Charles Hoskinson, Anthony Di Iorio, and Joseph Lubin.
- Reference price: Ether Reference Rate (ETHUSD_RR), CME CF Benchmark Reference Rate
- Bloomberg ticker: XET Currency
- Circulating supply: 122.2 million coins
- DeFi total value locked: $53.3 billion
- Inflation rate: 0.88%
Ethereum: Key Takeaways
- In Q3 2026, ETH supply that had not moved for more than one year increased 7% to 66.7 million coins; coins that last moved within the past three months decreased 18% to 11 million coins. This indicates that holders largely continued to hold during the rally rather than selling into it.
- As Ether rose 71% in Q3 2026, net unrealized profit/loss (NUPL), which measures ETH market sentiment, recovered from -0.31 to 0.22, moving the metric out of the "capitulation" zone and into the "optimism/anxiety" zone. MVRV rose from 0.70 to 1.19, and the average holder returned to profitability for the first time since May.
- In Q3 2026, Ethereum DeFi TVL rose from $37 billion to $53 billion. After declining for a full year, L2's share of stablecoin value began to recover. U.S. spot Ether ETFs saw $3.1 billion in net inflows this quarter, reversing outflows from the first half, and assets rose from $10.6 billion to $21.6 billion. In September, L2 fees increased significantly, driven mainly by a surge in activity on Robinhood's layer-2 network in the first week of the month. Taken together, these data indicate that as prices recovered, ecosystem participation also broadened.
ETH Support and Resistance Levels
This heatmap marks support and resistance levels based on confirmed price turning points in 4-hour candles. The trading volume at each turning point is assigned to a narrow price range, given higher weight before price retests that level, and gradually decays over time. Therefore, darker ranges represent more important price levels in the market. Blue indicates support below the current price, while gray indicates resistance above the current price.
At the end of Q3 2026, Ether was trading at about $2,685, just below the $2,685 to $2,695 resistance zone and slightly above the $2,640 to $2,685 support zone. After the August breakout, price entered a narrow, densely traded range. The strongest support below is at $2,335 to $2,380, followed by the market cost basis at about $2,265 and the 200-day moving average at about $2,105.
The September 2 low of about $2,355 fell within this support zone, and Ether remained above that area throughout the month. This resilience contrasts with the first half of the year, when price spent most of its time below the market cost basis. This quarter's high of about $2,800 remains the level that needs to be broken.
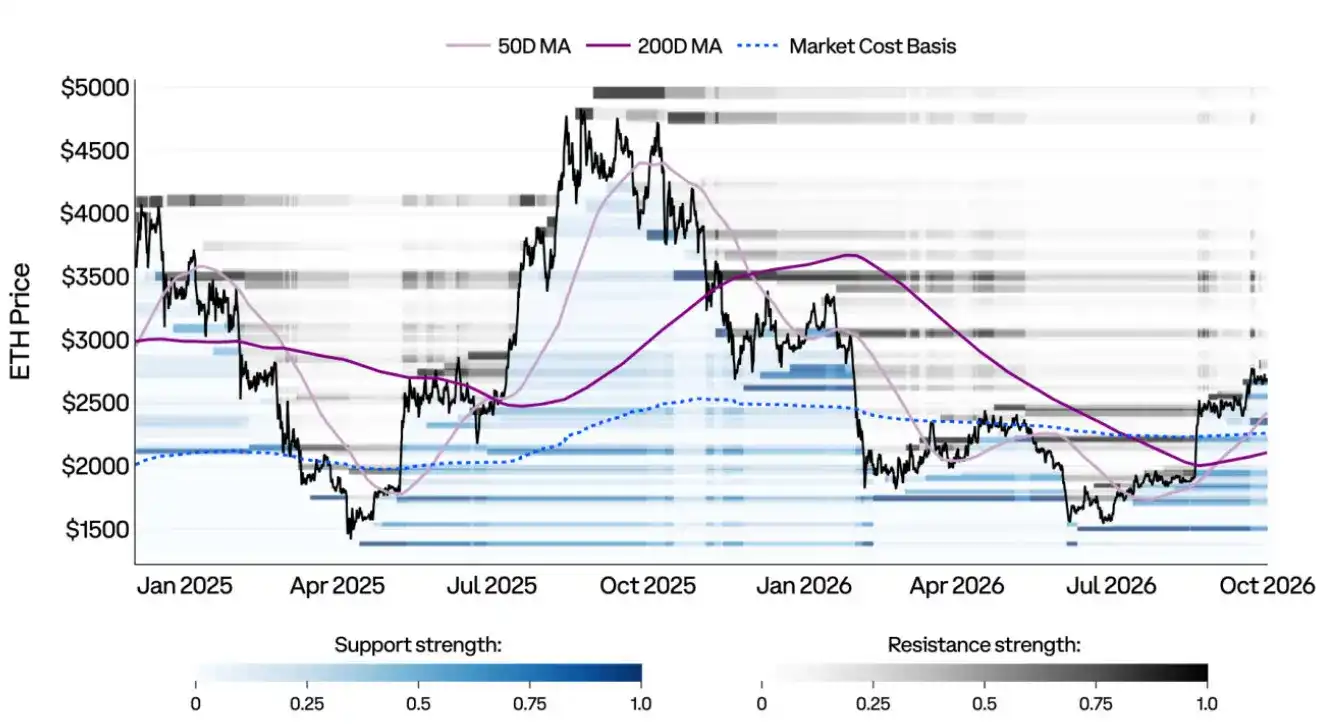
Chart: ETH support and resistance heatmap, overlaid with the 50-day moving average, 200-day moving average, and market cost basis.
ETH Net Unrealized Profit/Loss (NUPL)
This chart measures investor sentiment through net unrealized profit/loss (NUPL). The metric is the difference between relative unrealized profit and relative unrealized loss. The zones in the chart are used to reflect investor sentiment from different perspectives. Because markets are hard to predict, each phase is described with two words of opposite meaning. These phases follow the traditional market cycle: when the market recovers from a deep bear market, it often passes through "capitulation -> hope -> optimism -> belief -> euphoria"; after a new all-time high and then a bear market, it may pass through "greed -> denial -> anxiety -> fear -> capitulation."
In Q3 2026, Ether rose 71%, and ETH recovered from the "capitulation" phase, with NUPL rising from -0.31 to 0.22, leaving the average holder back in profit by the end of the quarter.
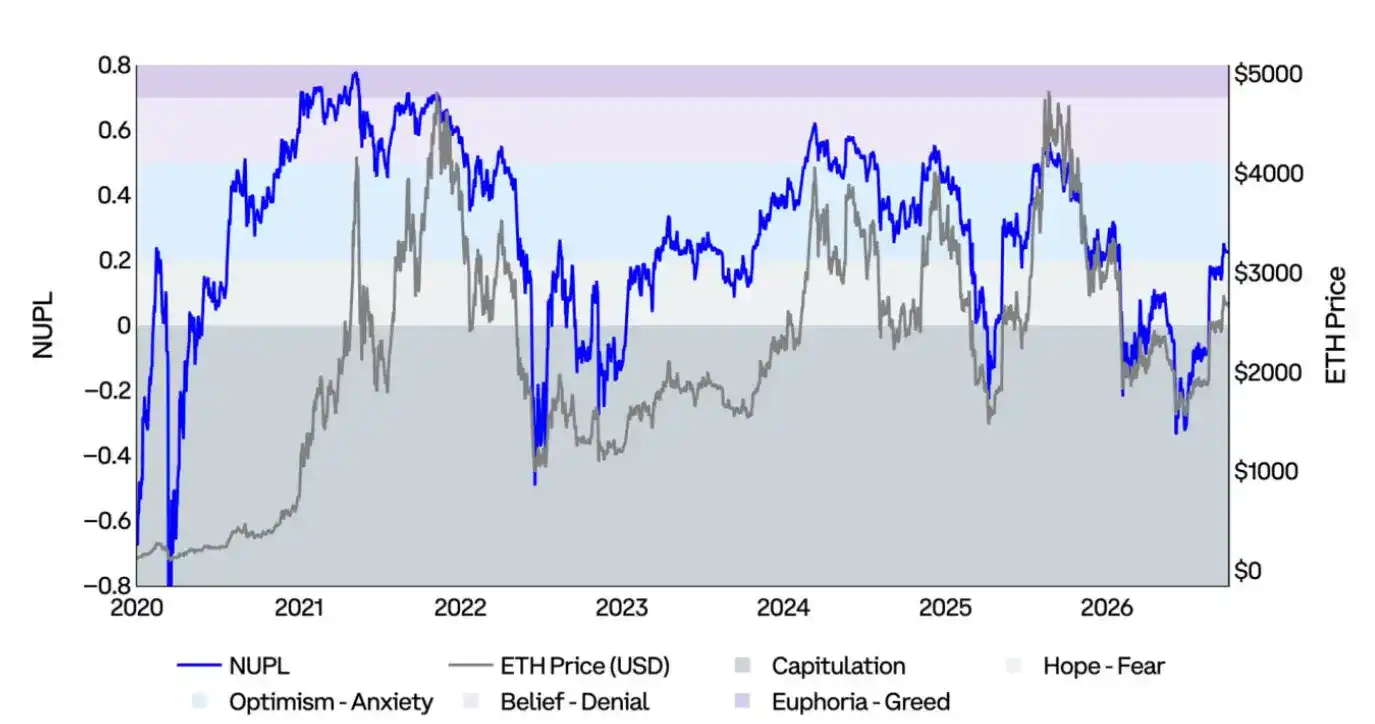
Chart: ETH net unrealized profit/loss and ETH price, with different sentiment zones marked.
ETH Realized Price and MVRV
Realized price (or "on-chain cost basis") values each ether at the price on the day of its last on-chain transaction and calculates the average price of the entire ether supply.
The MVRV ratio compares market value (spot price) with realized value (realized price) and is used to measure the multiple of investors' unrealized profit or loss:
- MVRV at 2.0: price is 2 times the average cost (the average holder's return is 2x).
- MVRV at 1.0: price equals average cost (the average holder is at breakeven).
- MVRV at 0.85: price is 15% below average cost (the average holder has a 15% unrealized loss).
Extreme MVRV values help identify when the market is overheated or undervalued, and when investor profitability significantly deviates from the average.
In Q3 2026, Ether rose 71%, and MVRV rose from 0.70 to 1.19, making the average holder profitable again for the first time since May. MVRV remains below its median of 1.3 since 2020, indicating that despite the price increase, valuations remain moderate.
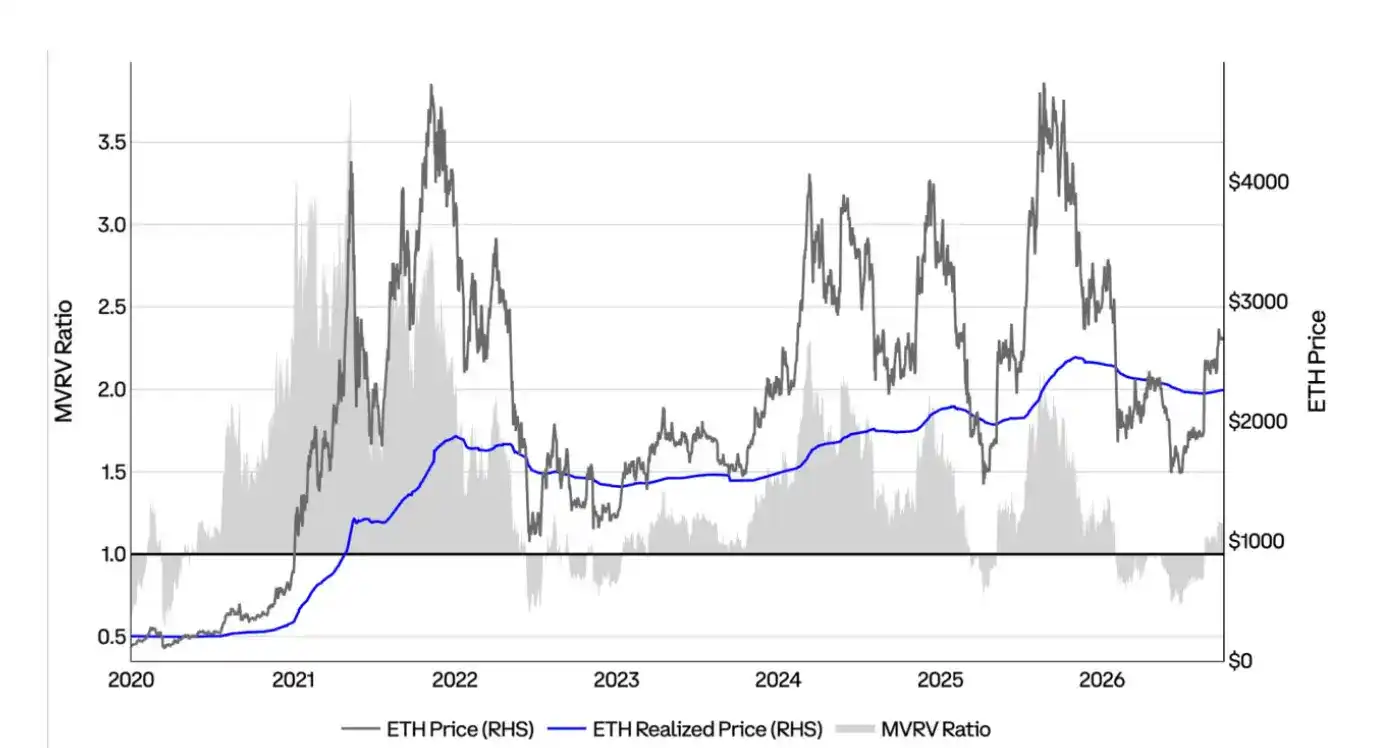
Chart: ETH spot price, realized price, and MVRV ratio.
Profit/Loss Status of ETH Supply
This chart shows the share of ETH supply in profit and sets two statistical boundaries at plus and minus 1 standard deviation. They represent important warning and accumulation zones, respectively. This indicator helps to understand investors' positioning and assess the periods in which most of the supply is in profit or loss.
In Q3 2026, the metric rose from 28% to 63%, moving back above the minus 1 standard deviation line, leaving the historical accumulation zone, but still clearly below the 87% warning line.
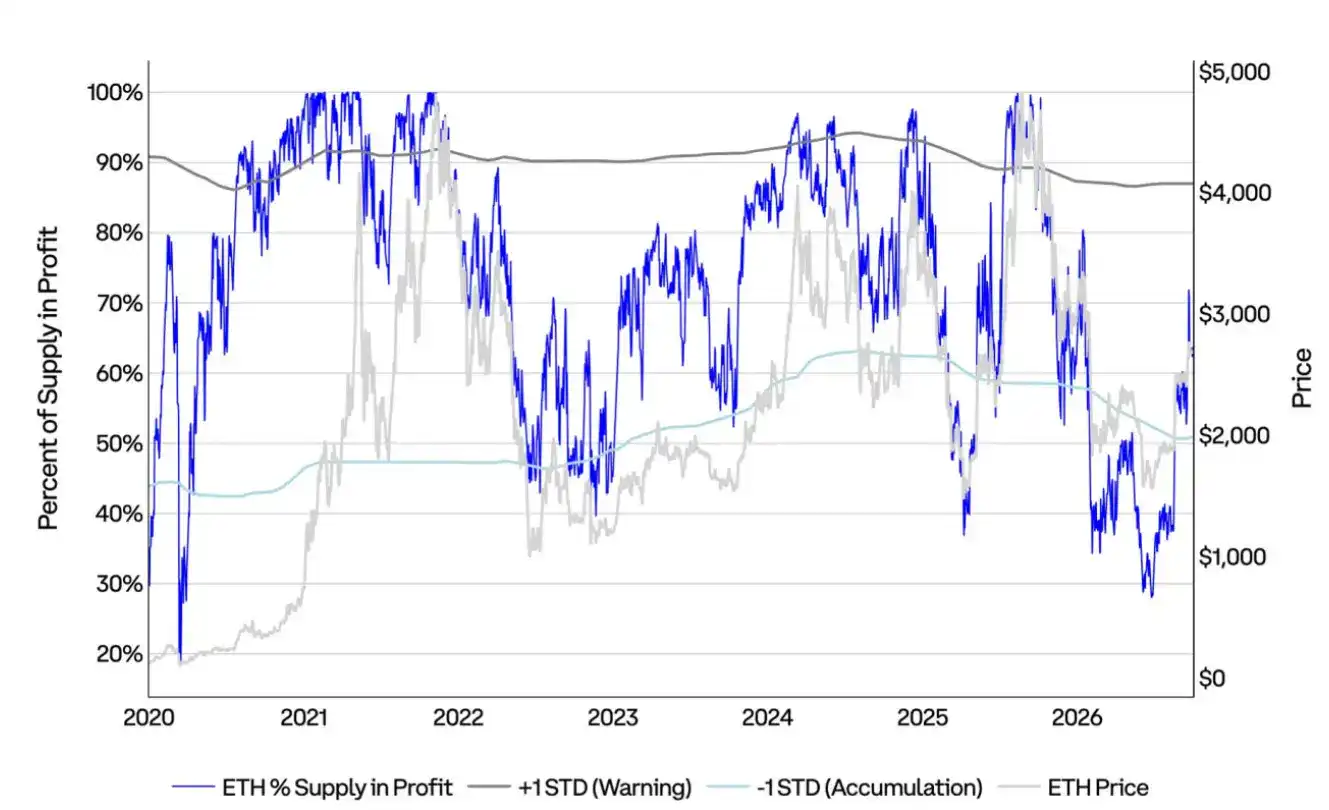
Chart: ETH share of supply in profit, plus 1 standard deviation warning line, minus 1 standard deviation accumulation line, and ETH price.
ETH Dormant Supply and Active Supply
This chart compares the circulating supply of ETH that has not moved for at least one year with the circulating supply of ETH that has been active in a short period (less than three months).
In Q3 2026, ETH supply that had not moved for more than one year increased 7%, while coins that last moved within the past three months decreased 18% to 11 million coins. This indicates that holders largely continued to hold during the rally rather than selling into it.
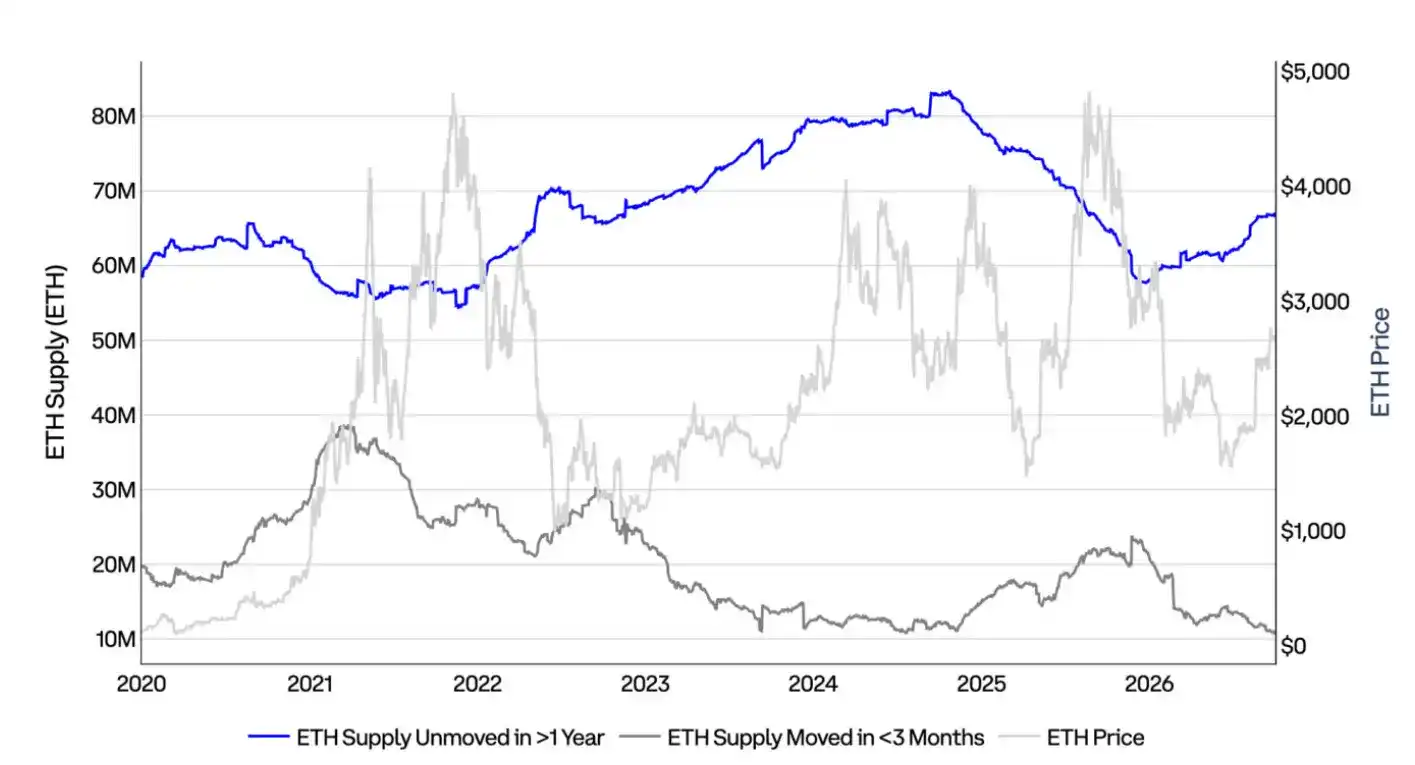
Chart: ETH supply that has not moved for more than one year, ETH supply that moved within the past three months, and ETH price.
ETH Derivatives Market
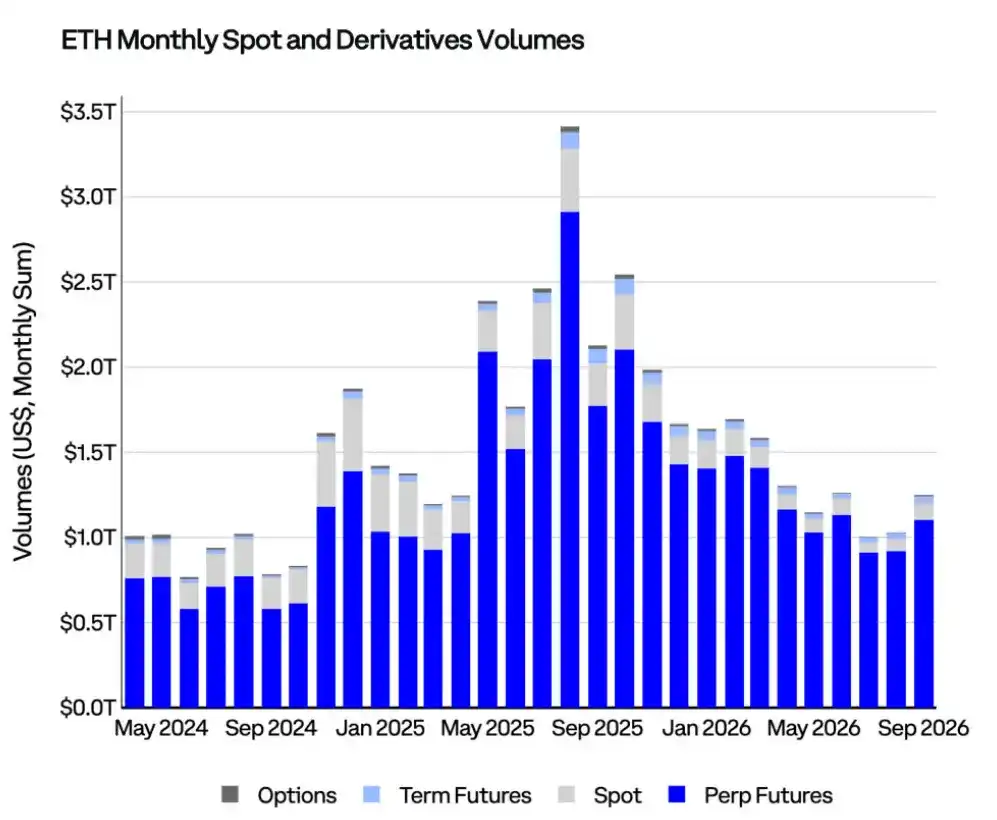
Chart: Monthly ETH spot, perpetual futures, dated futures, and options trading volume.
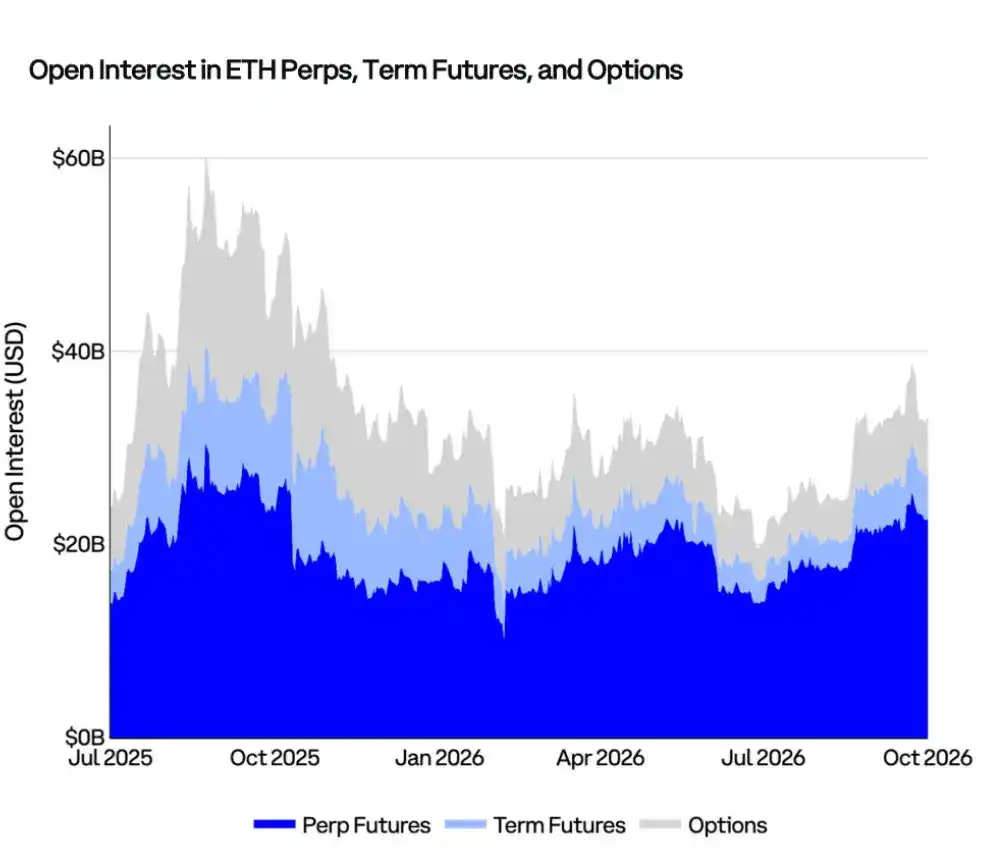
Chart: USD notional value of ETH perpetual futures, dated futures, and options open interest.
L2 vs. Ethereum Mainnet
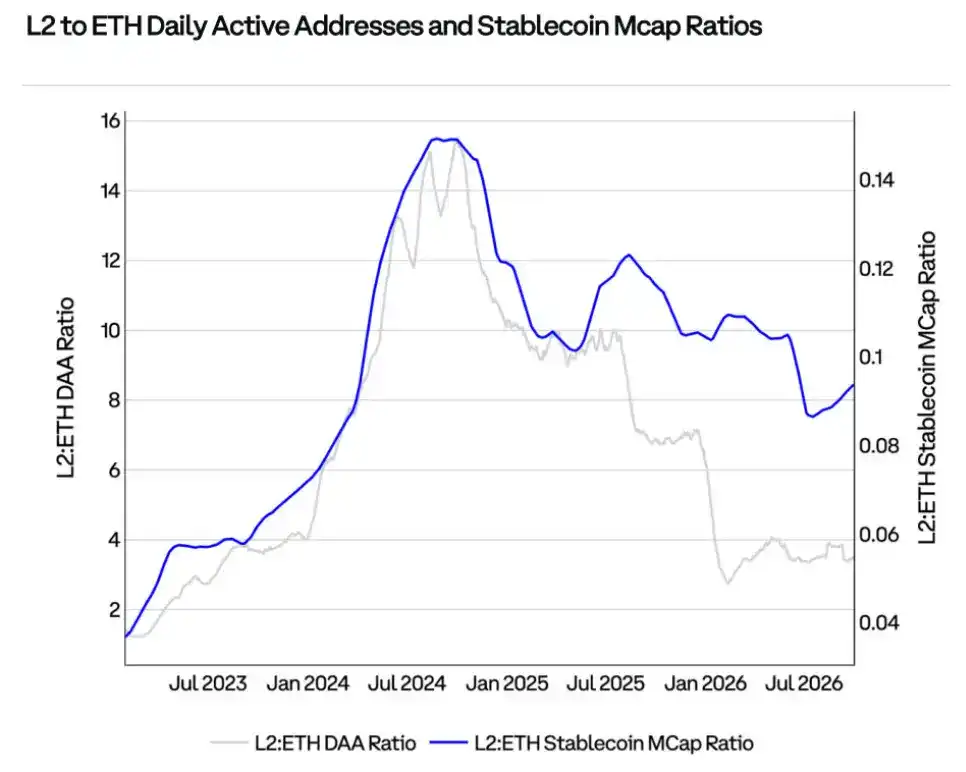
Chart: Ratio of daily active addresses on L2 relative to Ethereum mainnet, and stablecoin market capitalization ratio. A declining ratio means activity and stablecoin liquidity are shifting from L2 to Ethereum mainnet.
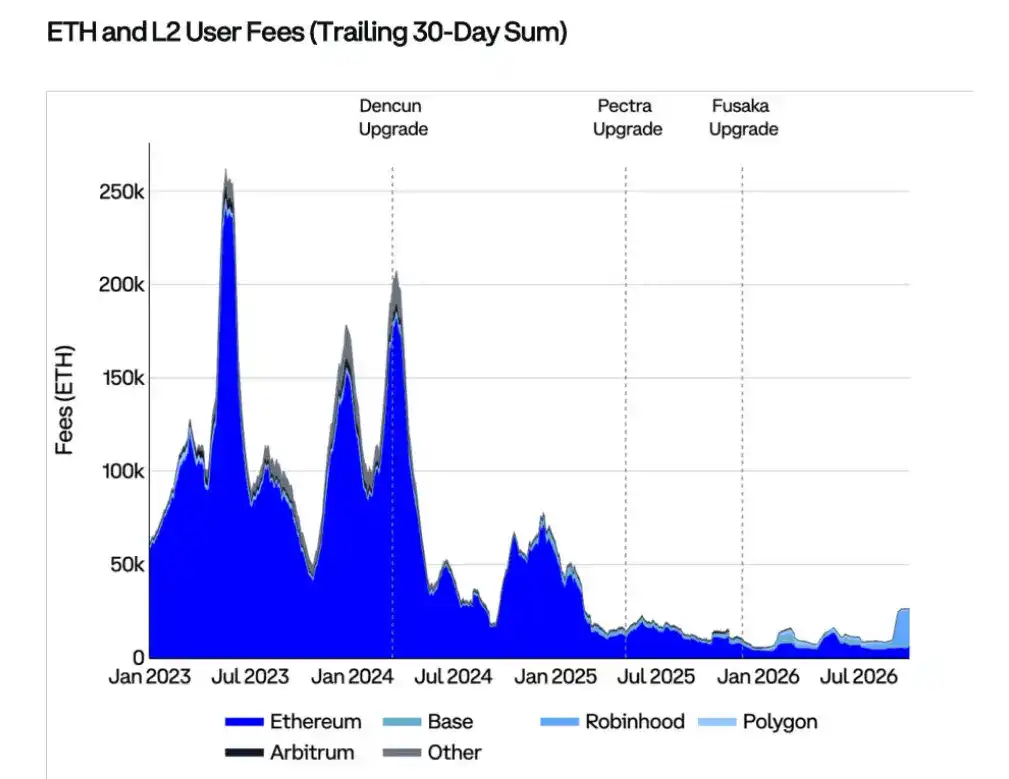
Chart: User fees denominated in ETH on Ethereum, Base, Robinhood, Polygon, Arbitrum, and other networks.