Chainlink reserves grow, yet LINK fails to break above $10: Why?

ambcryptoPublicado em 2026-03-27Última atualização em 2026-03-27

Resumo

Chainlink's LINK reserve has grown by 131,905 tokens (worth over $1.1 million), bringing total holdings to 2.79 million LINK. This reflects strategic accumulation and reduces circulating supply, yet the price remains stuck below the key $10 resistance level. LINK is trading in a bearish pennant pattern with lower highs and fragile support. A breakdown could push prices toward $5.77. The RSI at 46.37 indicates weakening momentum, with buyers failing to regain control. Exchange netflows have declined by 15.31%, reducing immediate sell-side pressure, but demand remains subdued. Liquidation data shows long positions ($55.8K) are being closed more aggressively than shorts ($24.59K), reinforcing bearish sentiment. Despite improving fundamentals like supply and reduced exchange inflows, price action and market positioning suggest continued downside risk unless buyers break above $10.

Chainlink’s [LINK] reserve has added 131,905 LINK worth over $1.1 million, pushing total holdings to 2.79 million LINK while price continues consolidating below key resistance levels. This expansion reflects sustained strategic accumulation rather than short-term positioning.

As tokens move into reserve custody, circulating supply across active markets continues shrinking. This shift directly reduces the volume available for immediate selling pressure.

However, the LINK price has not reacted with strength, which suggests that demand has not matched this tightening supply yet. Instead, the market continues absorbing supply changes without triggering upward expansion.

Chainlink capped below $10 under pressure

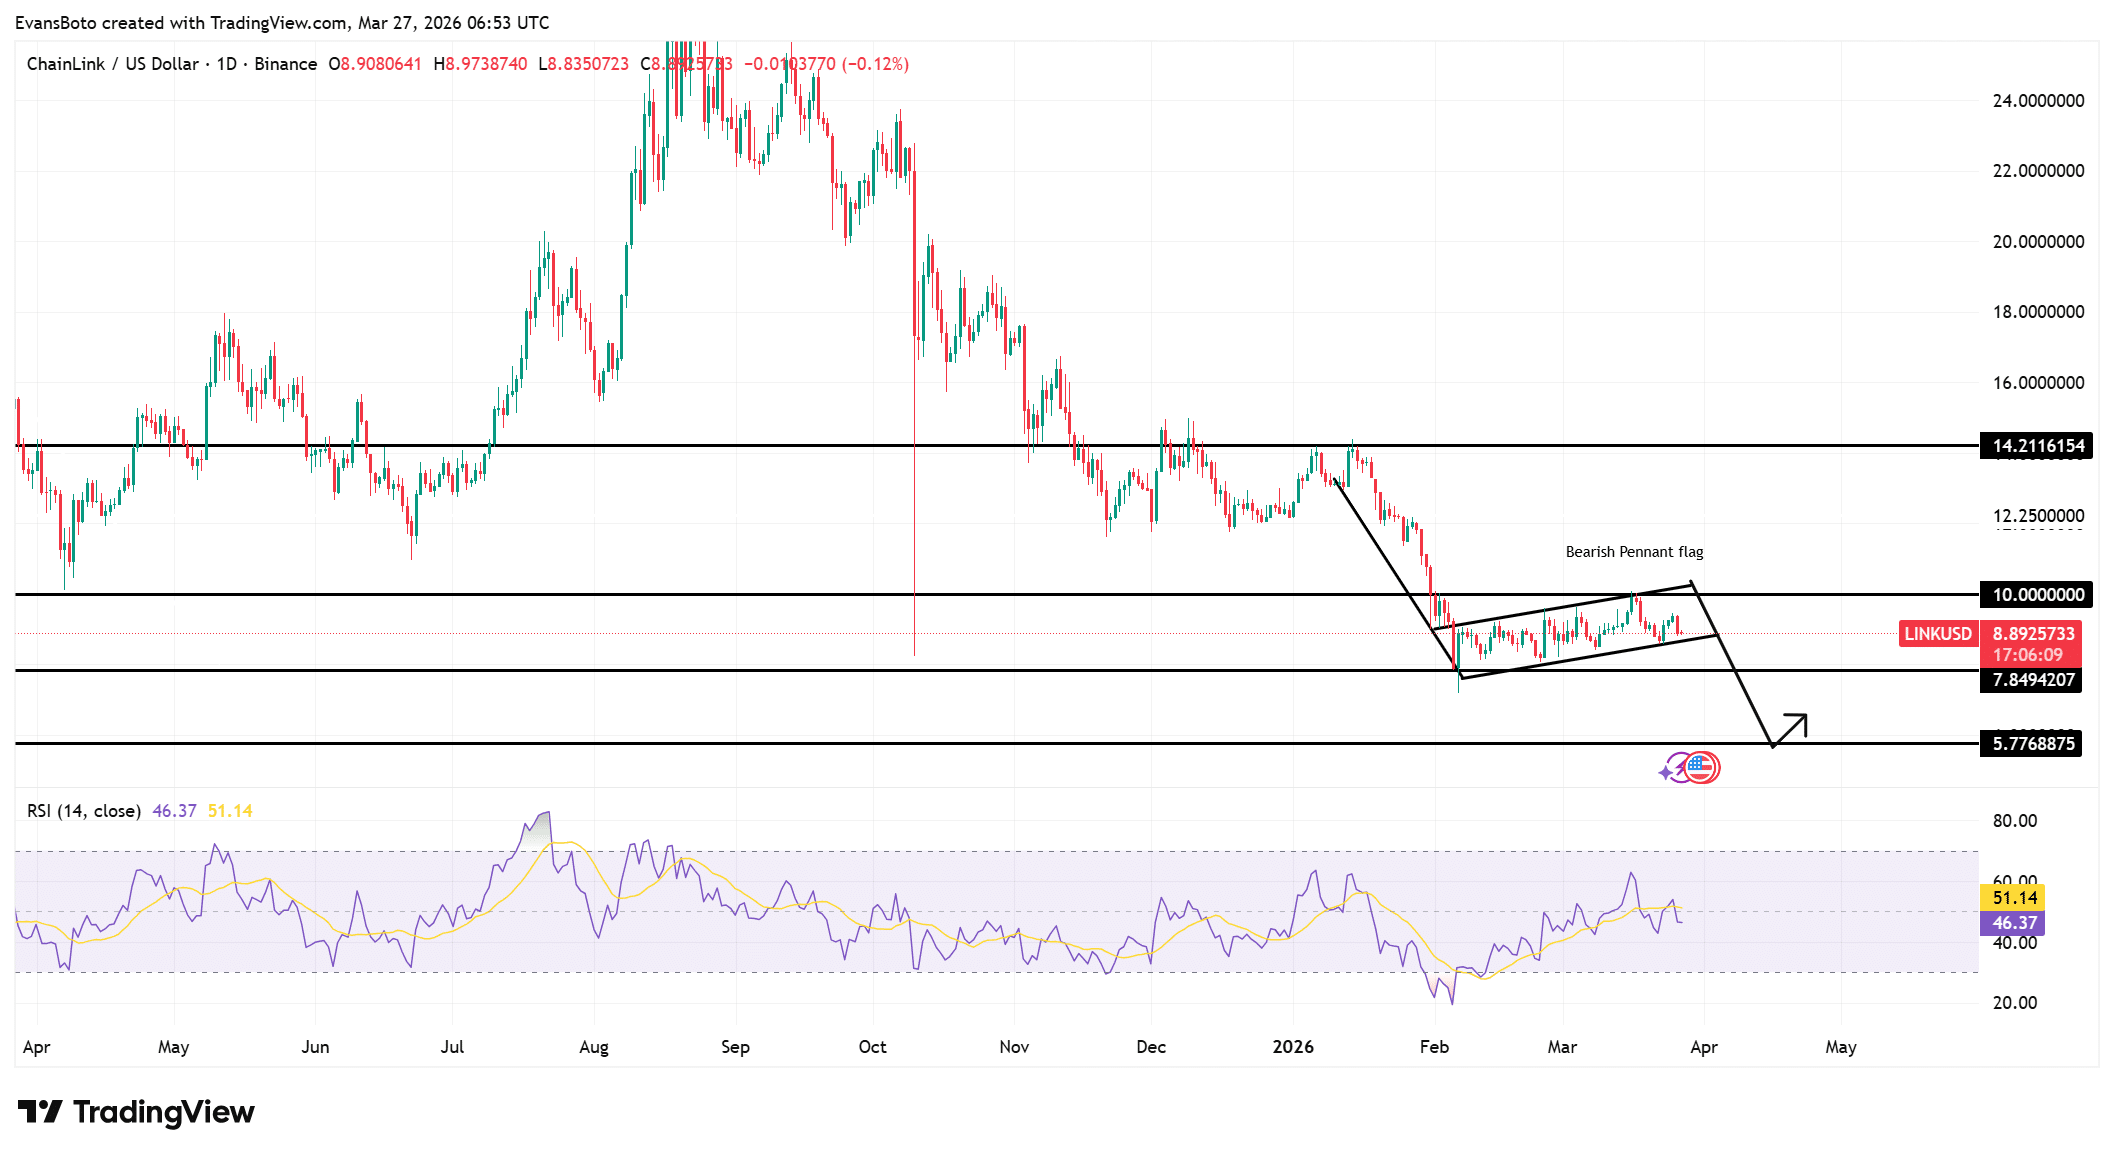
LINK continues trading below the $10 resistance while forming a bearish pennant structure. Price recently declined toward $7.84 before stabilizing near $8.89, which reflects ongoing compression after a sharp drop.

The pennant formation shows lower highs pressing against horizontal resistance, keeping upside attempts limited. However, support remains fragile as the structure leans toward continuation rather than reversal.

A breakdown from this formation would expose the $5.77 level as the next downside target. Although price attempts minor recoveries, rejection near the upper boundary keeps pressure intact. This structure continues guiding direction as sellers defend key resistance levels consistently.

At press time, RSI read 46.37, which reflects weakening strength across recent sessions. Instead of building upward pressure, the indicator has rolled over, aligning with price compression inside the pennant. This behavior signals that buyers have not regained control despite short-term stabilization.

Source: TradingView

Outflows rise as exchange pressure eases

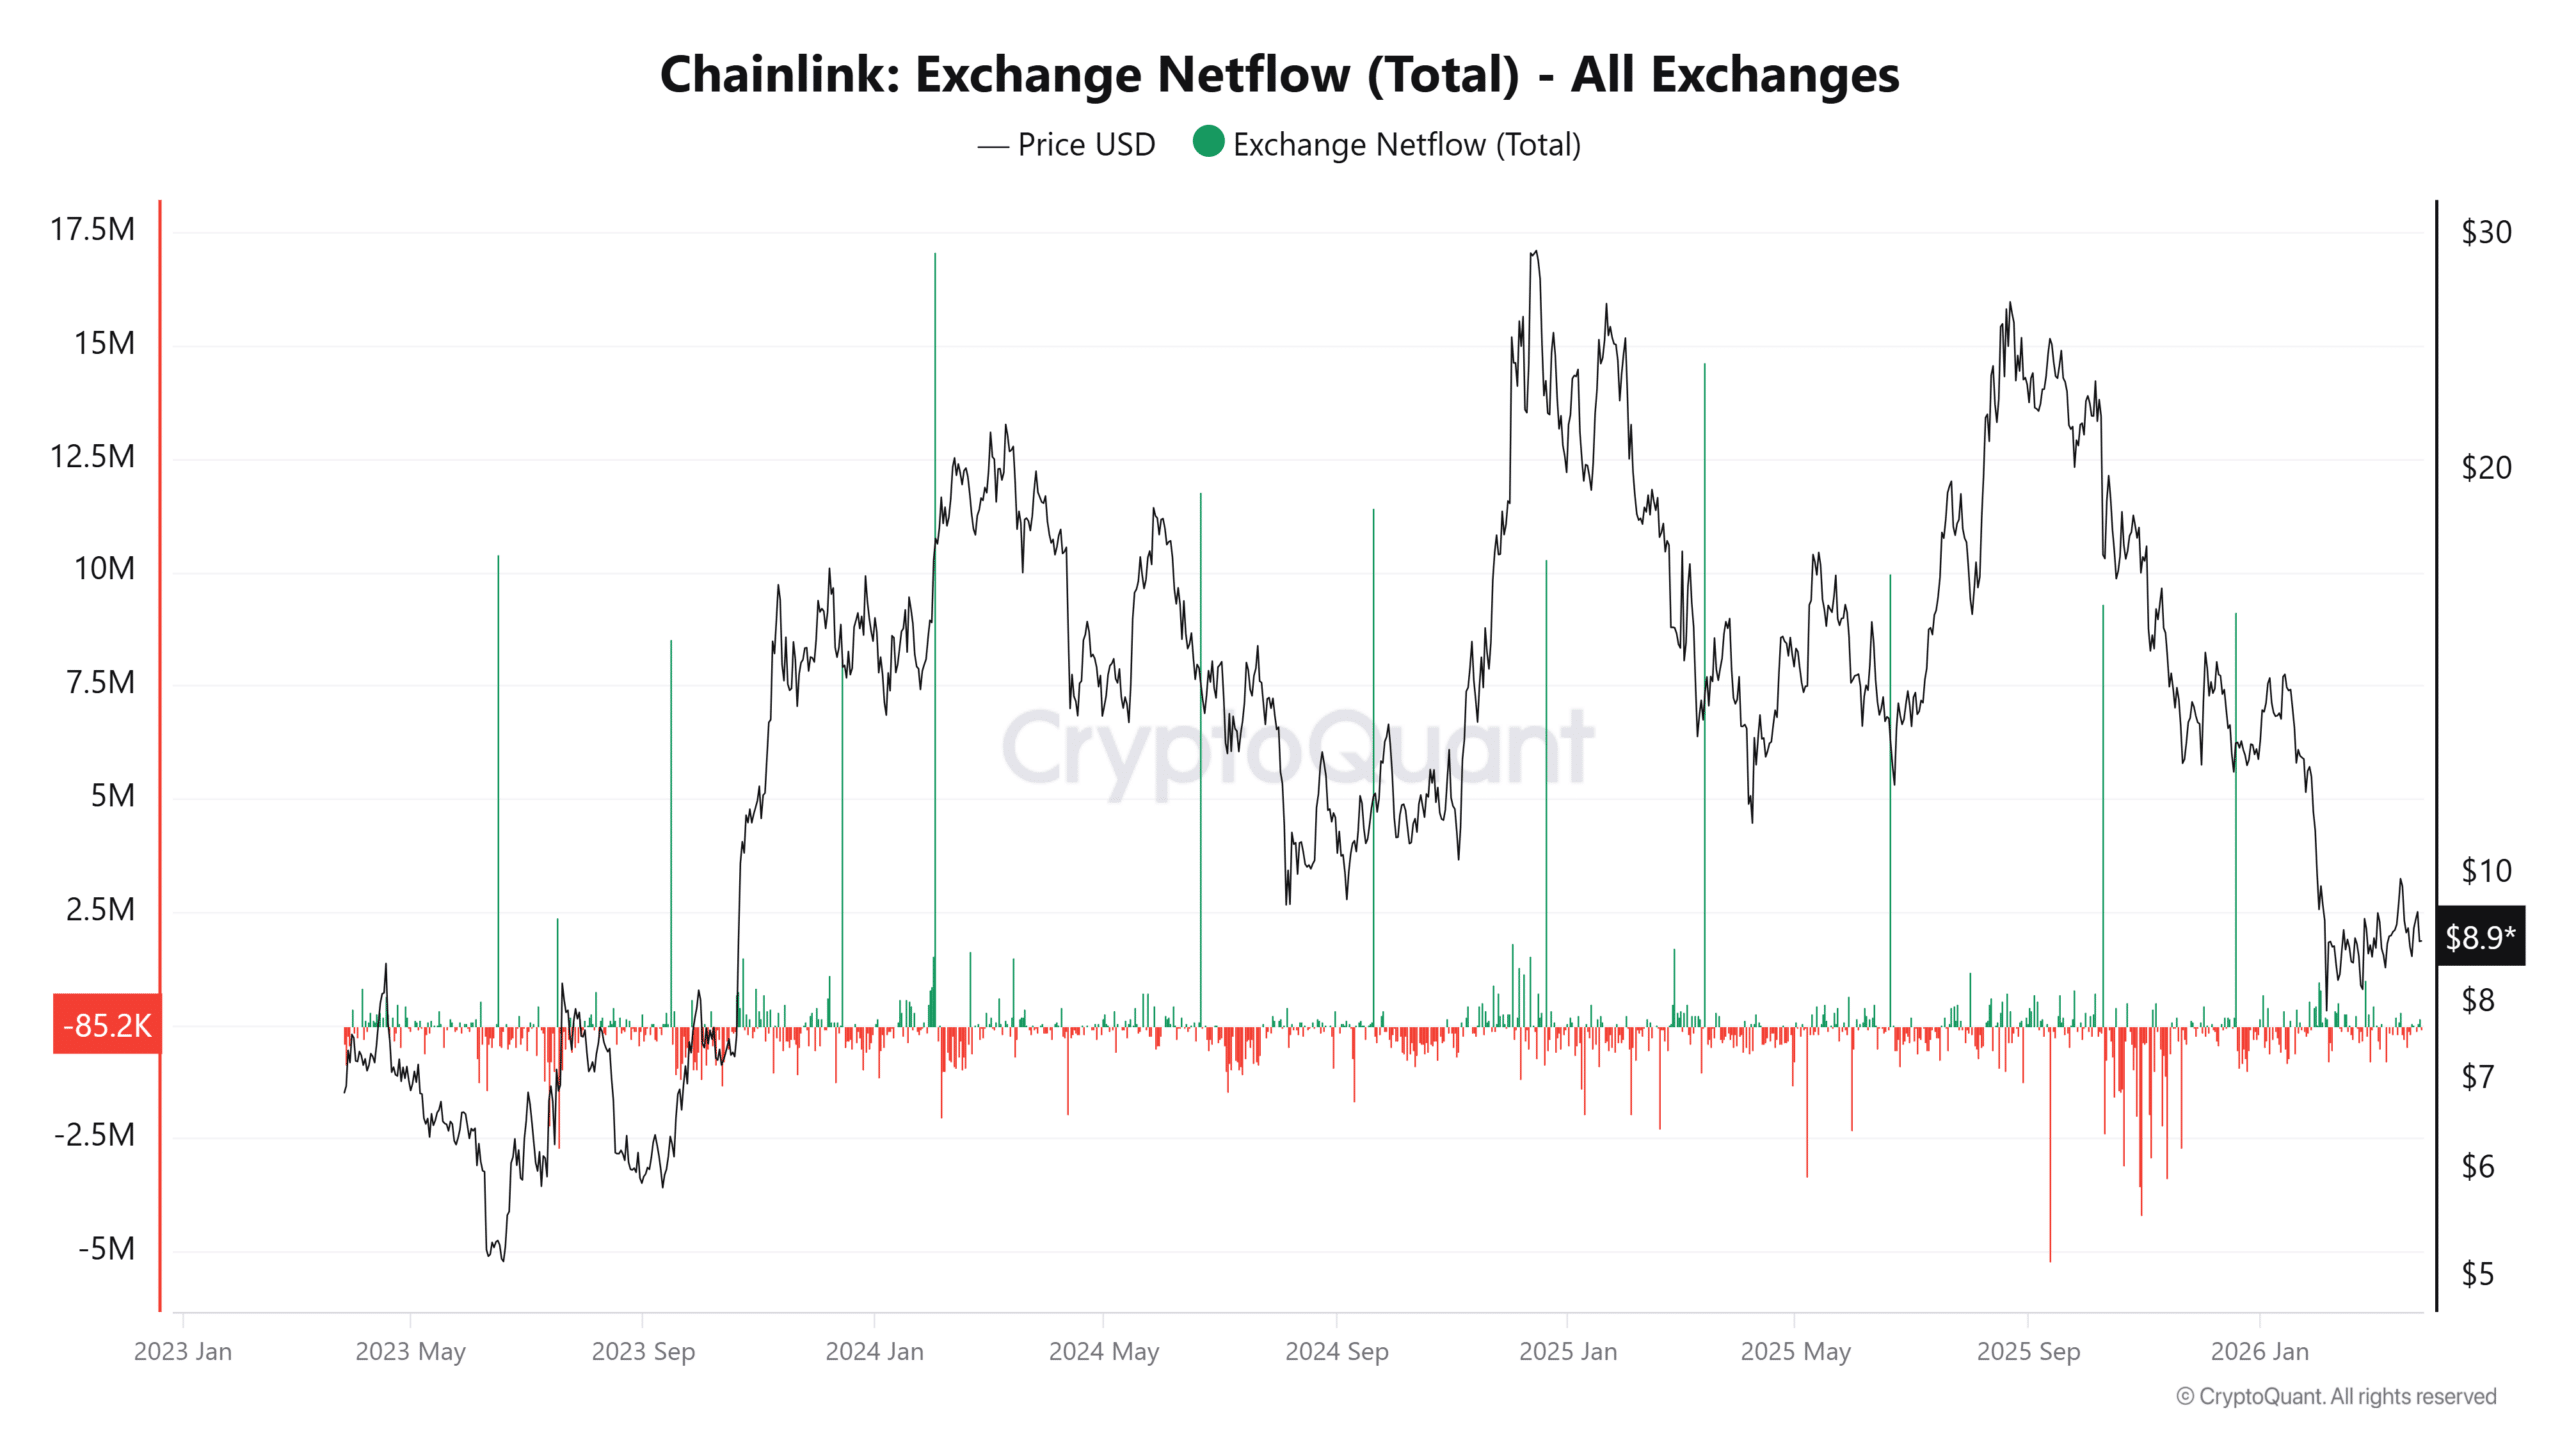
At press time, Exchange Netflows declined by 15.31%, signaling that fewer tokens are entering exchanges for potential selling. This shift reflects increasing outflows, which reduces immediate sell-side pressure across trading platforms.

As tokens move away from exchanges, available liquidity for quick distribution declines. However, price has not responded with upward expansion, which suggests that demand remains subdued. This creates a condition where supply tightens without triggering aggressive accumulation from buyers.

Still, reduced inflows limit the risk of sudden sell-offs, which may slow the pace of downside moves rather than reverse direction entirely.

Source: CryptoQuant

Chainlink long liquidations dominate as downside persists

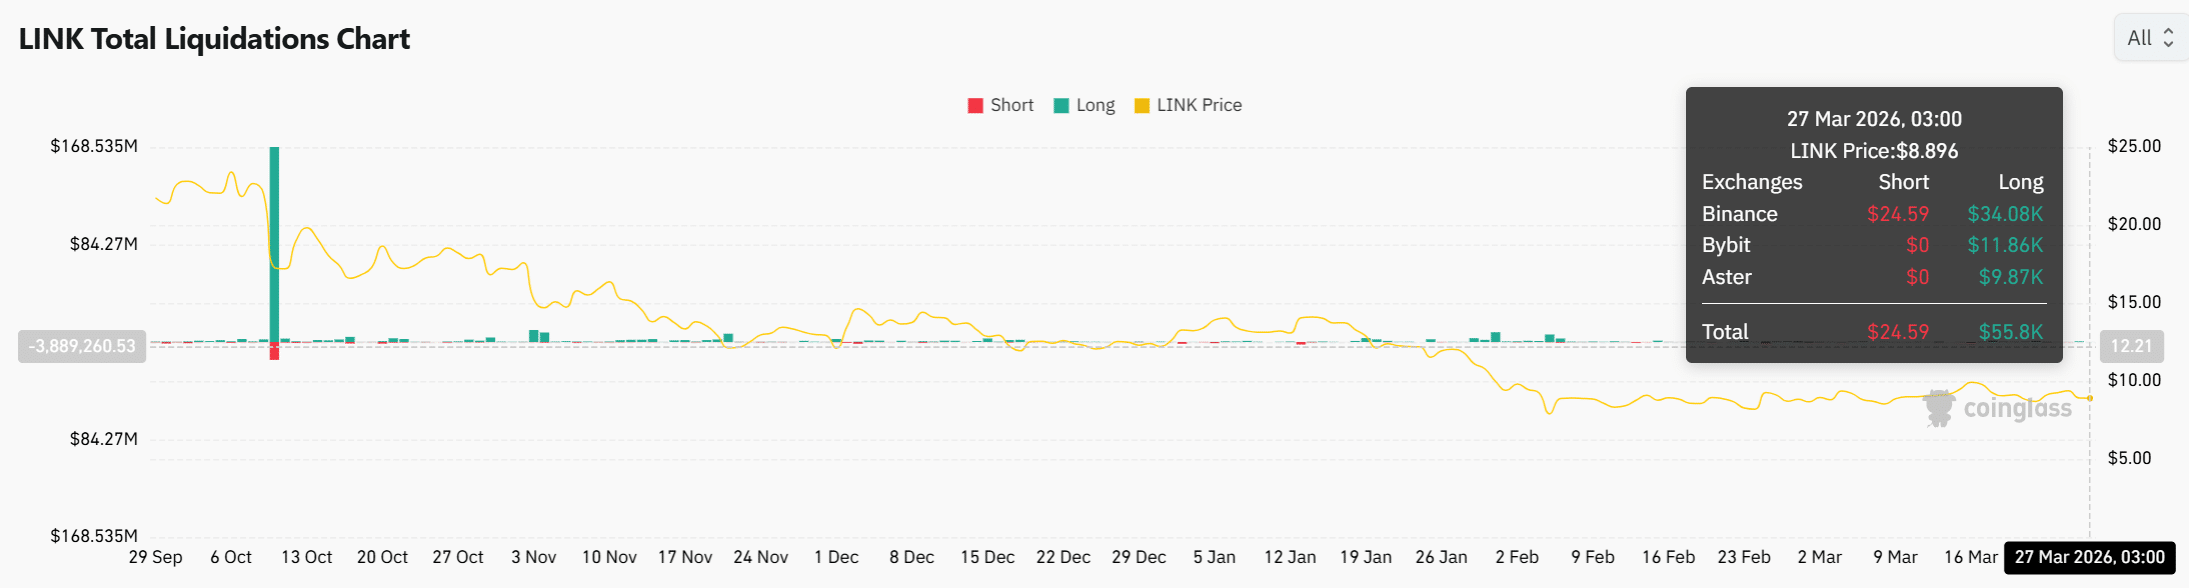
Liquidation data shows that long positions have faced greater pressure compared to shorts. Recent figures indicate $55.8K in long liquidations versus $24.59 in short liquidations. This imbalance confirms that bullish traders continue exiting positions under pressure.

As long positions get cleared, downside continuation becomes easier since fewer leveraged buyers remain to support price.

Additionally, the lack of significant short liquidations shows that sellers have not faced forced exits, which limits the chances of a short squeeze. This positioning structure reinforces the broader bearish outlook, as market dynamics continue to favor downside over recovery.

Source: CoinGlass

Chainlink’s accumulation and declining exchange supply suggest tightening fundamentals, yet price structure and derivatives positioning continue favoring downside.

As long as LINK remains below $10 and long liquidations dominate, the market leans bearish, with a potential move toward $5.77 remaining structurally supported unless buyers reclaim control.


Final Summary

  • Accumulation continues building in the background, yet price structure still reflects seller dominance and unresolved downside pressure.
  • Unless buyers reclaim control above resistance, current positioning would continue favoring downside expansion toward lower support zones.

Perguntas relacionadas

QWhy hasn't the price of LINK reacted strongly despite the increase in Chainlink's reserves and reduction in circulating supply?

AThe price has not reacted with strength because demand has not matched the tightening supply yet. The market continues absorbing supply changes without triggering upward expansion, indicating subdued buyer interest.

QWhat technical pattern is LINK currently forming, and what does it suggest about its price direction?

ALINK is forming a bearish pennant structure, which suggests a continuation of the downtrend rather than a reversal. A breakdown from this formation could expose the next downside target at $5.77.

QHow have exchange netflows changed, and what does this indicate for selling pressure?

AExchange Netflows declined by 15.31%, signaling fewer tokens entering exchanges for potential selling. This reduces immediate sell-side pressure but hasn't triggered upward price movement due to lack of demand.

QWhat does the liquidation data reveal about market positioning for LINK?

ALiquidation data shows long positions faced greater pressure with $55.8K in long liquidations versus $24.59K in short liquidations. This indicates bullish traders are exiting under pressure, favoring downside continuation.

QWhat key resistance level must buyers reclaim to shift the bearish market structure?

ABuyers need to reclaim control above the $10 resistance level to shift the bearish outlook. Until then, the market leans bearish with potential downside toward $5.77.

Leituras Relacionadas

ZEC Co-Founder Responds to Orchard Vulnerability: No Signs of Theft, Orchard Pool to Be Sealed

ZEC Co-Founder Addresses Orchard Vulnerability: No Signs of Theft, Plans to Sunset Orchard Pool A security vulnerability was recently discovered in Zcash's Orchard shielded pool, raising key concerns. The primary questions are whether the flaw was exploited, if user funds are safe, whether users can verify the total ZEC supply, and if other similar vulnerabilities exist. Analysis suggests the vulnerability was likely not exploited prior to its discovery. It was found proactively by a researcher using specialized tools, not due to an active breach. The development team and mining pools acted quickly to contain the issue. Typical financially-motivated attacks would likely have left visible on-chain evidence, which has not been observed. User funds in Orchard are considered safe and should be recoverable, assuming no prior exploitation. If the flaw was never used, all legitimate funds can be withdrawn. The article outlines risks associated with moving funds to transparent addresses or other pools, but concludes that leaving assets in place is a reasonable option. Currently, users cannot independently verify that the total ZEC supply hasn't been inflated due to this bug. However, the planned Ironwood network upgrade is designed to resolve this. It will permanently close the Orchard pool to new deposits and internal transfers, allowing only withdrawals. This mechanism will cap total withdrawals at the amount of legitimately deposited funds, enabling anyone to cryptographically verify the supply post-upgrade. Multiple teams, including Shielded Labs, have conducted extensive audits focused on counterfeiting vulnerabilities, assisted by advanced AI tools. No additional flaws of this type have been found so far, increasing confidence that no other similar undisclosed vulnerabilities exist. In summary, evidence indicates the Orchard bug was probably not used, user funds are secure, and no other counterfeiting flaws are currently known. The upcoming Ironwood upgrade will restore users' ability to independently verify the total ZEC supply, closing this chapter.

Foresight NewsHá 5m

ZEC Co-Founder Responds to Orchard Vulnerability: No Signs of Theft, Orchard Pool to Be Sealed

Foresight NewsHá 5m

Microsoft Announces Commercial-Grade Quantum Computer to be Completed in Three Years: Will the Boots Land?

Microsoft announces plans to build a commercially viable quantum computer by 2029, a significant acceleration from the previous industry consensus of a decade. The breakthrough is fueled by their new Majorana 2 quantum chip, which boasts a record-breaking average qubit lifetime of 20 seconds—a 1,000-fold reliability improvement over its predecessor. This leap was achieved by leveraging topological qubits, a theoretically more stable technology using Majorana zero modes, and switching the core superconducting material from aluminum to lead. Crucially, Microsoft's "Discovery" agentic AI platform accelerated the R&D process. AI agents autonomously analyzed vast experimental data, optimized manufacturing parameters (like the lead alloy composition), and solved issues like "ghost noise," dramatically speeding up experimentation. While the 20-second coherence time is a landmark, challenges remain: scaling from 12 qubits to the millions needed for practical applications, managing compilation costs, and verifying quantum results. Skeptics call for peer-reviewed data, and questions persist about whether even 20 seconds is sufficient for complex algorithms like breaking RSA encryption. The race is on with other approaches (superconducting, trapped ions), but Microsoft's confidence in its topological roadmap signals a potential shortcut to a scalable quantum future.

marsbitHá 24m

Microsoft Announces Commercial-Grade Quantum Computer to be Completed in Three Years: Will the Boots Land?

marsbitHá 24m

Is There Really a "World Cup Curse" in the Market?

Is there really a "World Cup Curse" affecting markets? Historical data shows global equity markets often underperform during the tournament. The S&P 500 has averaged negative returns of -1.5% to -2.11% across 19 World Cups since 1950, with declines in 58% of events. China's Shanghai Composite fell in 71% of tournaments since 1994. Studies confirm reduced trading activity during matches, with volumes dropping significantly, especially when a home nation plays. A team's loss can also lead to negative sentiment and selling pressure in its domestic market the next day. However, the "curse" may be partly attributed to seasonal weakness. Many tournaments are held in June-July, a historically weaker period for stocks ("Sell in May and go away"). The 2022 Qatar World Cup, held in November-December, saw a smaller drop in trading volume compared to summer events, suggesting timing plays a role. The cryptocurrency market's performance during World Cups has been mixed and largely driven by its own major catalysts (e.g., Mt. Gox hack, FTX collapse, halving cycles) rather than the tournament. Investment opportunities have shifted over time. Traditional beneficiaries like TV manufacturers have seen fading returns as streaming platforms become the core viewing channel. Classic consumer plays like beer and sportswear face challenges from changing consumption trends. Newer digital assets, like fractionalized collectible player cards on blockchain, have seen explosive growth. While gambling is a traditional sector, prediction markets are emerging. In conclusion, while a statistical correlation exists, the World Cup's direct impact on markets is likely limited and intertwined with seasonal patterns. With lower liquidity during the event, the simplest strategy for many might be to step back from trading and enjoy the games.

marsbitHá 31m

Is There Really a "World Cup Curse" in the Market?

marsbitHá 31m

Trading

Spot
Futuros

Artigos em Destaque

Como comprar LINK

Bem-vindo à HTX.com!Tornámos a compra de ChainLink (LINK) simples e conveniente.Segue o nosso guia passo a passo para iniciar a tua jornada no mundo das criptos.Passo 1: cria a tua conta HTXUtiliza o teu e-mail ou número de telefone para te inscreveres numa conta gratuita na HTX.Desfruta de um processo de inscrição sem complicações e desbloqueia todas as funcionalidades.Obter a minha contaPasso 2: vai para Comprar Cripto e escolhe o teu método de pagamentoCartão de crédito/débito: usa o teu visa ou mastercard para comprar ChainLink (LINK) instantaneamente.Saldo: usa os fundos da tua conta HTX para transacionar sem problemas.Terceiros: adicionamos métodos de pagamento populares, como Google Pay e Apple Pay, para aumentar a conveniência.P2P: transaciona diretamente com outros utilizadores na HTX.Mercado de balcão (OTC): oferecemos serviços personalizados e taxas de câmbio competitivas para os traders.Passo 3: armazena teu ChainLink (LINK)Depois de comprar o teu ChainLink (LINK), armazena-o na tua conta HTX.Alternativamente, podes enviá-lo para outro lugar através de transferência blockchain ou usá-lo para transacionar outras criptomoedas.Passo 4: transaciona ChainLink (LINK)Transaciona facilmente ChainLink (LINK) no mercado à vista da HTX.Acede simplesmente à tua conta, seleciona o teu par de trading, executa as tuas transações e monitoriza em tempo real.Oferecemos uma experiência de fácil utilização tanto para principiantes como para traders experientes.

895 Visualizações TotaisPublicado em {updateTime}Atualizado em 2026.06.02

Como comprar LINK

Discussões

Bem-vindo à Comunidade HTX. Aqui, pode manter-se informado sobre os mais recentes desenvolvimentos da plataforma e obter acesso a análises profissionais de mercado. As opiniões dos utilizadores sobre o preço de LINK (LINK) são apresentadas abaixo.

活动图片