Chainlink demand surges as withdrawals reach 2 mln LINK: Will this boost price?

ambcryptoPublicado em 2026-03-25Última atualização em 2026-03-25

Resumo

Chainlink (LINK) is experiencing a surge in investor demand, with over 2.046 million tokens withdrawn from exchange reserves in the past month, signaling potential accumulation and a bullish sentiment. Despite a modest monthly gain of 3.75%, LINK saw a 7.15% price increase in 24 hours, trading at $9.20, accompanied by a 65% surge in trading volume to $952.83 million. Analytics data indicates long-term holder interest, with exchange reserves dropping significantly. Derivatives data shows traders favoring long positions, with bulls dominating. Technically, LINK is moving within an ascending channel pattern. After a recent dip to the lower boundary, a bullish engulfing candle suggests a potential reversal. If LINK holds above $8.576, a 10% rise to $10.08 is possible, with further upside toward $11.20 if key resistance is broken. The RSI at 52.03 indicates growing buying interest and a shift toward bullish territory.

Demand for Chainlink [LINK] among investors is rising significantly, even though its price remains stagnant.

Crypto tracker CoinMarketCap showed that LINK gained a modest 3.75% over the past month, with the asset fluctuating within a range, reaching a high of $10 and a low of $8.17 during this period.

As the broader market exhibited signs of recovery, LINK jumped 7.15% over the past 24 hours, trading at the $9.20 level at press time.

Along with the price increase, market participation has also risen, as reflected in trading volume, which has surged by over 65% to $952.83 million.

This rise in trading volume not only indicates higher market activity but also suggests that investors and traders are showing strong interest in the current trend.

Analytics and derivatives data signal bullish sentiment

Analytics tool CryptoQuant shows that long-term investors are highly interested in LINK.

According to the latest data, over 2.046 million LINK tokens have been withdrawn from exchange reserves over the past month, as reflected in a significant decline from 129.427 million on the 24th of February to 127.381 million on the 24th of March 2026.

Whereas, in the past week, a massive drop of 951,000 LINK has been recorded in exchange reserves, indicating that LINK is in high demand among holders.
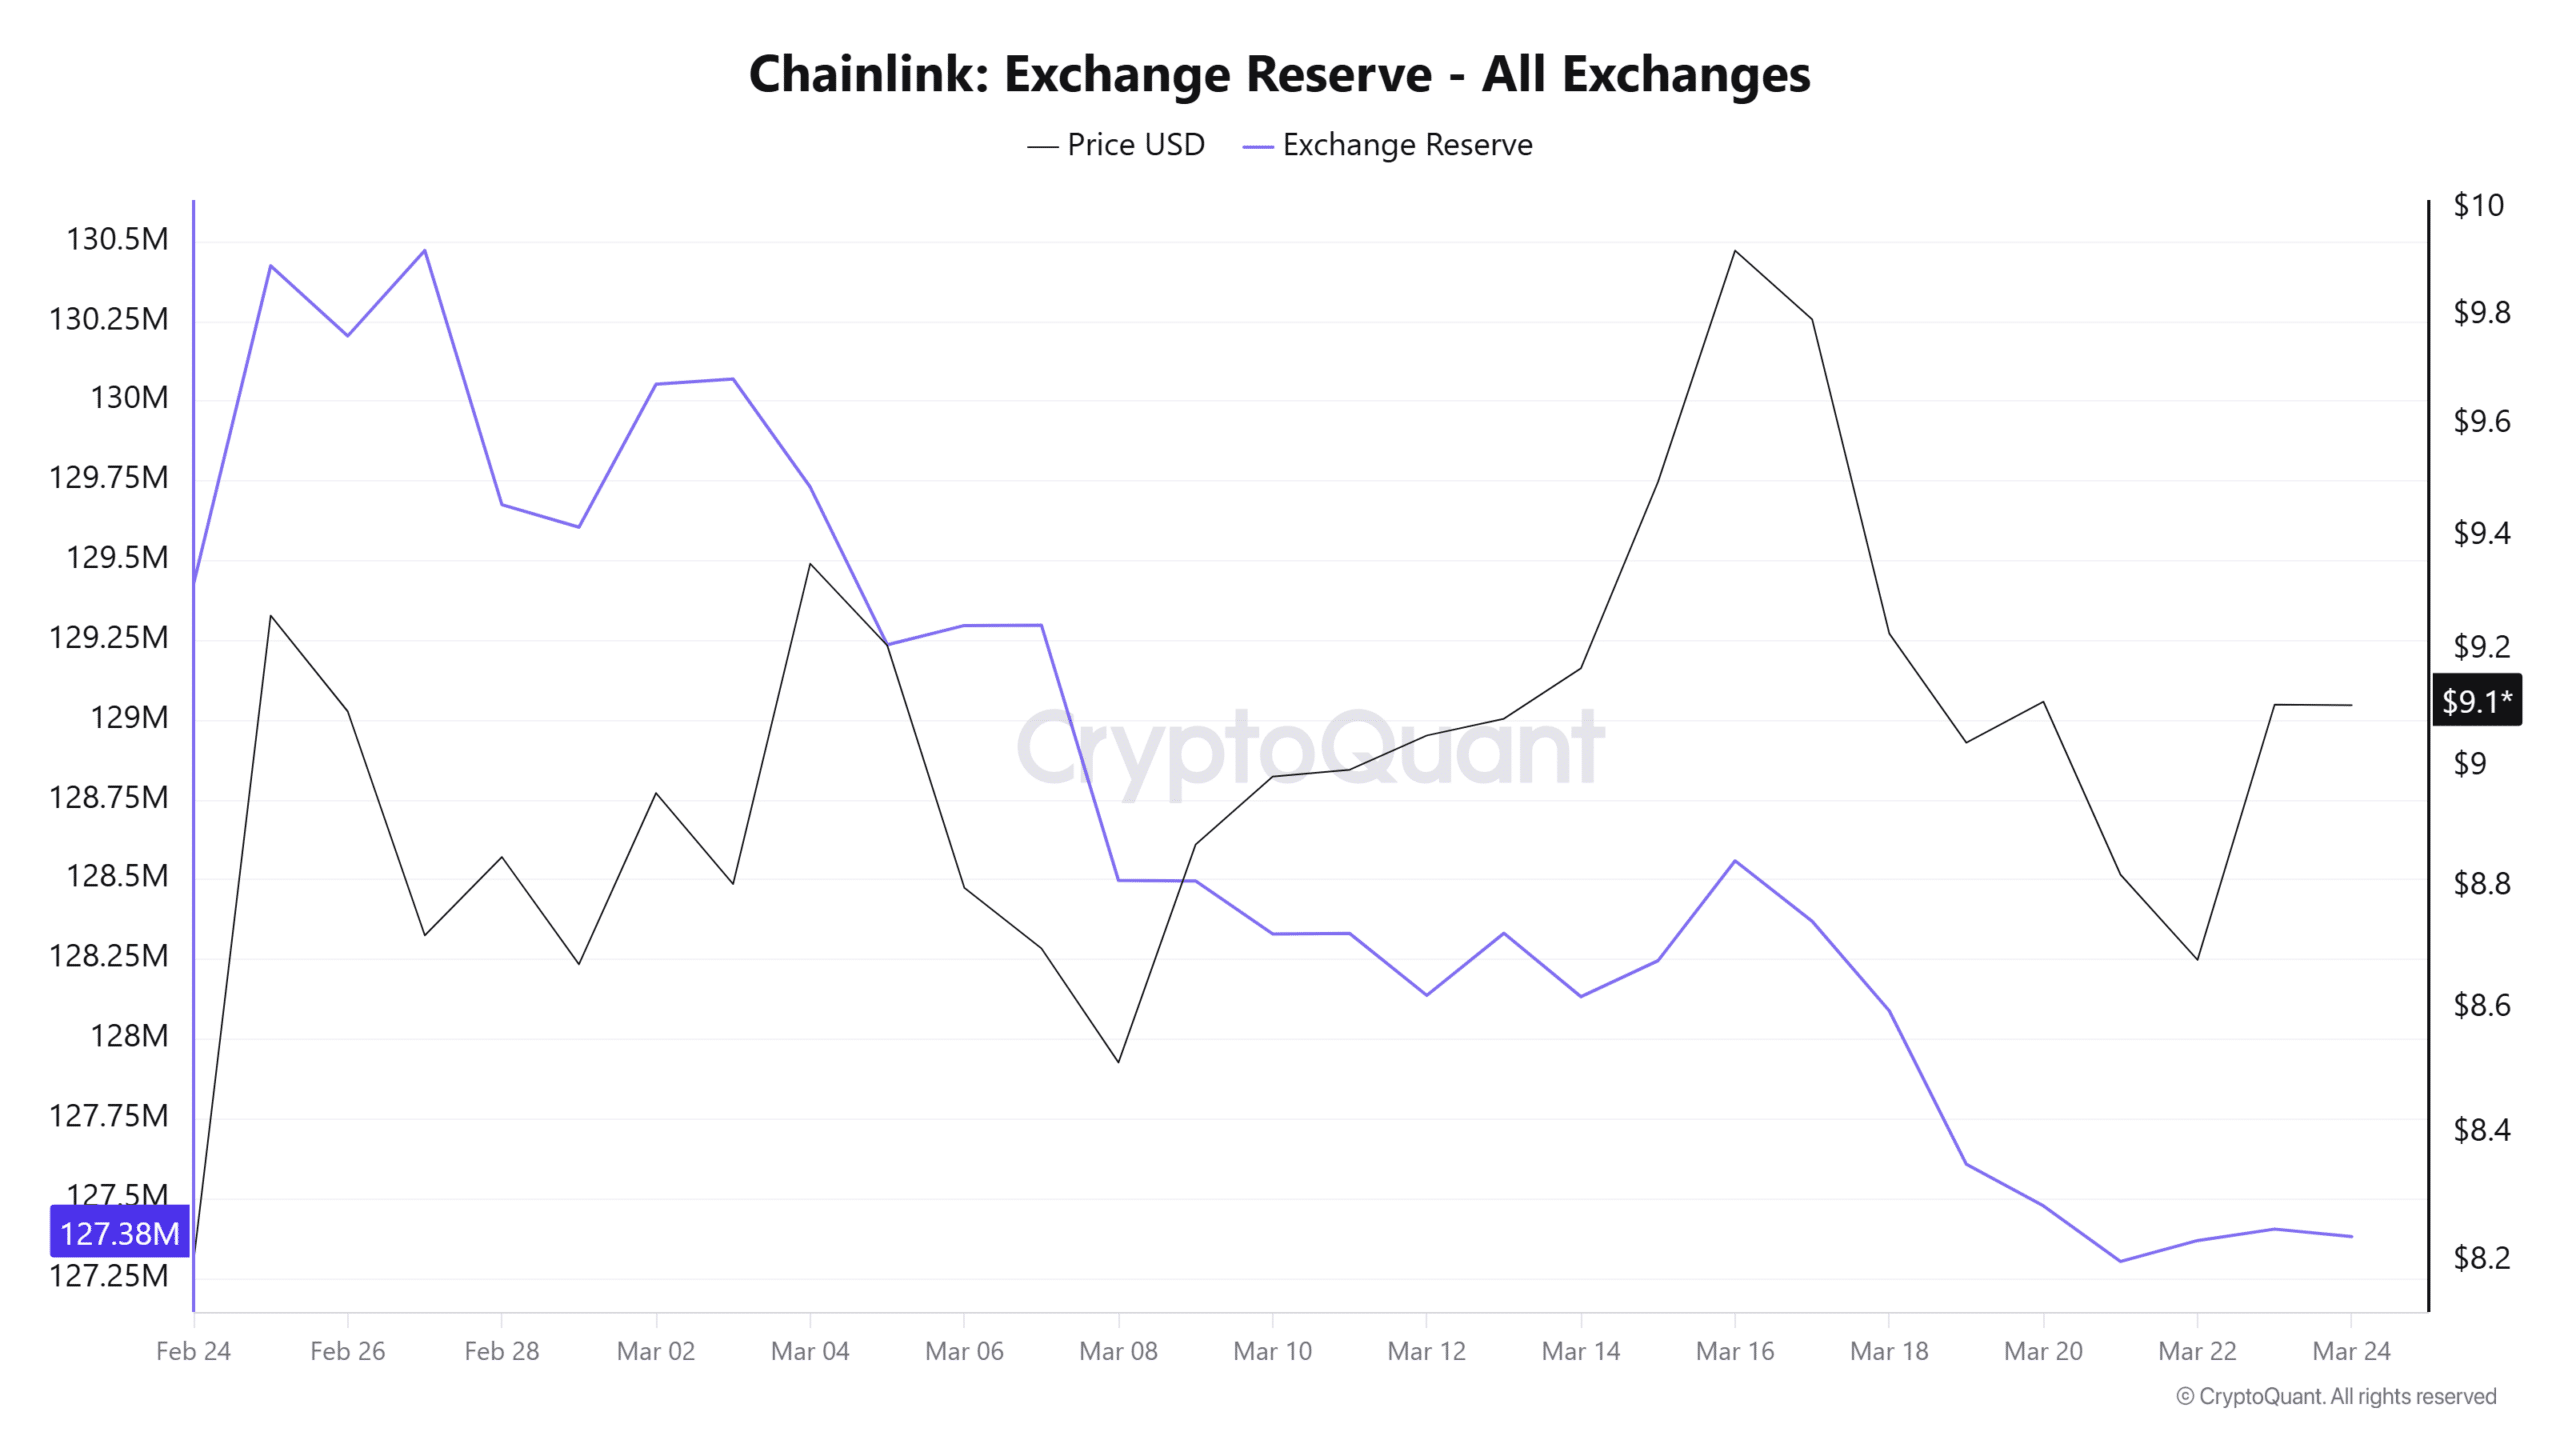
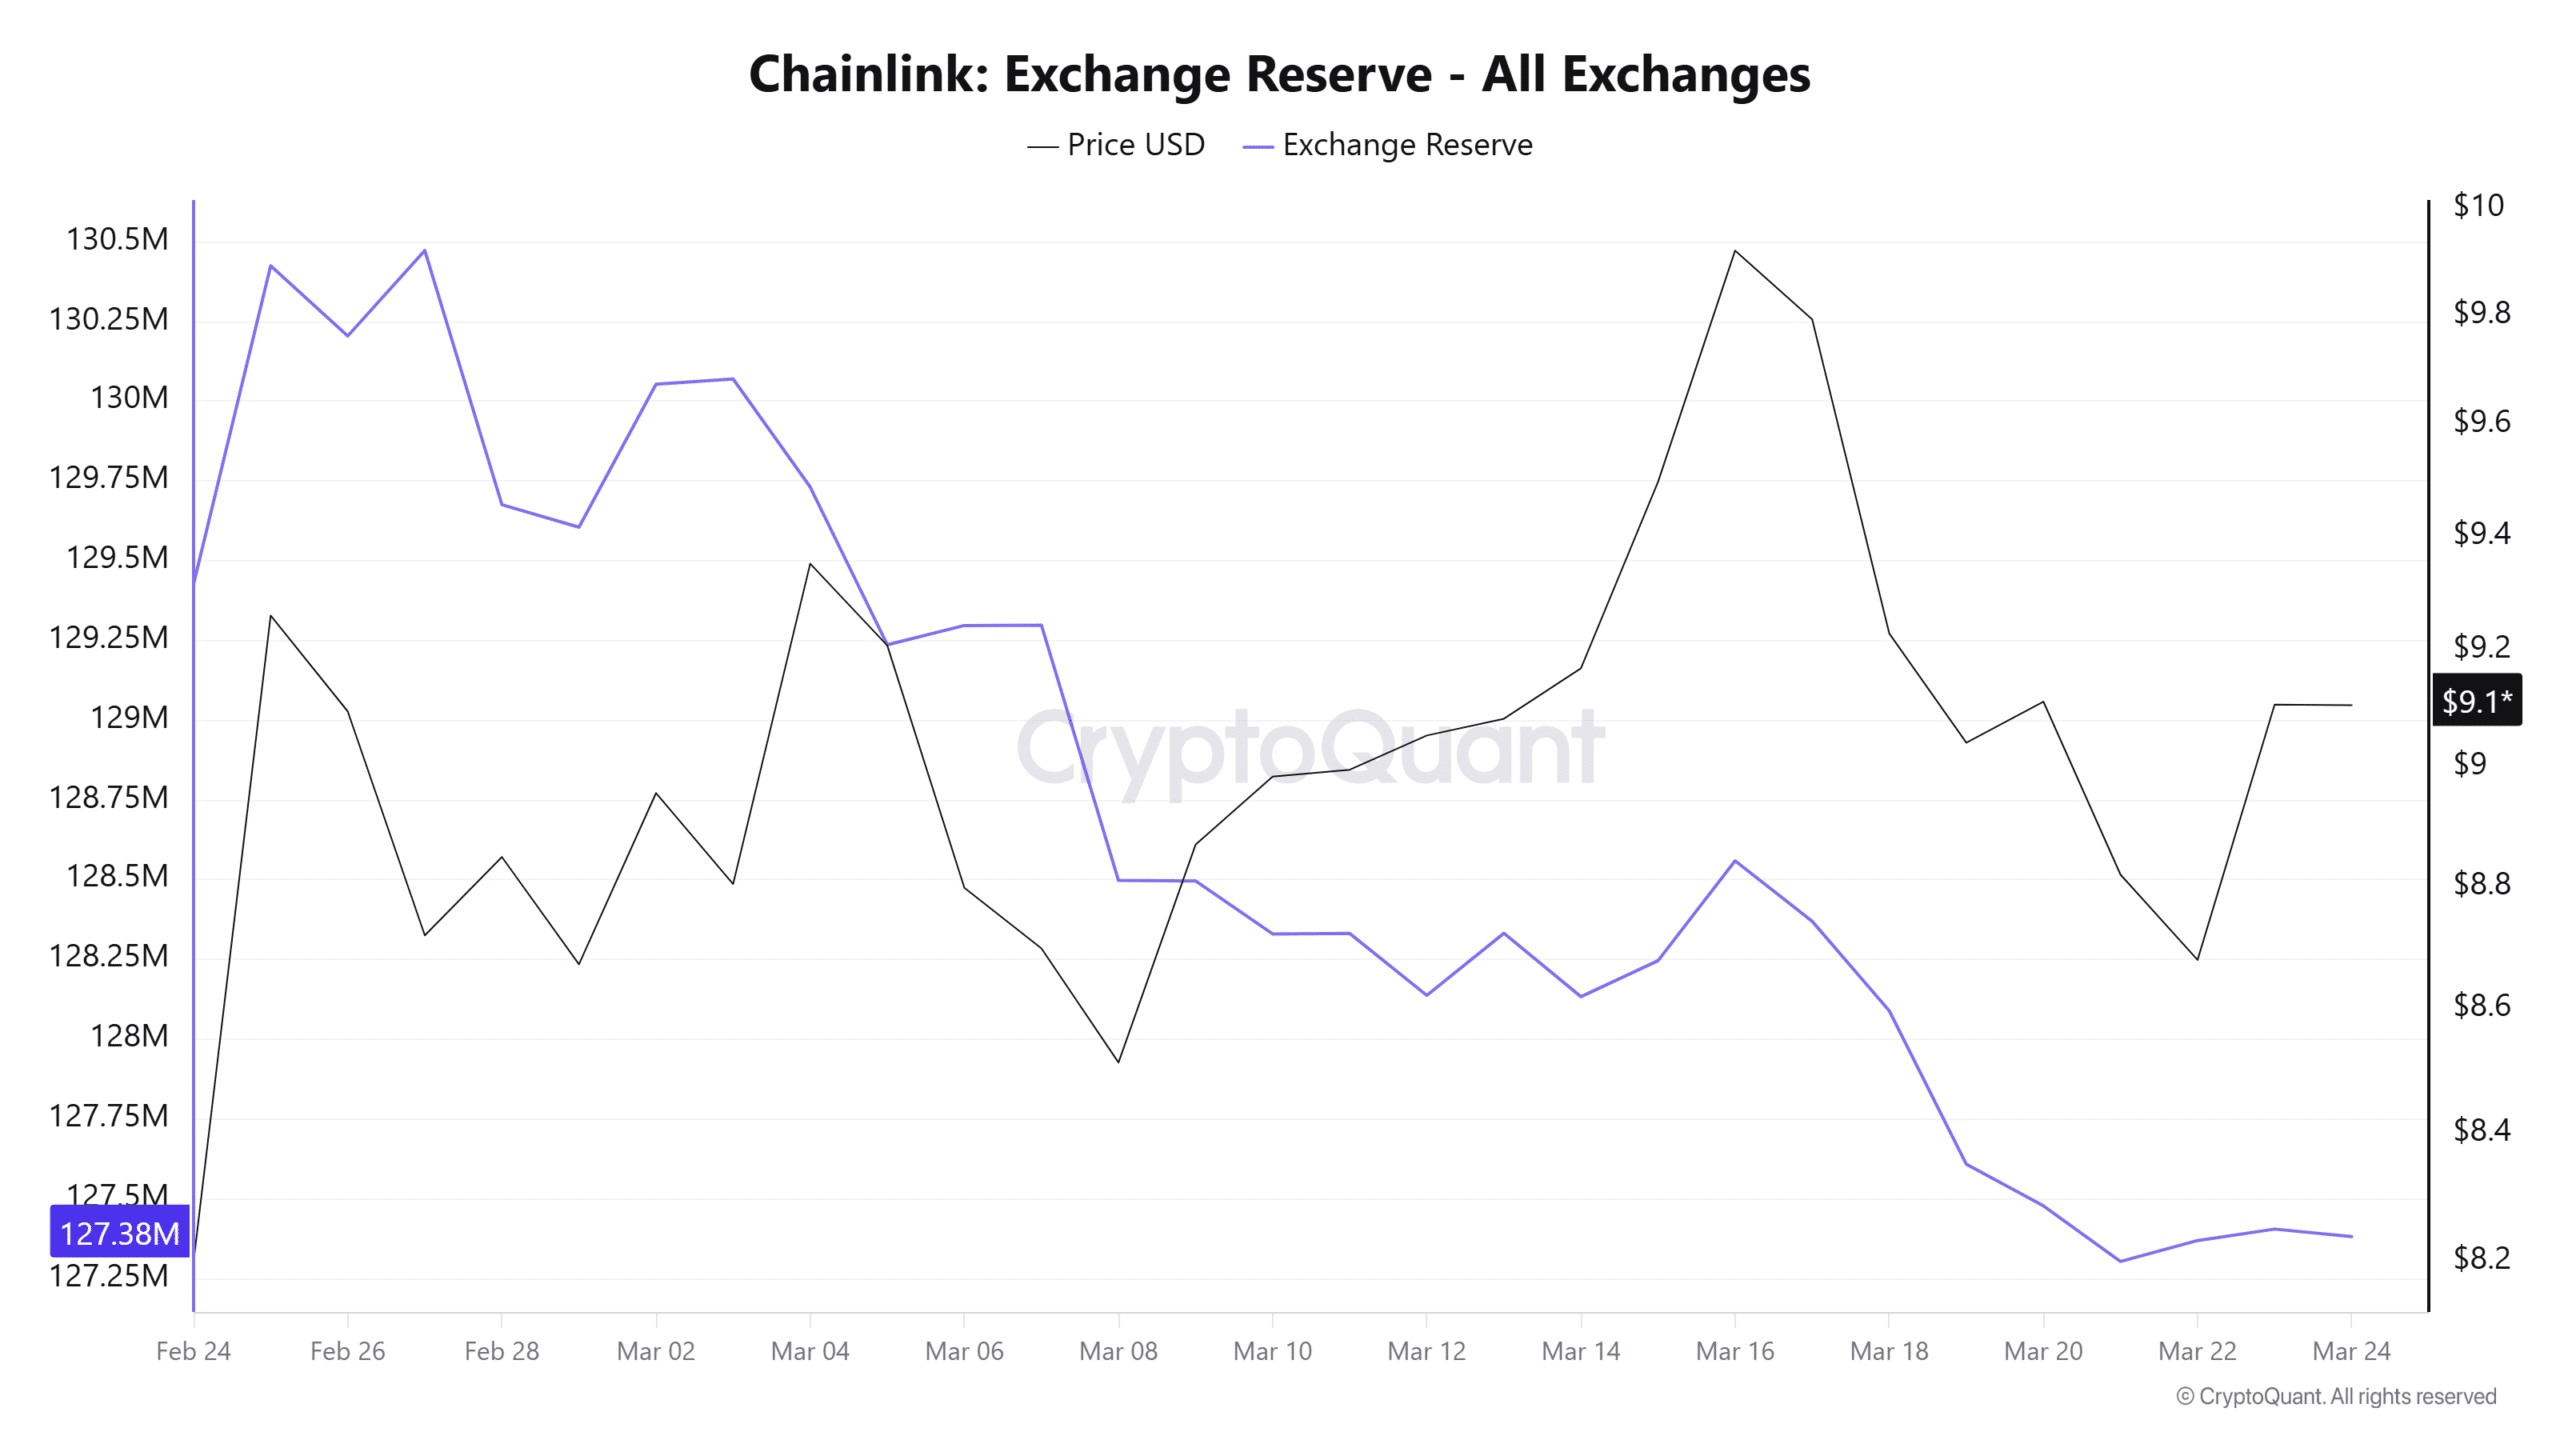
Source: CryptoQuant

Falling exchange reserves of any asset typically suggest potential accumulation, as holders tend to move assets from exchanges to their wallets, which is generally considered a bullish signal.

However, this potential accumulation over the past month and in recent weeks also raises questions about whether the current level is an ideal buying zone or not.

According to the derivatives analytics tool CoinGlass, intraday traders are currently following the trend, as they are eyeing long-leveraged positions. As per the data, $8.88 on the lower side and $9.27 on the upper side are the major liquidation levels from the current price.

Traders at these levels have built $4.08 million worth of long-leveraged positions and $2.10 million in short-leveraged positions, indicating that bulls are dominating the asset, while short sellers appear to be losing interest.
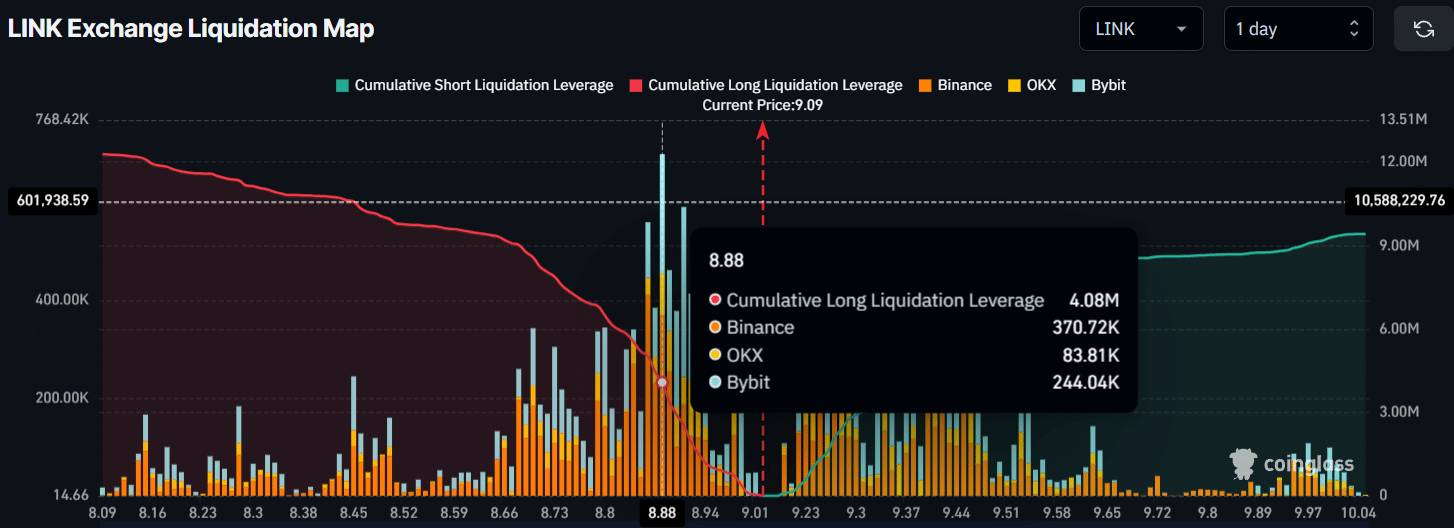
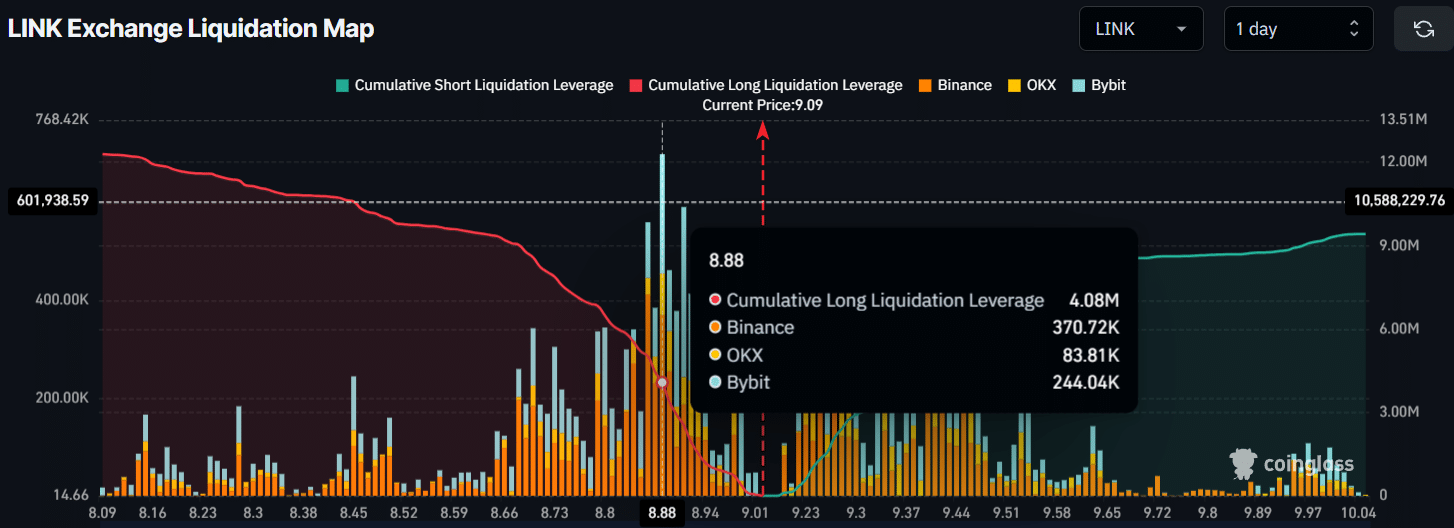
Source: CoinGlass

LINK: Price action eyes 10% jump

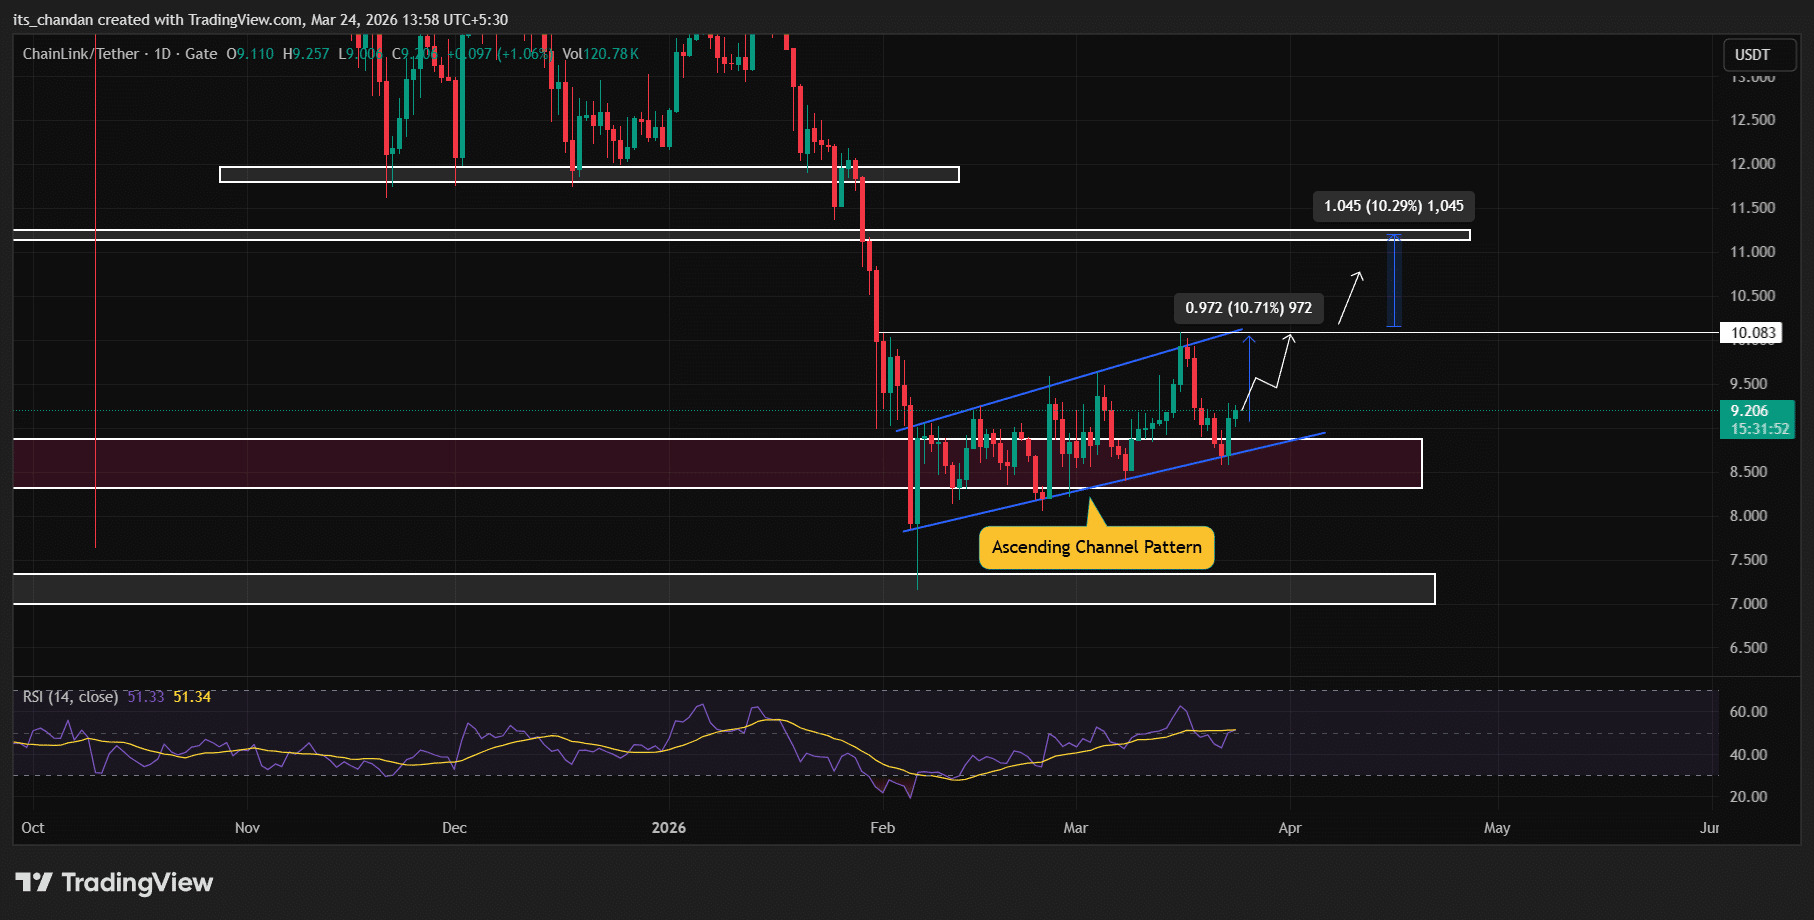
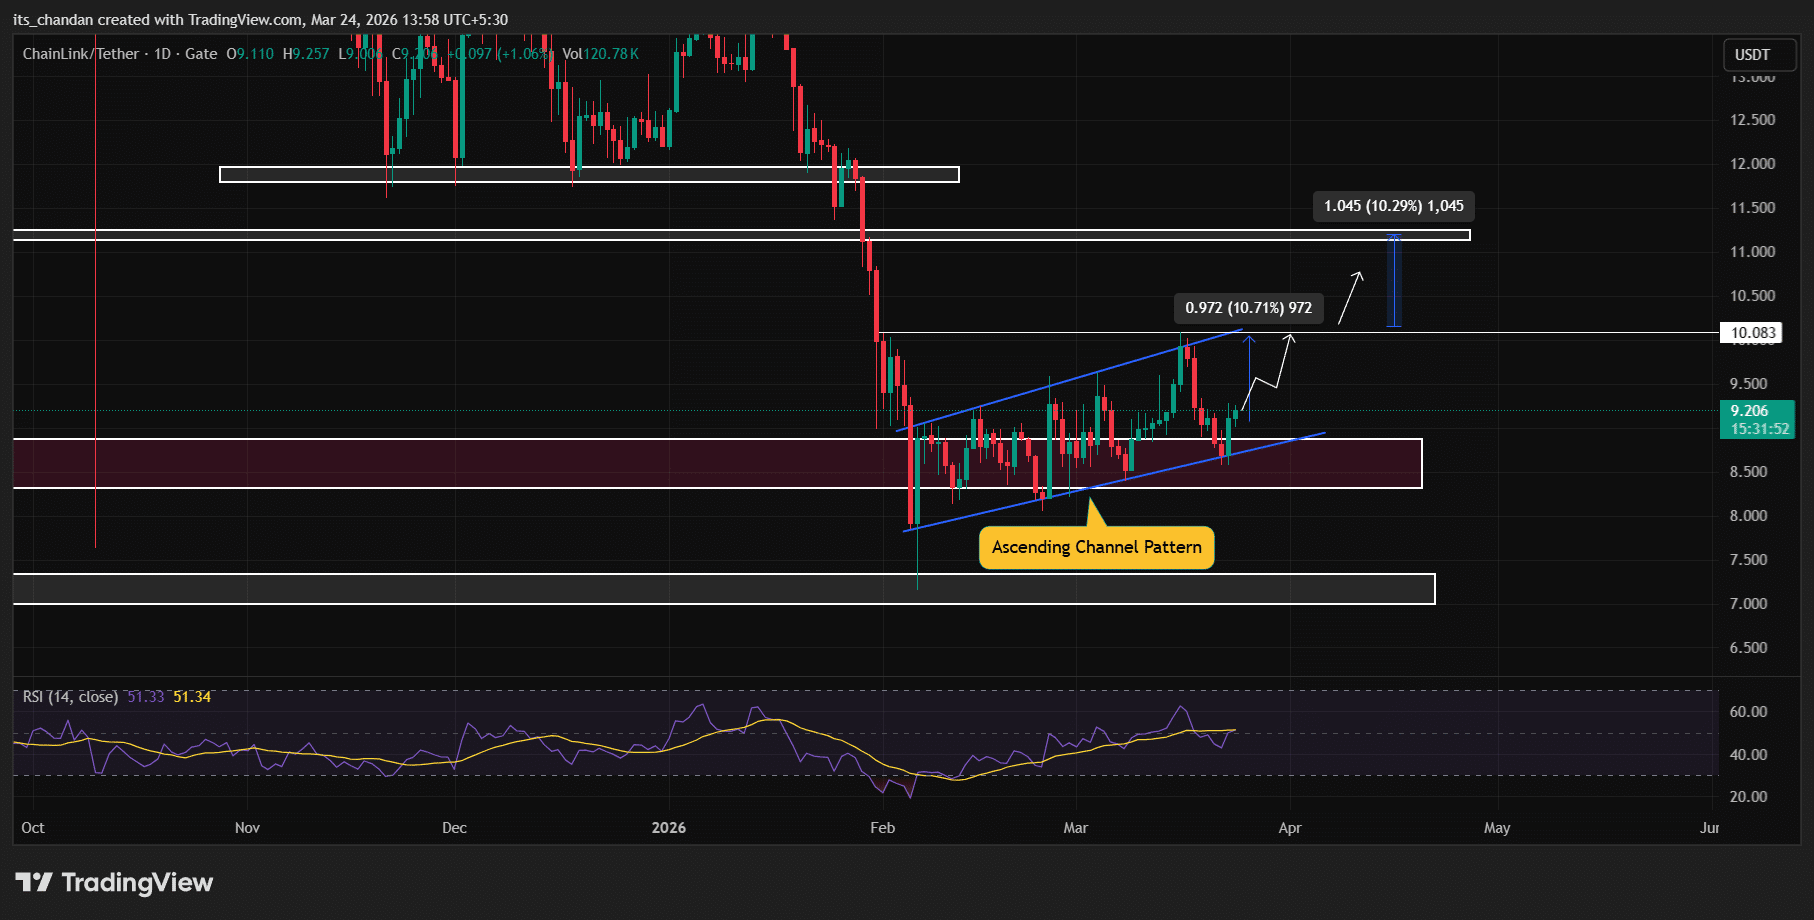
On the daily chart, LINK appeared to be moving within an ascending channel pattern between the upper and lower boundaries.

Following a recent dip of 14.65% between the 16th and the 23rd of March, the price declined to the lower boundary, where it formed a bullish engulfing candle, suggesting that LINK may be on the verge of a reversal in the coming days.
Source: TradingView

Based on the current price action, if LINK remains above the upper boundary and the $8.576 level (the low of the engulfing candle), it could see a price jump of 10% and potentially reach the $10.08 level.

Further upside is also possible; however, $10.08 has been a key resistance level since the 1st of February. If LINK clears this level, another 10% rally could occur, potentially pushing the price toward $11.20.

As of now, Chainlink appears to be recovering as the Relative Strength Index (RSI) on the daily chart reaches 52.03, indicating a shift toward bullish territory and growing buying interest, with the asset gaining strength above the neutral 50 level.


Final Summary

  • Exchange reserves have declined by 2.046 million tokens over the past 30 days, indicating strong demand.
  • The daily chart shows that LINK is moving in an ascending channel pattern. After testing the lower boundary, it may see another 10% price jump in the coming days.


Criptomoedas em alta

Perguntas relacionadas

QWhat is the main reason for the surge in Chainlink (LINK) demand according to the article?

AThe main reason for the surge in Chainlink (LINK) demand is the significant withdrawal of tokens from exchange reserves, with over 2.046 million LINK tokens being removed over the past month, indicating strong accumulation by long-term investors.

QHow much did LINK's trading volume increase by, and what does this suggest?

ALINK's trading volume surged by over 65% to $952.83 million. This increase suggests higher market activity and indicates that investors and traders are showing strong interest in the current trend.

QWhat does the formation of a bullish engulfing candle on the daily chart indicate for LINK's price?

AThe formation of a bullish engulfing candle on the daily chart, after the price declined to the lower boundary of its ascending channel, suggests that LINK may be on the verge of a reversal and a potential price jump in the coming days.

QWhat are the key price levels that traders are watching for potential liquidation, according to CoinGlass data?

AAccording to CoinGlass data, the key liquidation levels from the current price are $8.88 on the lower side and $9.27 on the upper side.

QWhat is the potential price target for LINK if it breaks above the key resistance level of $10.08?

AIf LINK breaks above the key resistance level of $10.08, it could see another 10% rally, potentially pushing the price toward $11.20.

Leituras Relacionadas

Analyzing the Impact of AI on Economic Growth and Productivity

**Title: Analyzing AI's Impact on Economic Growth and Productivity** This article examines three contrasting views on AI's influence on economic growth and productivity. **The Optimistic View** posits that AI, especially through automating R&D ("recursive self-improvement"), could dramatically accelerate growth, even triggering a technological "singularity" with explosive, potentially infinite, economic expansion. **The Moderate/Mainstream View** acknowledges AI's productivity benefits but emphasizes significant real-world constraints that could limit its impact. These include: limited cost savings per task, structural ceilings on which jobs and industries are "exposed" to AI, adoption bottlenecks (e.g., compute, energy, regulatory hurdles), and the "weak link" effect where non-automatable tasks cap overall gains. Consequently, the realized AI dividend may be far lower than optimistic projections, with estimates typically ranging from 0.1% to 1.3% annual productivity growth. **The Pessimistic View** stems from two strands. The first aligns with the moderate view but applies extremely conservative assumptions about task exposure and efficiency gains, yielding minimal projected impact. The second introduces a demand-side critique: if AI primarily replaces rather than augments labor, it could depress labor's share of income, weaken consumer demand, and create a "demand trap" that ultimately stifles growth, unless offset by redistribution policies. **The authors' assessment** is nuanced: * **Short-term (1-2 years):** AI will support growth primarily through investment spending, not significant productivity gains. * **Medium-term (3-5 years):** Three potential paths emerge based on AI demand and bottleneck severity: 1. **"Optimistic Path":** High demand, few bottlenecks. Rapid productivity gains but risk of major job displacement and social conflict without redistribution. 2. **"Moderate Path" (most likely):** High demand but significant, surmountable bottlenecks. Leads to moderate productivity gains, financial market volatility (K-shaped returns), and sectoral job losses. 3. **"Pessimistic Path":** Low demand or severe bottlenecks. Minimal productivity and growth impact, triggering financial market corrections but allowing a smoother societal transition with less labor disruption. * **Long-term:** AI holds potential for a major productivity revolution and prosperity. The conclusion stresses that no path is smooth. Technologically "optimistic" outcomes could be socially detrimental, while "pessimistic" technological diffusion might be more socially stable. Policymakers must monitor developments and prepare balanced responses to manage economic, financial, and social sustainability.

marsbitHá 22m

Analyzing the Impact of AI on Economic Growth and Productivity

marsbitHá 22m

The New Cold War is a Tech Stock War

The New Cold War is a Tech Stock War The article argues that the contemporary geopolitical and economic rivalry between the US and China represents a "New Cold War," but one fundamentally fought through technology and financial markets, not physical barriers or conventional trade. Historically, US dominance was secured through financial systems. The Soviet Union, reliant on the rigid "Transferable Ruble," was ultimately undermined by its dependency on the US dollar for oil trade. Later, Japan's semiconductor challenge was countered not just by tariffs (e.g., Plaza Accord, 301 investigations) but by binding it to US Treasury bonds. China presents a more complex, "embedded" challenger. While it holds vast dollar reserves and US debt like Japan, its industrial base is stronger and more diversified than the Soviet Union's. Surviving the initial 2018 trade war phase, the conflict has evolved into a "tech-financial war." The core battlefield is now the stock market. US tech stocks (AI, semiconductors) are treated as sovereign assets, buoyed by bipartisan national will. China is pushing to strengthen its own financial markets to convert industrial strength into financial power and fund its tech ambitions. Companies like ChangXin (semiconductors), Moonshot AI, and DJI compete not just for market share but as financial proxies for their respective systems. The new paradigm is moving from globally efficient monopolies (Apple, Google) towards companies that achieve monopolistic profits within their respective geopolitical spheres. This competition over "pricing power" and financial valuation in segmented markets defines the current era, making the stock market the primary arena for this tech-centric struggle.

marsbitHá 31m

The New Cold War is a Tech Stock War

marsbitHá 31m

RWA Weekly: Ten European Financial Institutions Establish Tokenized Asset Cooperative; Ondo Launches New Execution Network Ondo Network

RWA Weekly: European Banks Form Tokenized Asset Cooperative; Ondo Launches New Execution Network Ondo Network Covering July 24-31, 2026, the RWA sector saw a steady on-chain total value locked (TVL) of $36.8 billion, with holder count hitting a record high. However, stablecoin transfer volumes fell sharply (~30%), indicating low on-chain settlement demand. Key regulatory moves include South Korea advancing stablecoin legislation and a push to scrap crypto taxes, Kenya lowering capital requirements for stablecoin issuers, and Zimbabwe approving seven projects for its crypto sandbox. In project developments, BIS-led Project Agorá successfully tested cross-border payments with tokenized funds across six currencies. Ten major European financial institutions formed the RL1 blockchain cooperative to build tokenized asset infrastructure. Other notable updates: Aviva launched a tokenized dollar liquidity fund on XRPL, POSCO International tokenized commercial invoices on Injective, and a Brazilian farmer used tokenized cattle as collateral for a loan. Additional progress includes BNY Mellon migrating its core transfer agent operations to blockchain, Securitize gaining SEC investment advisor registration, and Tether’s compliant stablecoin USA₮ launching on Celo. Ondo Finance introduced Ondo Network, a new execution layer focused on speed and privacy, moving away from its initial chain plans. An analysis highlights that despite the growing scale of on-chain RWAs (~$32B), approximately 90% remain underutilized in DeFi, pointing to a critical challenge in unlocking liquidity and fostering real-world application beyond mere issuance.

marsbitHá 32m

RWA Weekly: Ten European Financial Institutions Establish Tokenized Asset Cooperative; Ondo Launches New Execution Network Ondo Network

marsbitHá 32m

Trading

Spot

Artigos em Destaque

Como comprar LINK

Bem-vindo à HTX.com!Tornámos a compra de ChainLink (LINK) simples e conveniente.Segue o nosso guia passo a passo para iniciar a tua jornada no mundo das criptos.Passo 1: cria a tua conta HTXUtiliza o teu e-mail ou número de telefone para te inscreveres numa conta gratuita na HTX.Desfruta de um processo de inscrição sem complicações e desbloqueia todas as funcionalidades.Obter a minha contaPasso 2: vai para Comprar Cripto e escolhe o teu método de pagamentoCartão de crédito/débito: usa o teu visa ou mastercard para comprar ChainLink (LINK) instantaneamente.Saldo: usa os fundos da tua conta HTX para transacionar sem problemas.Terceiros: adicionamos métodos de pagamento populares, como Google Pay e Apple Pay, para aumentar a conveniência.P2P: transaciona diretamente com outros utilizadores na HTX.Mercado de balcão (OTC): oferecemos serviços personalizados e taxas de câmbio competitivas para os traders.Passo 3: armazena teu ChainLink (LINK)Depois de comprar o teu ChainLink (LINK), armazena-o na tua conta HTX.Alternativamente, podes enviá-lo para outro lugar através de transferência blockchain ou usá-lo para transacionar outras criptomoedas.Passo 4: transaciona ChainLink (LINK)Transaciona facilmente ChainLink (LINK) no mercado à vista da HTX.Acede simplesmente à tua conta, seleciona o teu par de trading, executa as tuas transações e monitoriza em tempo real.Oferecemos uma experiência de fácil utilização tanto para principiantes como para traders experientes.

986 Visualizações TotaisPublicado em {updateTime}Atualizado em 2026.06.02

Como comprar LINK

Discussões

Bem-vindo à Comunidade HTX. Aqui, pode manter-se informado sobre os mais recentes desenvolvimentos da plataforma e obter acesso a análises profissionais de mercado. As opiniões dos utilizadores sobre o preço de LINK (LINK) são apresentadas abaixo.

活动图片