BTC Thrice Rejected at $80,000 Threshold, HYPE Reaches New Highs Signaling Opportunity | Guest Analysis

marsbitPublicado em 2026-05-26Última atualização em 2026-05-26

Resumo

**Bitcoin (BTC) Struggles at $80k; HYPE Reaches New Highs | Key Analysis & Strategy** Bitcoin faces continued resistance in the $78.5k - $79.5k zone after failing to sustain a break above its daily chart rising channel. It has retreated to the channel's midline. A failure to hold here could see a test of the $73.5k - $75k support area. The 4-hour chart shows a complex corrective structure. The strategy is neutral for mid-term positions. For short-term trading, two scenarios are outlined: **A)** Selling on a failed rally into the $78.5k-$79.5k resistance, and **B)** Selling on a confirmed breakdown below the $73.5k-$75k support, both with tight risk management. Meanwhile, **HYPE** has posted consecutive highs. The 4-hour chart indicates its current uptrend may be weakening near $65, with models showing potential bearish divergence. The view is that a short-term top could be forming. The strategy advises against chasing the rally and instead looking for a potential long entry on a pullback to the $47.5 - $50 support zone, provided clear reversal signals appear. Last week, a disciplined short BTC trade based on model signals yielded a 2.78% profit. The article emphasizes that all analysis is for informational purposes only and not investment advice, highlighting the importance of strict stop-loss discipline and dynamic position management in a volatile market. *(Note: The text references proprietary models like the "Price Difference Trading Model" and "Momentum Quantificatio...

Continuing our consistent structured analysis framework this week, we focus on two key assets, Bitcoin and HYPE, dissecting the current price action across multiple timeframes. We will examine the ongoing battle between bulls and bears at critical resistance and support zones and formulate specific, actionable operational plans accordingly.

Last week's short position successfully realized a gain of 2.78%, once again validating the trading logic of "signal-driven, disciplined execution." However, a single profitable trade never implies the market direction is definitively correct—the market always retains the potential to move beyond expectations.

The core variable for this week remains the struggle between the resistance zone of $78,500~$79,500 and the support zone of $73,500~$75,000. The outcome will be left for the market to decide.

Summary of This Week's Core Trading Views:

• Analysis of BTC's Multi-Timeframe Price Structure. (Detailed in Part 1)

• BTC Market Forecast and Medium-/Short-Term Trading Strategies for This Week. (Detailed in Part 2)

• Analysis of HYPE's Hourly Chart Price Structure. (Detailed in Part 3)

• HYPE Market Forecast and Short-Term Trading Strategy for This Week. (Detailed in Part 4)

Verification of Last Week's Trading Strategy and Core Views:

• BTC Short-Term Trade Performance: Bitcoin executed one short-term short trade last week (1x leverage), successfully achieving a return of approximately 2.78%. (Detailed in Table 1)

• Market Verification of BTC Trend Forecast: In last week's article, we stated: If the price effectively breaks below the support zone of $78,500~$79,500, it will test the support strength near $75,000. The current market movement has verified our previous forecast.

1. Analysis of Bitcoin's Multi-Timeframe Price Structure

1.1 BTC Daily Chart Structure Analysis

Bitcoin _ Daily Chart:
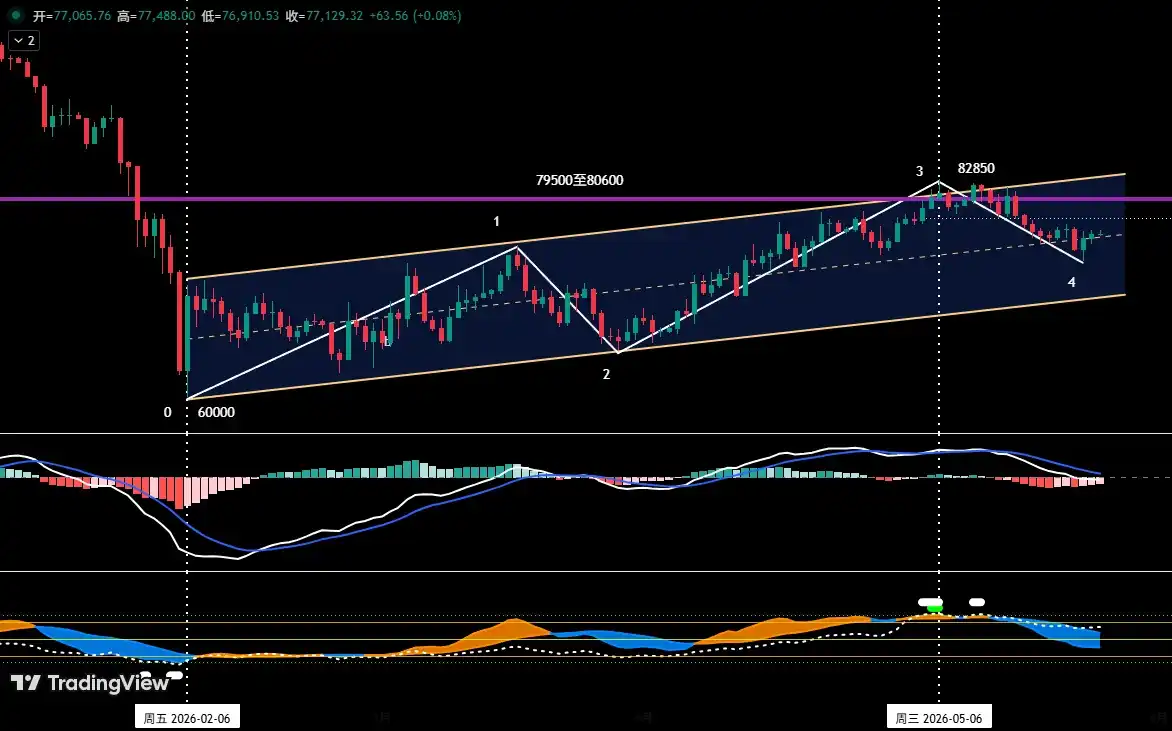
Figure 1

• As shown in (Figure 1), since establishing a significant low near $60,000 on February 6, 2026, Bitcoin's daily chart has constructed and maintained a clearly defined ascending channel: its lower boundary is formed by connecting the lows of February 6 and March 29, while the upper boundary is drawn parallel to the lower boundary through the high of March 17.

• In our weekly review on April 27, we pointed out: "The current price is facing dual resistance from the channel's upper boundary and the $79,500 to $80,600 resistance zone. A breakout is expected to be difficult." Subsequent market action validated this view. After nearly 20 days of struggle between bulls and bears, although a new rebound high of $82,850 was reached on May 6, the price failed to decisively break above this resistance area and subsequently began a corrective pullback.

From the current structure, the price has retraced from near the channel's upper boundary to the mid-channel area. If the price fails to find effective support near the mid-channel and resume its uptrend, the probability of it seeking support at the channel's lower boundary increases.

1.2 In-Depth Analysis of BTC's Hourly Chart Structure

Bitcoin _ 4-Hour Chart
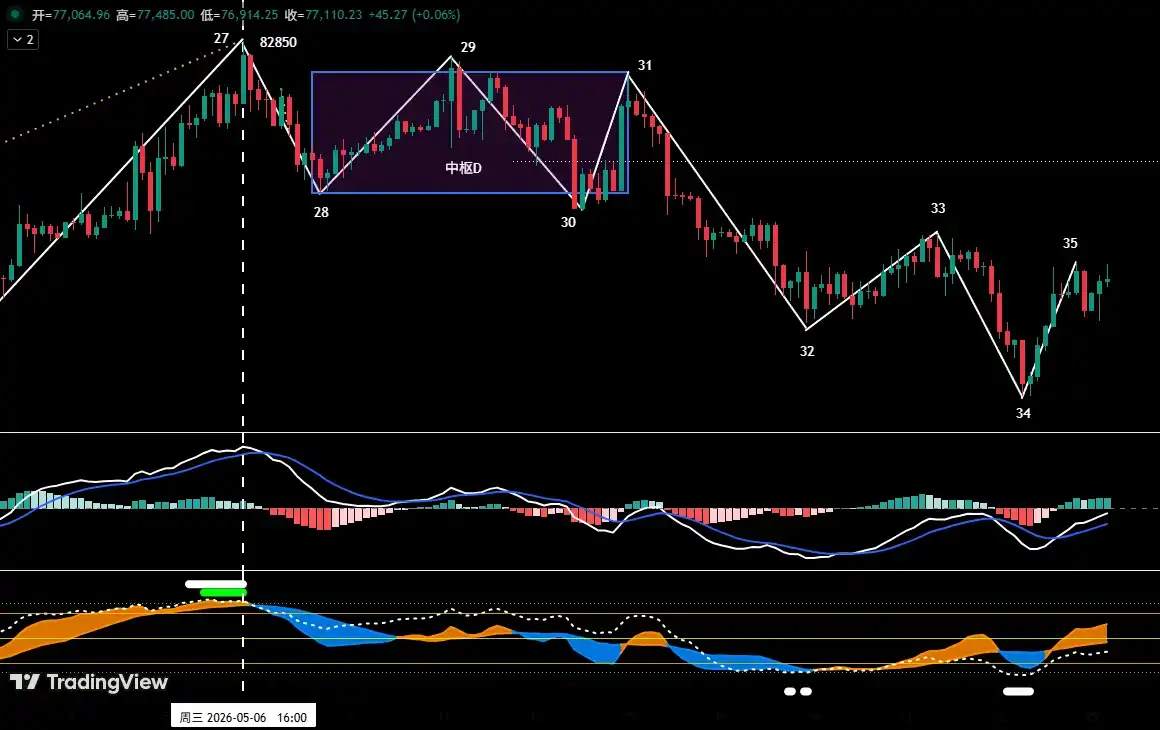
Figure 2

As shown in (Figure 2), from the high of $82,850 on May 6 to the present correction:

• The 4-hour chart shows it can be subdivided into an 8-segment corrective structure: "segment 27-28" to "segment 34-35". Center D: Segments 28-29, 29-30, and 30-31 overlap, constituting Center D.

• From the 4-hour price structure, segment 34-35 is about to rebound to the $78,500~$79,500 zone. If the rebound faces rejection upon reaching this area and fails to form a decisive breakout, the market is likely to continue its current corrective consolidation pattern and test the core support band of $73,500~$75,000 again.

2. Bitcoin Market Forecast and Trading Strategy for This Week

2.1 BTC Market Trend Forecast for This Week:

This week's core view: Focus on the outcome of the battle between bulls and bears over the $78,500~$79,500 resistance zone and the $73,500~$75,000 support zone.

2.2 Core Resistance Levels:

• Primary Resistance Zone: $78,500~$79,500 area (near the boundaries of two centers)

• Secondary Resistance Zone: $83,500~$84,500 area (previous high-volume trading congestion zone)

2.3 Core Support Levels:

• Primary Support Zone: $73,500~$75,000 area (previous significant support level)

• Secondary Support Zone: $69,500~$70,500 area (previous significant support level)

2.4 Trading Strategy for This Week (Excluding Impact of Sudden News)

1. Medium-Term Strategy:

Bitcoin _ Daily Chart: (Position Monitoring Model)
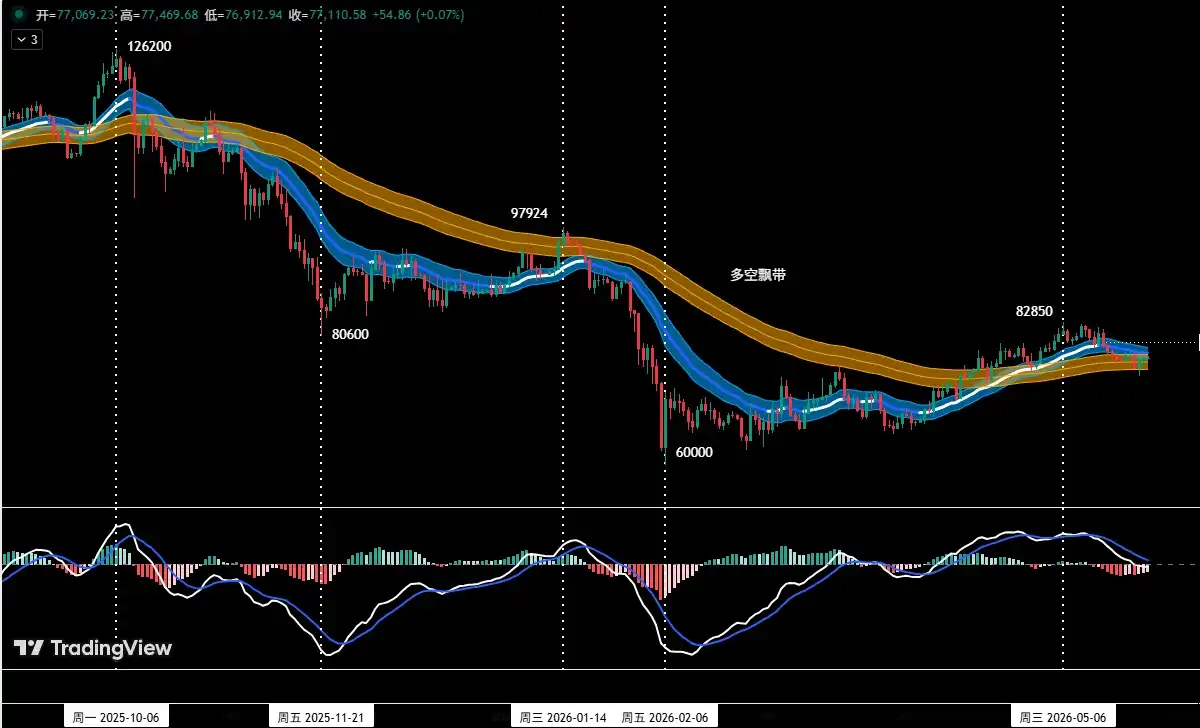
Figure 3

Position Monitoring Model: As shown in (Figure 3), based on trading rules, the medium-term market direction is not yet clear. Maintain a neutral/观望 stance for medium-term positions this week.

2. Short-Term Strategy: Utilize 30% of capital, set stop-losses, and look for "spread" trading opportunities based on support and resistance levels. (Using 30-minute/60-minute charts as the operational timeframe).

3. For short-term operations, to dynamically adapt to the market's complex evolution, we have pre-formulated two specific operational plans: A/B.

Plan A: Rebound Faces Resistance, Sell High.

• Entry: When the price rebounds to the $78,500~$79,500 zone and encounters resistance, combined with a top signal from the quantitative model, a short position of less than 30% can be established.

• Risk Control: Initial stop-loss set above $80,600.

• Exit: When the correction approaches important support levels combined with model signals, gradually close the position to take profits.

Plan B: Support Breached Effectively, Follow the Trend Short.

• Entry: When the price effectively breaks below the $73,500~$75,000 support zone combined with a model top signal, a short position of less than 30% can be established.

• Risk Control: Initial stop-loss set above $76,500.

• Exit: When the decline reaches important support levels combined with model signals, gradually close the position to take profits.

3. Analysis of HYPE's Price Structure

HYPE_4-Hour Chart
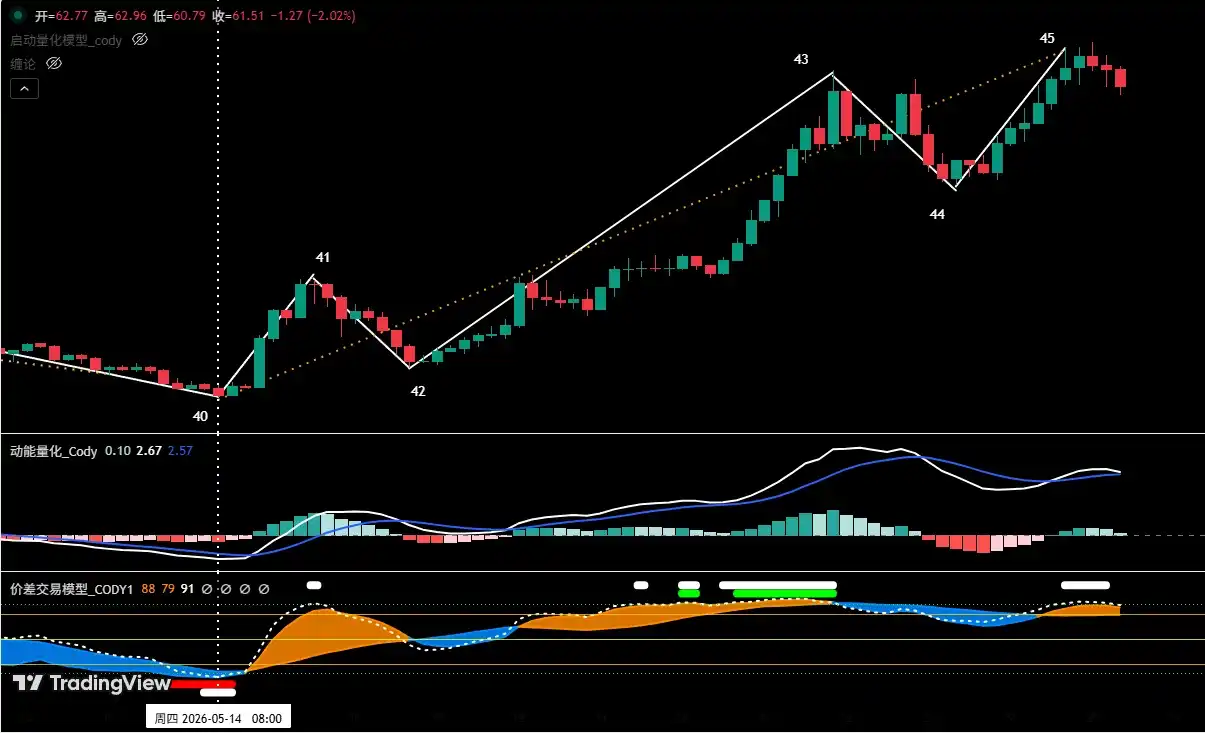
Figure 4

1. As shown in (Figure 4), the rally in HYPE from the low of $38.14 on May 14, on the 4-hour chart, can be divided into a five-segment structure: 40-41, 41-42, 42-43, 43-44, 44-45.

2. Our proprietary "Spread Trading Model" shows that near endpoint 45, a top warning signal (white dot) has been triggered.

3. From the perspective of the "Momentum Quantitative Model," the rising segment (44-45) near $65 has shown signs of waning upward momentum.

4. If a bearish momentum divergence forms at the "endpoint 45" position, overlapping with the top warning signal from the "Spread Trading Model," creating a共振 (resonance), the probability of the price forming a short-term high here increases significantly.

4. HYPE Market Forecast and Short-Term Trading Strategy for This Week

4.1 HYPE Market Trend Forecast for This Week:

This week's core HYPE view:

• Observe whether "endpoint 45" can form a short-term high since the rally began on May 14.

• If a short-term high forms, subsequently look for short-term long opportunities after the price pulls back to a key support area (e.g., $47.5 to $50) and shows clear signs of stabilization.

4.2 HYPE Short-Term Trading Strategy for This Week: (Buy on Support)

Currently, adhere to the strategy of "avoid盲目追涨 (blindly chasing rallies), buy on dips." If the price corrects to the $47.5 to $50 zone, finds support, and shows stabilization signals, combined with bottom signals triggered by both models, consider a light long position. Position size must be controlled below 30%, with strict stop-loss discipline.

5. Trade Review

5.1 Short-Term Trade Review:(See Table 1)

Strictly following the operational plan, based on trading signals from our proprietary "Spread Trading Model" and "Momentum Quantitative Model," we completed one short-term (short) trade last week, achieving a profit of 2.78%.

5.1 Bitcoin Short-Term Trade Details Summary: (Leverage*1x)
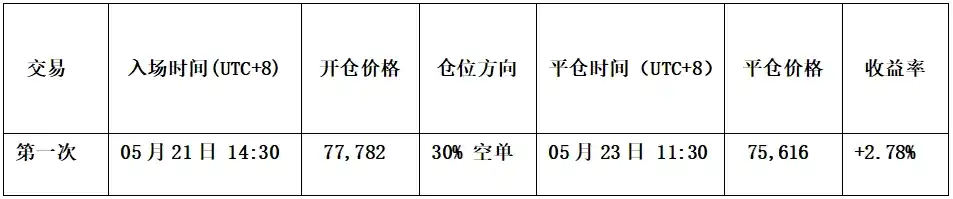
Table 1

5.2 Short-Term Trade Review: (See Figure 5)

• Entry Strategy:

a. When the price rebounded to near $78,500, encountered resistance, and showed bearish pressure signals, with the candlestick forming a "top reversal" bearish signal;

b. The "Spread Trading Model" triggered a top warning signal (white dot), and the "Momentum Quantitative Model" formed a bearish momentum divergence signal.

Therefore, we established a 30% short position at $77,782.

• Exit Strategy:

a. When the price fell to near $75,000 and found support, with the candlestick forming a "bottom reversal" signal;

b. The "Spread Trading Model" triggered a strong bottom warning signal (red dot + white dot), forming a bottom共振 (resonance) signal with the "Momentum Quantitative Model."

Therefore, we closed the entire position near $75,616.

• Summary: This trade successfully realized a profit of approximately 2.78%.

BTC_30 Minute Chart: (Momentum Quantitative Model + Spread Trading Model)
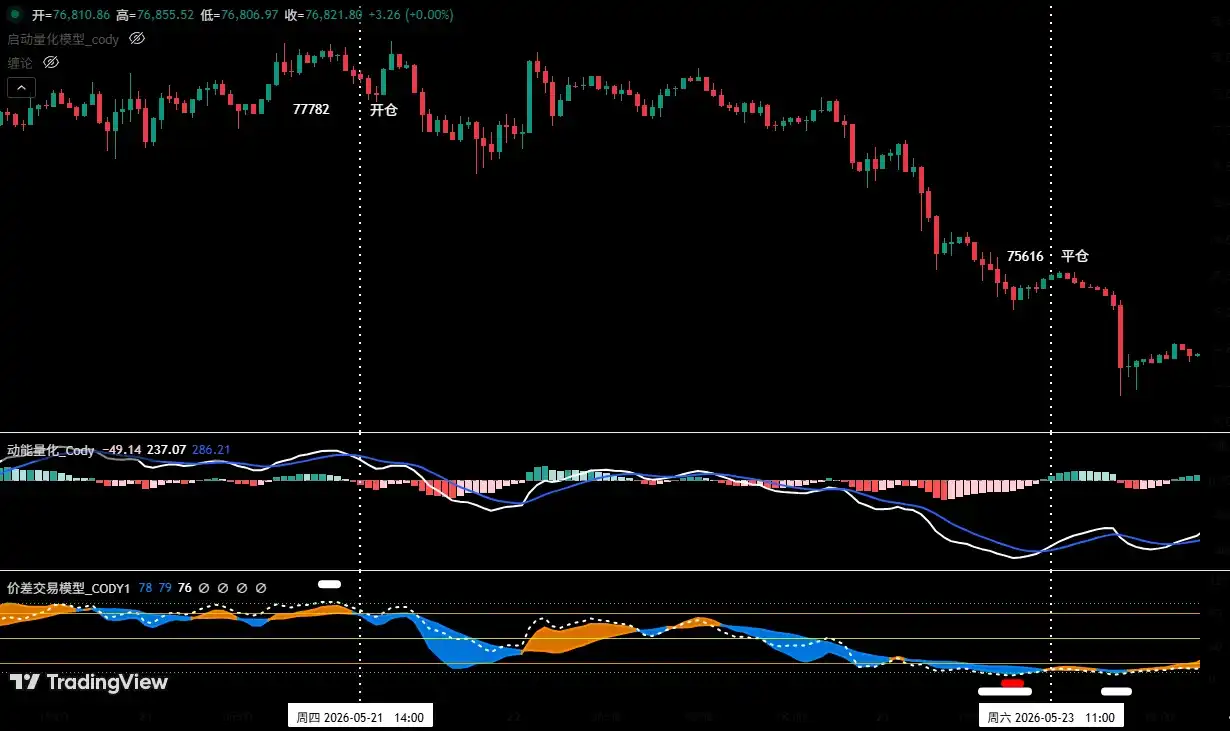
Figure 5 (Short-Term Trade Illustration)

6. Special Reminders:

1. Upon Entry: Immediately set the initial stop-loss.

2. When Profit Reaches 1%: Move the stop-loss to the entry price (breakeven point) to ensure principal safety.

3. When Profit Reaches 2%: Move the stop-loss to the 1% profit level.

4. Continuous Tracking: Thereafter, for every additional 1% profit, move the stop-loss up by 1%, dynamically protecting and locking in profits.

Financial markets are瞬息万变 (constantly changing). All market analysis and trading strategies require dynamic adjustment. All views, analytical models, and operational strategies mentioned in this article are derived from personal technical analysis, intended solely for personal trading journal purposes. They do not constitute any investment advice or operational basis. The market involves risks; invest with caution. Do not make decisions based solely on this content.


Criptomoedas em alta

Perguntas relacionadas

QWhat is the core resistance zone that Bitcoin (BTC) is struggling to break through according to the article?

AAccording to the article, Bitcoin (BTC) is struggling to break through the core resistance zone of $78,500 to $79,500. This area has acted as a key barrier, with BTC facing it three times already.

QWhat are the two specific short-term operation plans outlined for Bitcoin in the article?

AThe article outlines two short-term operation plans for Bitcoin (BTC): Plan A: 'Rebound meets resistance, sell high' - open a short position if the price rebounds to the $78,500-$79,500 resistance zone and shows signs of pressure. Plan B: 'Effectively breaks support, follow the trend to sell short' - open a short position if the price effectively breaks below the $73,500-$75,000 support zone.

QWhat is the key support area to watch for HYPE according to the analysis?

AThe key support area to watch for HYPE, as per the article, is the $47.5 to $50 region. The strategy suggests looking for short-term buying opportunities if the price falls back to this zone, shows signs of stabilization, and is accompanied by bottom signals from their trading models.

QWhat trading models does the article mention were used for the successful short-term BTC trade last week?

AThe article mentions that last week's successful short-term BTC trade was executed based on signals from two proprietary models: the 'Price Difference Trading Model' and the 'Dynamic Energy Quantification Model'.

QWhat is the overall stance for Bitcoin's medium-term strategy this week according to the 'Position Monitoring Model'?

AAccording to the 'Position Monitoring Model' shown in the article, the medium-term strategy for Bitcoin (BTC) this week is to maintain an empty position and adopt a wait-and-see approach, as the medium-term market direction is not yet clear.

Leituras Relacionadas

Must-Watch Events Next Week|CLARITY Act Could Face Senate Vote; SpaceX, Circle to Report Earnings (8.3-8.9)

**Summary: Key Events and Developments to Watch (August 3-9)** The upcoming week is marked by significant financial disclosures, key legislative deadlines, and notable product updates. **Major Financial Events:** Several companies are scheduled to release their Q2 2026 earnings. American Bitcoin (ABTC) will report on August 3, followed by SpaceX and Hut 8 Mining Corp. on August 4, and Circle on August 5. Notably, a significant portion of SpaceX shares (up to 12% of total shares) will be unlocked on August 6 following their earnings release. **Key Legislative Deadline:** The U.S. Senate faces an August 7 deadline to secure 60 votes for the CLARITY Act, a bipartisan bill aiming to establish a federal regulatory framework for cryptocurrencies. The Senate may hold a full vote on the bill during the week. **Economic Data:** The U.S. July Non-Farm Payrolls report will be released on August 7, providing crucial labor market data. **Technology & Product Updates:** * **Shutdowns:** DeFi portfolio tracker Zapper and wallet app Ctrl Wallet will cease operations on August 3. * **Upgrades:** LayerZero will deprecate its v1 relayers on August 3. XRP Ledger's new version 3.3.0, featuring five new functions, is expected next week. * **AI:** Elon Musk announced that the advanced Grok 4.6 AI model is set for release around August 7. * **Bitcoin:** The BIP-110 forced signaling for a potential Bitcoin network change is scheduled to begin around August 8. **Other Notable Events:** Chinese robotics firm Unitree Tech has set its preliminary price inquiry for its IPO for August 5. South Korean exchange Upbit will delist AQT and AERGO tokens on August 3.

marsbitHá 58m

Must-Watch Events Next Week|CLARITY Act Could Face Senate Vote; SpaceX, Circle to Report Earnings (8.3-8.9)

marsbitHá 58m

Stocks Are Plummeting More Sharply Than Cryptocurrencies. Where Has the Money Gone?

Stock Markets Plunge Deeper Than Cryptocurrencies: Where Did the Money Go? In late July, Seoul's Kospi index triggered circuit breakers for two consecutive days, plummeting over 40% from its June high. The collapse was led by heavyweight stocks like SK Hynix, whose record profits still disappointed investors, and devastating leveraged ETFs, with one major product losing over 83% of its value. This signaled a global, forced deleveraging targeting the most crowded trades. Interestingly, while stocks exhibited extreme volatility akin to crypto markets, Bitcoin rose nearly 15% in July after a prior steep drop. Analysis shows the money fleeing equities did not flow into Bitcoin. Instead, Bitcoin had already absorbed its sell-off in May-June, when U.S. spot Bitcoin ETFs saw historic outflows. The true safe-haven beneficiary was gold, whose price rose over 20% year-on-year, highlighting a decoupling between Bitcoin and gold as "digital gold." The sell-off was a targeted unwinding of leveraged positions in tech and semiconductors, accelerated by broker-dealer risk management and shifts in the AI narrative, including new competition from Chinese memory chipmakers. The retreat path was clear: from high-valuation tech stocks to cash and U.S. Treasuries, then to gold. For Bitcoin to attract sustained institutional inflows, conditions like eased global liquidity pressure, a "soft-landing" Fed rate cut, and U.S. regulatory clarity via legislation like the stalled CLARITY Act are needed. Currently, Bitcoin is not a safe haven but an already-cleared asset. Its low correlation with tech stocks, however, makes it a potential diversification play for institutional portfolios once the storm passes. The money isn't here yet, but the positioning is underway.

marsbitHá 59m

Stocks Are Plummeting More Sharply Than Cryptocurrencies. Where Has the Money Gone?

marsbitHá 59m

In Conversation with Ray Dalio: We Are Currently in an AI Bubble, with 1% of My Portfolio in Bitcoin

Ray Dalio, founder of Bridgewater Associates, warns in an interview that the current AI boom shows classic bubble characteristics, which could lead to significant economic downturns as seen in past cycles like 1929 or 2000. He explains that speculative enthusiasm, fueled by debt and overvaluation, often precedes a crash when rising rates or taxation force asset sales, causing widespread losses and recession. Dalio also outlines his "Big Cycle" theory, describing an approximate 80-year pattern where widening wealth gaps, massive government deficits, and shifting geopolitical power (like China's rise) create internal conflict and global instability. He emphasizes that we are in a late-cycle, transitional phase where traditional powers like the US and UK face decline. For personal wealth protection, Dalio advises diversification beyond cash into assets like stocks, bonds, real estate, and particularly gold, which he prefers over Bitcoin. While he holds about 1% of his portfolio in Bitcoin as a non-printable hard asset, he views gold as more secure from technological or governmental threats. Regarding AI's impact, Dalio believes it will disproportionately benefit capital owners, worsening inequality by replacing both physical and cognitive labor. He suggests that human intuition and emotional intelligence, combined with AI, will be key for future workers. On taxation, Dalio argues that wealth taxes are impractical and risk triggering asset sell-offs, reducing productive investment. He points to the UK as a cautionary example of debt, low productivity, and political strife. Geopolitically, Dalio foresees a more regionalized world, with the US showing weakness in prolonged conflicts like with Iran, akin to past imperial declines. The ideal outcome, he suggests, is coexisting powerful blocs (e.g., Americas, China-Asia Pacific) without major war.

marsbitHá 4h

In Conversation with Ray Dalio: We Are Currently in an AI Bubble, with 1% of My Portfolio in Bitcoin

marsbitHá 4h

Trading

Spot

Artigos em Destaque

Como comprar HYPE

Bem-vindo à HTX.com!Tornámos a compra de Hyperliquid (HYPE) simples e conveniente.Segue o nosso guia passo a passo para iniciar a tua jornada no mundo das criptos.Passo 1: cria a tua conta HTXUtiliza o teu e-mail ou número de telefone para te inscreveres numa conta gratuita na HTX.Desfruta de um processo de inscrição sem complicações e desbloqueia todas as funcionalidades.Obter a minha contaPasso 2: vai para Comprar Cripto e escolhe o teu método de pagamentoCartão de crédito/débito: usa o teu visa ou mastercard para comprar Hyperliquid (HYPE) instantaneamente.Saldo: usa os fundos da tua conta HTX para transacionar sem problemas.Terceiros: adicionamos métodos de pagamento populares, como Google Pay e Apple Pay, para aumentar a conveniência.P2P: transaciona diretamente com outros utilizadores na HTX.Mercado de balcão (OTC): oferecemos serviços personalizados e taxas de câmbio competitivas para os traders.Passo 3: armazena teu Hyperliquid (HYPE)Depois de comprar o teu Hyperliquid (HYPE), armazena-o na tua conta HTX.Alternativamente, podes enviá-lo para outro lugar através de transferência blockchain ou usá-lo para transacionar outras criptomoedas.Passo 4: transaciona Hyperliquid (HYPE)Transaciona facilmente Hyperliquid (HYPE) no mercado à vista da HTX.Acede simplesmente à tua conta, seleciona o teu par de trading, executa as tuas transações e monitoriza em tempo real.Oferecemos uma experiência de fácil utilização tanto para principiantes como para traders experientes.

441 Visualizações TotaisPublicado em {updateTime}Atualizado em 2026.06.02

Como comprar HYPE

Discussões

Bem-vindo à Comunidade HTX. Aqui, pode manter-se informado sobre os mais recentes desenvolvimentos da plataforma e obter acesso a análises profissionais de mercado. As opiniões dos utilizadores sobre o preço de HYPE (HYPE) são apresentadas abaixo.

活动图片