Continuing with our structured analytical framework this week, we dissect the current movements of Bitcoin and HYPE from multiple time dimensions, assess the struggle between buyers and sellers around key resistance and support zones, and formulate specific, actionable operational plans accordingly.
Last week's short position successfully yielded a 2.78% profit, once again validating the trading logic of 'signal-driven, strict discipline'. However, a single profitable trade does not necessarily indicate that the market direction is definitively correct – the market always retains the possibility of exceeding expectations.
The core variable for this week remains the battle between the $78,500–$79,500 resistance zone and the $73,500–$75,000 support zone. The outcome will be answered by the market itself.
Summary of Core Trading Views for This Week:
• Analysis of BTC's multi-cycle price structure. (Detailed in Part I)
• BTC price forecast and mid-term, short-term operational strategies for this week. (Detailed in Part II)
• Analysis of HYPE's hourly chart structure. (Detailed in Part III)
• HYPE price forecast and short-term operational strategy for this week. (Detailed in Part IV)
Market Verification of Last Week's Trading Strategies and Core Views:
• BTC Short-term Trading Results: Bitcoin completed one short-term short position (1x leverage) last week, achieving a profit of approximately 2.78%. (Detailed in Table I)
• Market Verification of BTC Price Forecast: In last week's article, we noted: If the price effectively breaks below the support zone of $78,500–$79,500, it will test the support strength near $75,000. The current market movement verifies our previous forecast.
I. Analysis of Bitcoin's Multi-Cycle Price Structure
1. BTC Daily Chart Structure Analysis
Bitcoin _ Daily Chart:
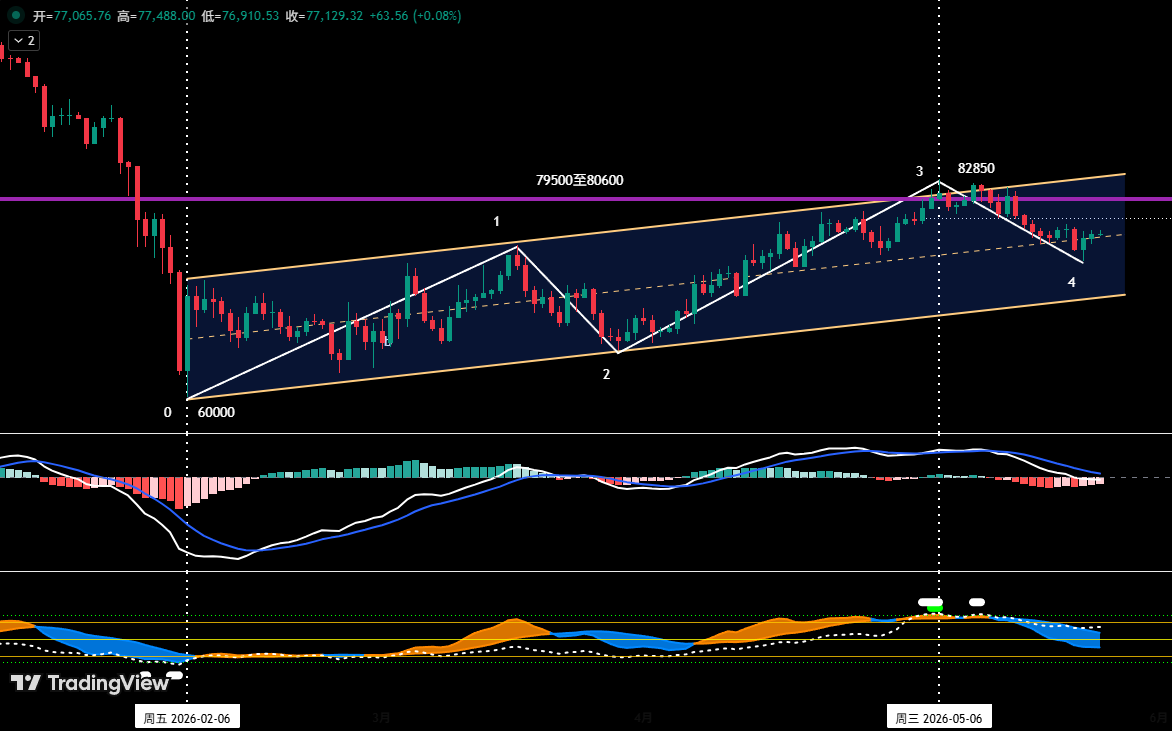
Figure 1
• As shown in (Figure 1), since establishing a stage low near $60,000 on February 6, 2026, Bitcoin's daily chart has constructed and maintained a clearly structured ascending channel: its lower boundary is formed by connecting the lows of February 6 and March 29, while the upper boundary is drawn parallel to the lower boundary through the high of March 17.
• In our April 27th weekly review, we pointed out: "The current price is facing dual pressure from the channel's upper boundary and the $79,500 to $80,600 resistance zone, making a breakthrough likely difficult". Subsequent market action confirmed this assessment. After nearly 20 days of tug-of-war between bulls and bears, although a new rebound high of $82,850 was reached on May 6, it failed to effectively break through this zone's resistance, and the price subsequently began to fluctuate downward.
• From the current structure, the price has retraced from near the channel's upper boundary to the mid-channel area. If the price fails to find effective support near the mid-channel and resume its uptrend, the probability of subsequently seeking support at the channel's lower boundary is increasing.
2. In-Depth Analysis of BTC's Hourly Chart Structure
Bitcoin _ 4-Hour Chart
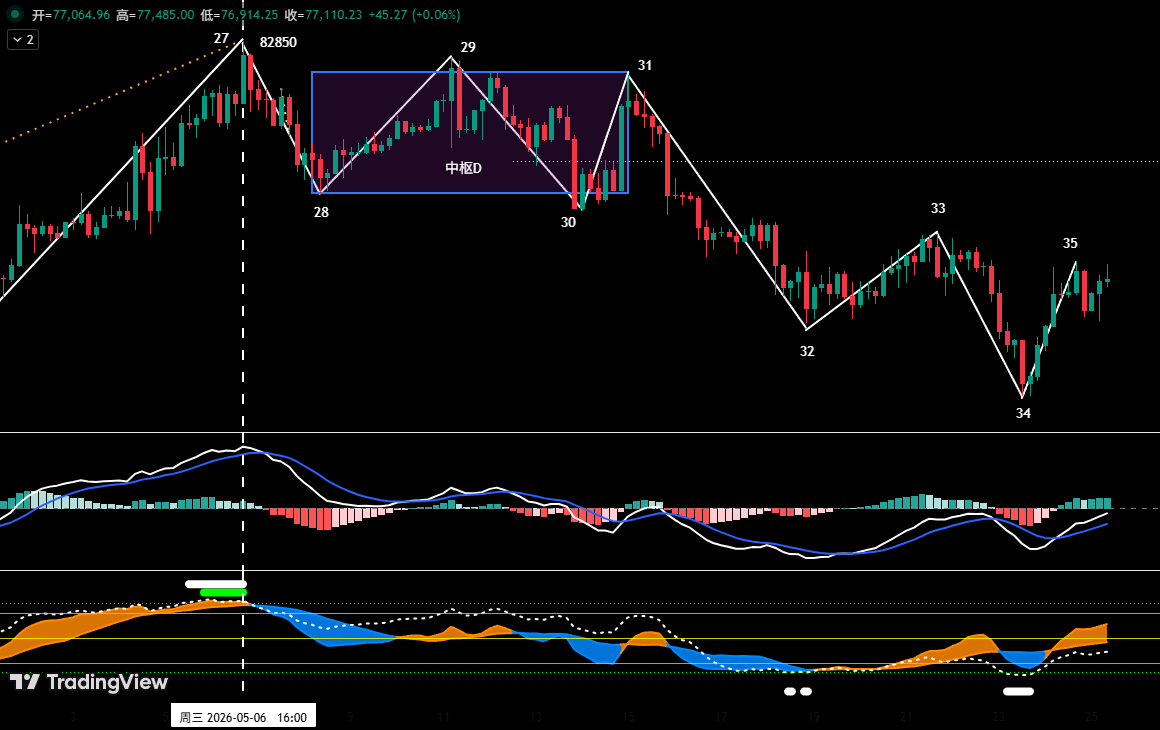
Figure 2
As shown in (Figure 2), from the May 6 high of $82,850 to the ongoing adjustment;
• On the 4-hour chart, it can be subdivided into an 8-segment adjustment structure: from "Segment 27-28" to "Segment 34-35"; Central D: Due to the overlapping of segments 28-29, 29-30, and 30-31, they constitute Central D.
• From the 4-hour chart structure, segment 34-35 is about to rebound to the $78,500–$79,500 zone. If the price faces resistance and falls back after rebounding to this zone, failing to form an effective breakthrough, the market is likely to continue the current fluctuating adjustment pattern and test the core support band of $73,500–$75,000 again.
II. Bitcoin Price Forecast and Operational Strategy for This Week
1. BTC Price Forecast for This Week:
Core View This Week: Focus on the outcome of the battle between bulls and bears for the $78,500–$79,500 resistance zone and the $73,500–$75,000 support zone.
2. Core Resistance Levels:
• First Resistance Zone: $78,500–$79,500 (near the boundaries of two central zones)
• Second Resistance Zone: $83,500–$84,500 (previous dense trading area)
3. Core Support Levels:
• First Support Zone: $73,500–$75,000 (previous key support area)
• Second Support Zone: $69,500–$70,500 (previous key support area)
4. Operational Strategy for This Week (Excluding Impact of Sudden News)
1. Mid-term Strategy:
Bitcoin _ Daily Chart: (Position Monitoring Model)
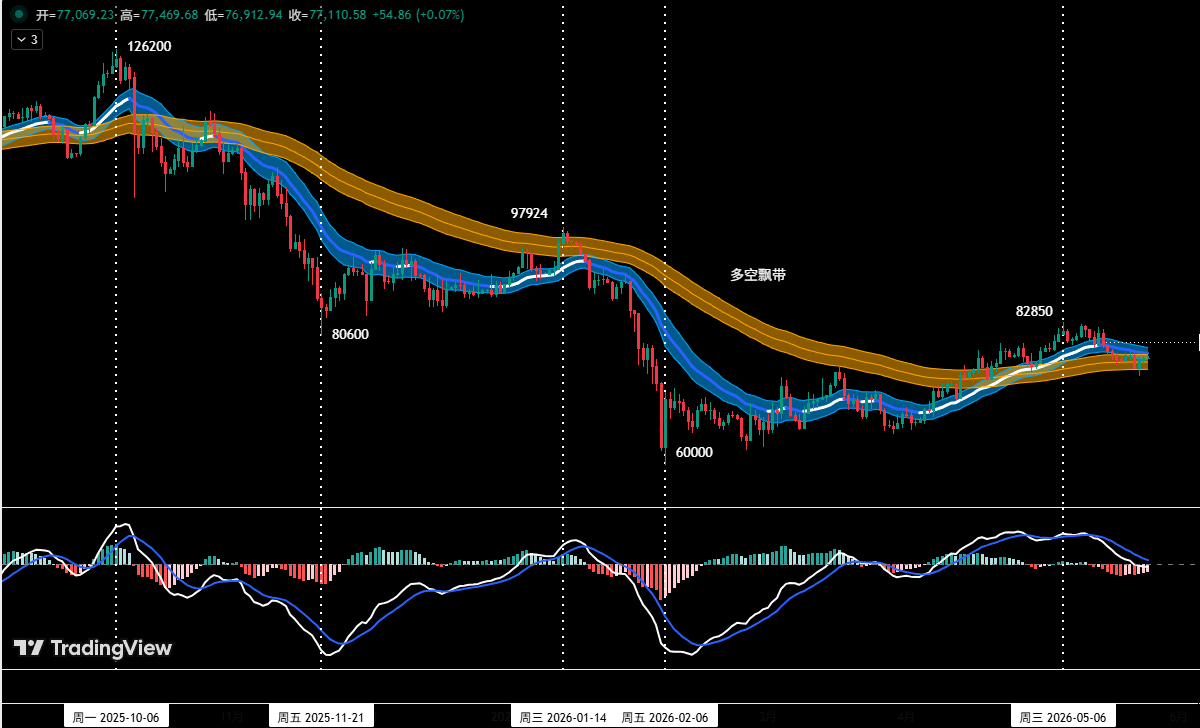
Figure 3
Position Monitoring Model: As shown in (Figure 3), based on trading rules, the market's mid-term direction is not yet clear. This week's mid-term strategy is to maintain a no-position, wait-and-see approach.
2. Short-term Strategy: Utilize 30% of capital, set stop-loss points, and look for "spread" opportunities based on support and resistance levels. (Using 30-minute/60-minute as the operational cycle).
3. In short-term operations, to dynamically respond to complex market developments, we have prepared two specific operational plans in advance: Plan A/B.
• Plan A: Rebound Meets Resistance, Sell High.
• Entry: When the price rebounds to the $78,500–$79,500 zone and encounters resistance, combined with a top signal from the quantitative model, a short position below 30% can be established.
• Risk Control: Initial stop-loss set above $80,600.
• Exit: When the price adjusts near important support levels combined with model signals, gradually close the position to take profits.
• Plan B: Effectively Breaks Support, Follow the Trend Short.
• Entry: When the price effectively breaks below the $73,500–$75,000 support zone combined with a model top signal, a short position below 30% can be established.
• Risk Control: Initial stop-loss set above $76,500.
• Exit: When the price falls to important support levels combined with model signals, gradually close the position to take profits.
III. HYPE Price Structure Analysis
HYPE_4-Hour Chart
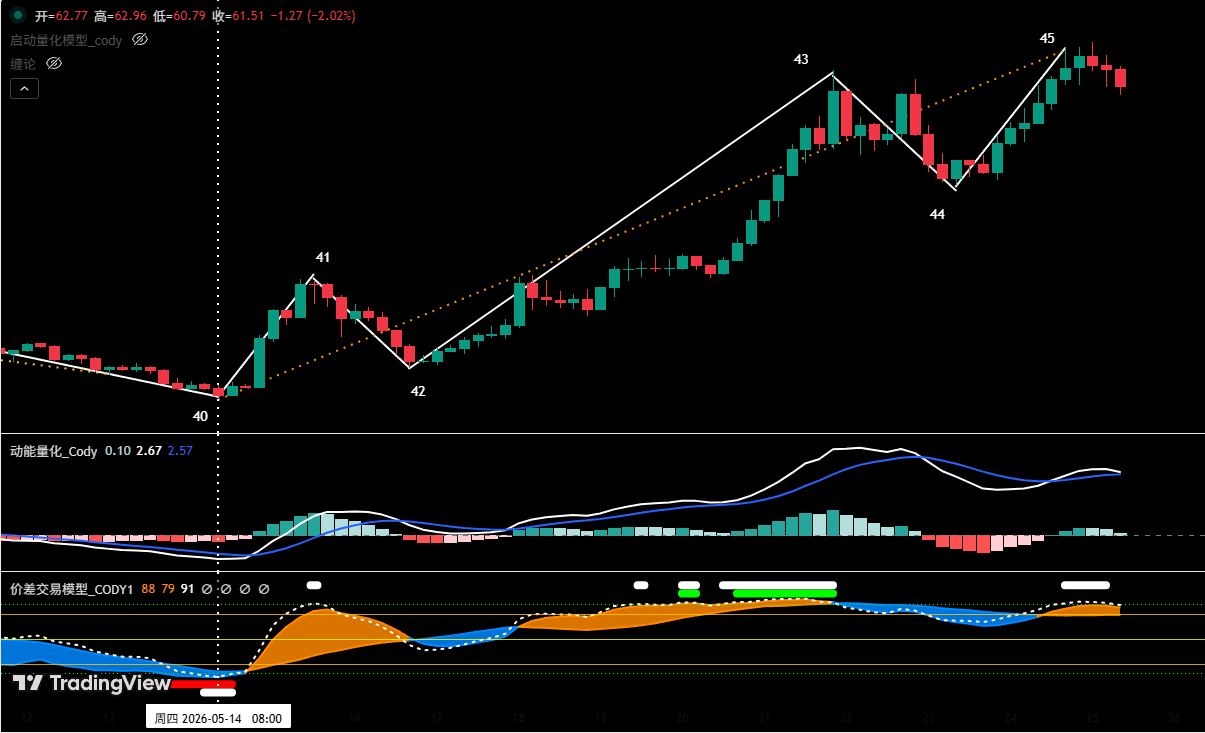
Figure 4
1. As shown in (Figure 4), the uptrend in HYPE starting from the May 14 low of $38.14 can be divided into a five-segment structure on the 4-hour chart: segments 40-41, 41-42, 42-43, 43-44, 44-45.
2. Our proprietary "Spread Trading Model" indicates that near endpoint 45, a top warning signal (white dot) has been triggered.
3. From the "Momentum Quantification Model" perspective, the rising segment (44-45) near $65 has shown signs of weakening upward momentum.
4. If the price forms a momentum bearish divergence state at "endpoint 45" and resonates with the top warning signal from the "Spread Trading Model", the probability of the price forming a short-term high here increases significantly.
IV. HYPE Price Forecast and Short-Term Operational Strategy for This Week
1. HYPE Price Forecast for This Week:
Core View on HYPE This Week:
• Observe whether "endpoint 45" can form a short-term high since the rise began on May 14.
• If a short-term high is formed, subsequently, look for short-term long opportunities when the price retraces to key support areas (e.g., $47.5 to $50) and shows clear signs of stabilization.
2. HYPE Short-Term Operational Strategy for This Week: (Buy on Support)
Currently, the strategy of "avoid blind chasing of highs, buy on dips" should be followed. If the price retraces to the $47.5 to $50 zone, finds support, and shows stabilization signals, combined with bottom signals triggered by both models, consider a light long position. Position size must be controlled below 30%, and strict stop-loss discipline must be maintained.
V. Operational Review
1. Short-Term Operation Review:(See Table I)
We strictly followed the operational plan. Based on trading signals from our proprietary "Spread Trading Model" and "Momentum Quantification Model", we completed one short-term (short) operation last week, achieving a trading profit of 2.78%.
1. Bitcoin Short-Term Trading Details Summary: (Leverage*1x)

Table I
2. Short-Term Trading Review: (See Figure VI)
• Entry Strategy:
a. When the price rebounded near $78,500, encountered resistance, showed pressure signals, and the candlestick formed a "top reversal" bearish signal;
b. The "Spread Trading Model" triggered a top warning signal (white dot), and the "Momentum Quantification Model" formed a momentum bearish divergence signal.
Therefore, we established a 30% short position at $77,782.
• Exit Strategy:
a. When the price fell near $75,000 and found support, and the candlestick formed a "bottom reversal" signal;
b. The "Spread Trading Model" triggered a strong bottom warning signal (red dot + white dot), resonating with a bottom signal from the "Momentum Quantification Model".
Therefore, we closed all positions near $75,616.
• Summary: This trade successfully yielded a profit of approximately 2.78%.
BTC_30 Minute Chart: (Momentum Quantification Model + Spread Trading Model)
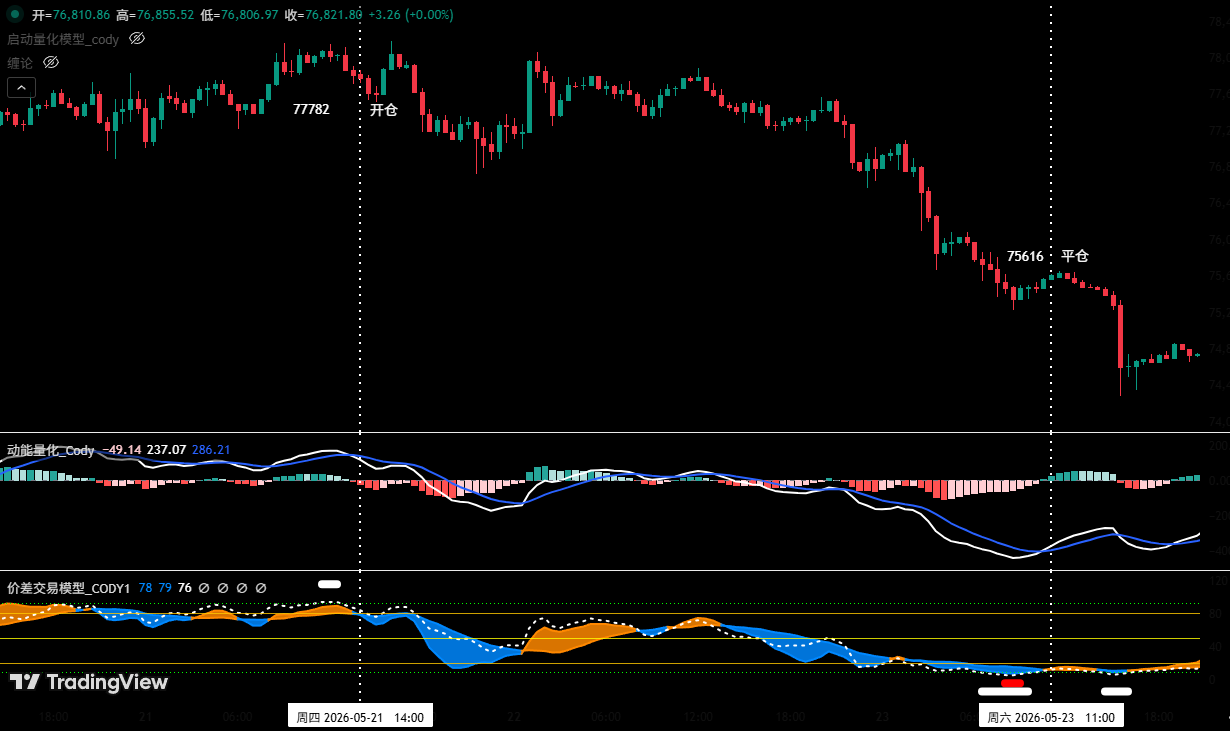
Figure V (Short-Term Trading Illustration)
VI. Special Note:
1. When opening a position: Immediately set the initial stop-loss point.
2. When profit reaches 1%: Move the stop-loss to the entry cost price (break-even point) to ensure capital safety.
3. When profit reaches 2%: Move the stop-loss to the 1% profit level.
4. Continuous Tracking: Thereafter, for every additional 1% profit, move the stop-loss up by 1%, dynamically protecting and locking in profits.
Financial markets are ever-changing; all market analysis and trading strategies require dynamic adjustment. All views, analytical models, and operational strategies mentioned in this article are derived from personal technical analysis, intended solely for personal trading log purposes, and do not constitute any investment advice or operational basis. The market carries risks; investment requires caution. Please do not make decisions based on this.