Bouncing Into Supply

insights.glassnodePublicado em 2026-01-14Última atualização em 2026-01-14

Resumo

Bitcoin has entered a new year testing a critical supply zone between $93k–$110k, where Long-Term Holder (LTH) supply from mid-2025 has repeatedly capped upward moves. While LTH distribution has slowed, the aggressive selling of late 2025 has eased. The market’s ability to hold above the Short-Term Holder cost basis of $98.3k is key for confidence. Spot and institutional flows are stabilizing, with ETFs turning net positive, but futures-driven price action lacks strong volume, relying on short squeezes. Options markets show low implied volatility with a bias for downside protection, indicating deferred risk rather than resolved uncertainty. Overall, the structure is improving, yet the rally needs sustained spot demand to transition into a durable bull trend.

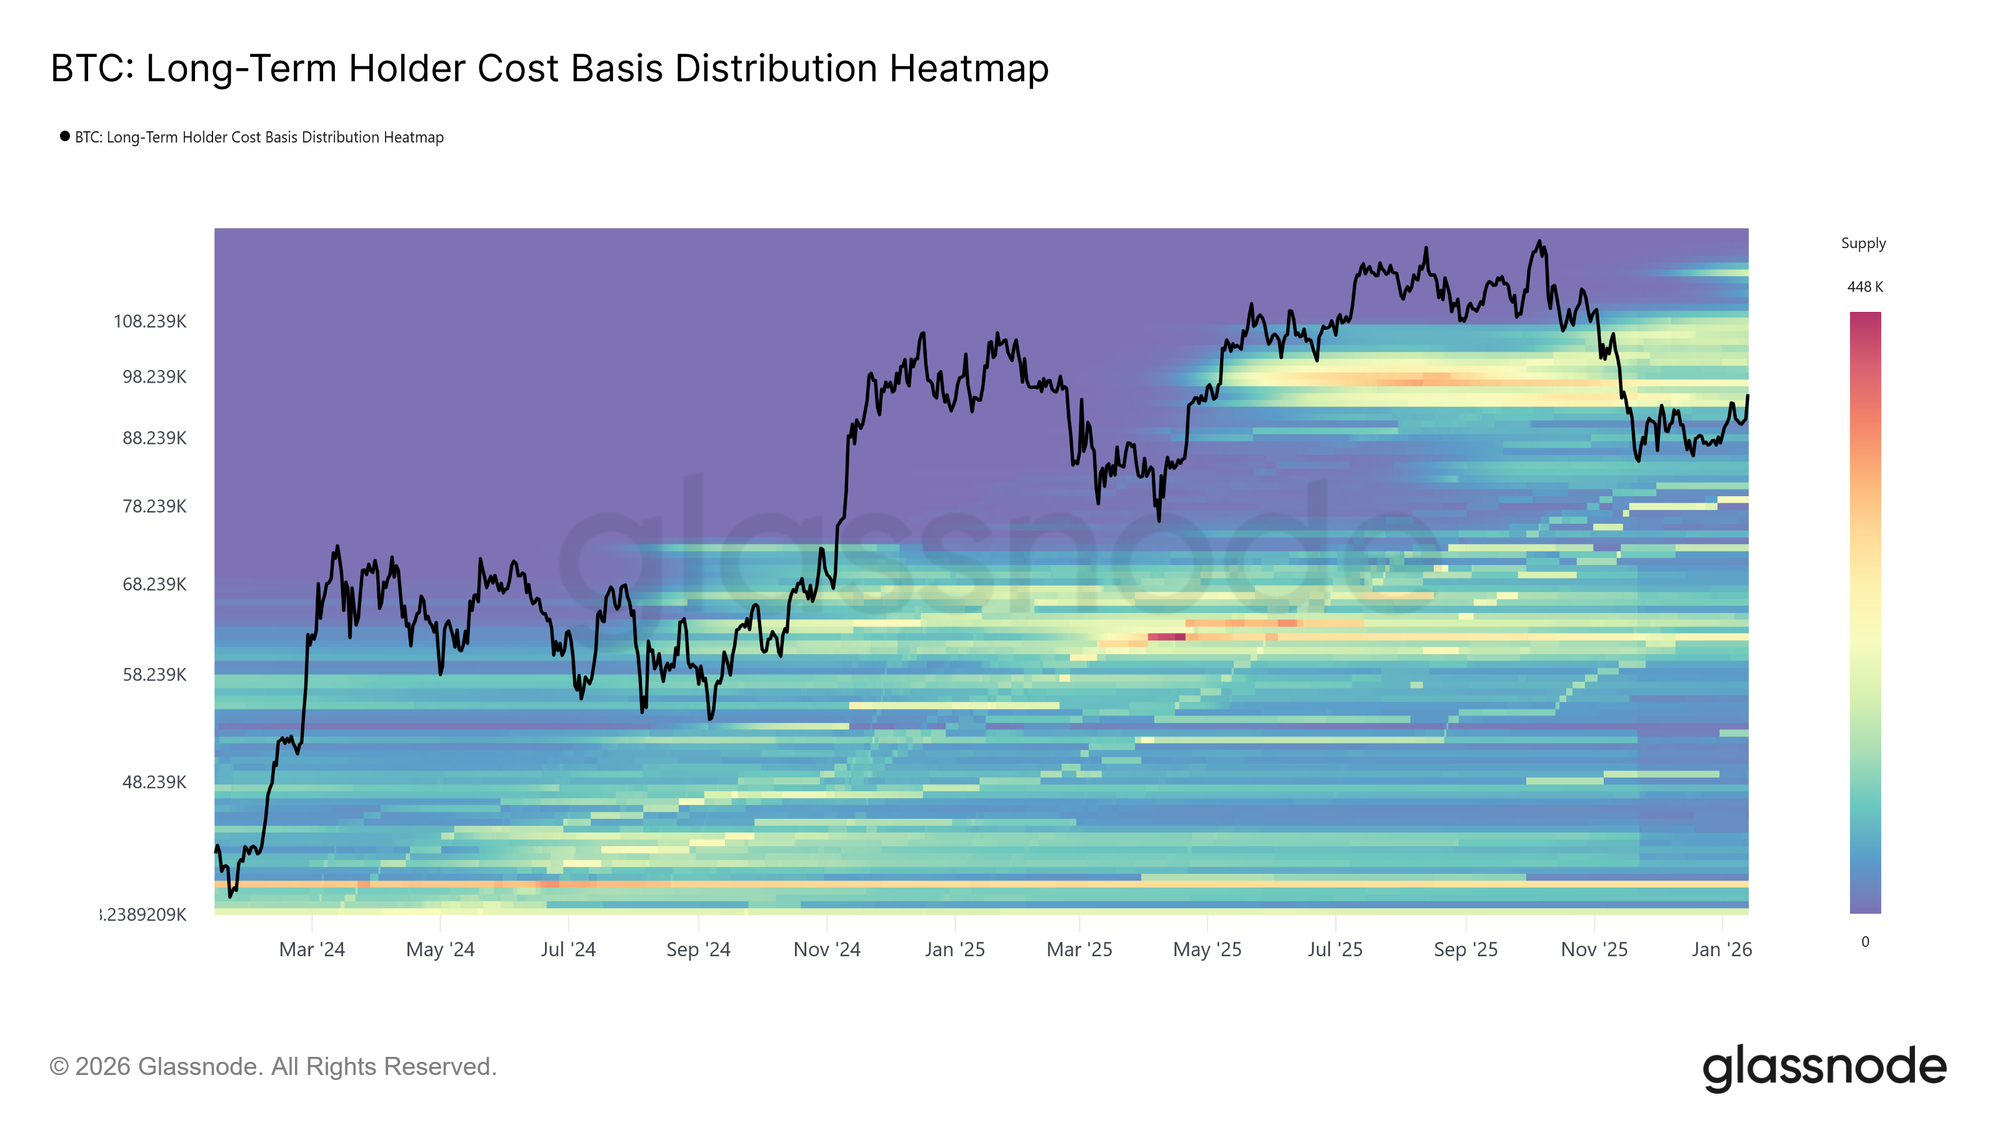
Bitcoin has entered the new year with constructive momentum, posting two consecutive higher highs and extending price to $95.6k. This early-year advance, however, has carried price directly into a historically significant supply zone. The current market level sits within a dense cluster of Long-Term Holder supply accumulated between April and July 2025, a period marked by sustained distribution near cycle highs.

As shown by the Long-Term Holder Cost Basis Distribution Heatmap, rebounds since November 2025 have repeatedly stalled at the lower boundary of this cluster, spanning approximately $93k to $110k. Each attempt higher has encountered renewed sell-side pressure, preventing price from sustaining a structural recovery.

This region has consistently acted as a transition barrier, separating corrective phases from durable bull regimes. With price once again pressing into this overhead supply, the market now faces a familiar test of resilience, where absorbing long-term holder distribution remains a prerequisite for any broader trend reversal.

Live Chart

Confidence at Cost Basis

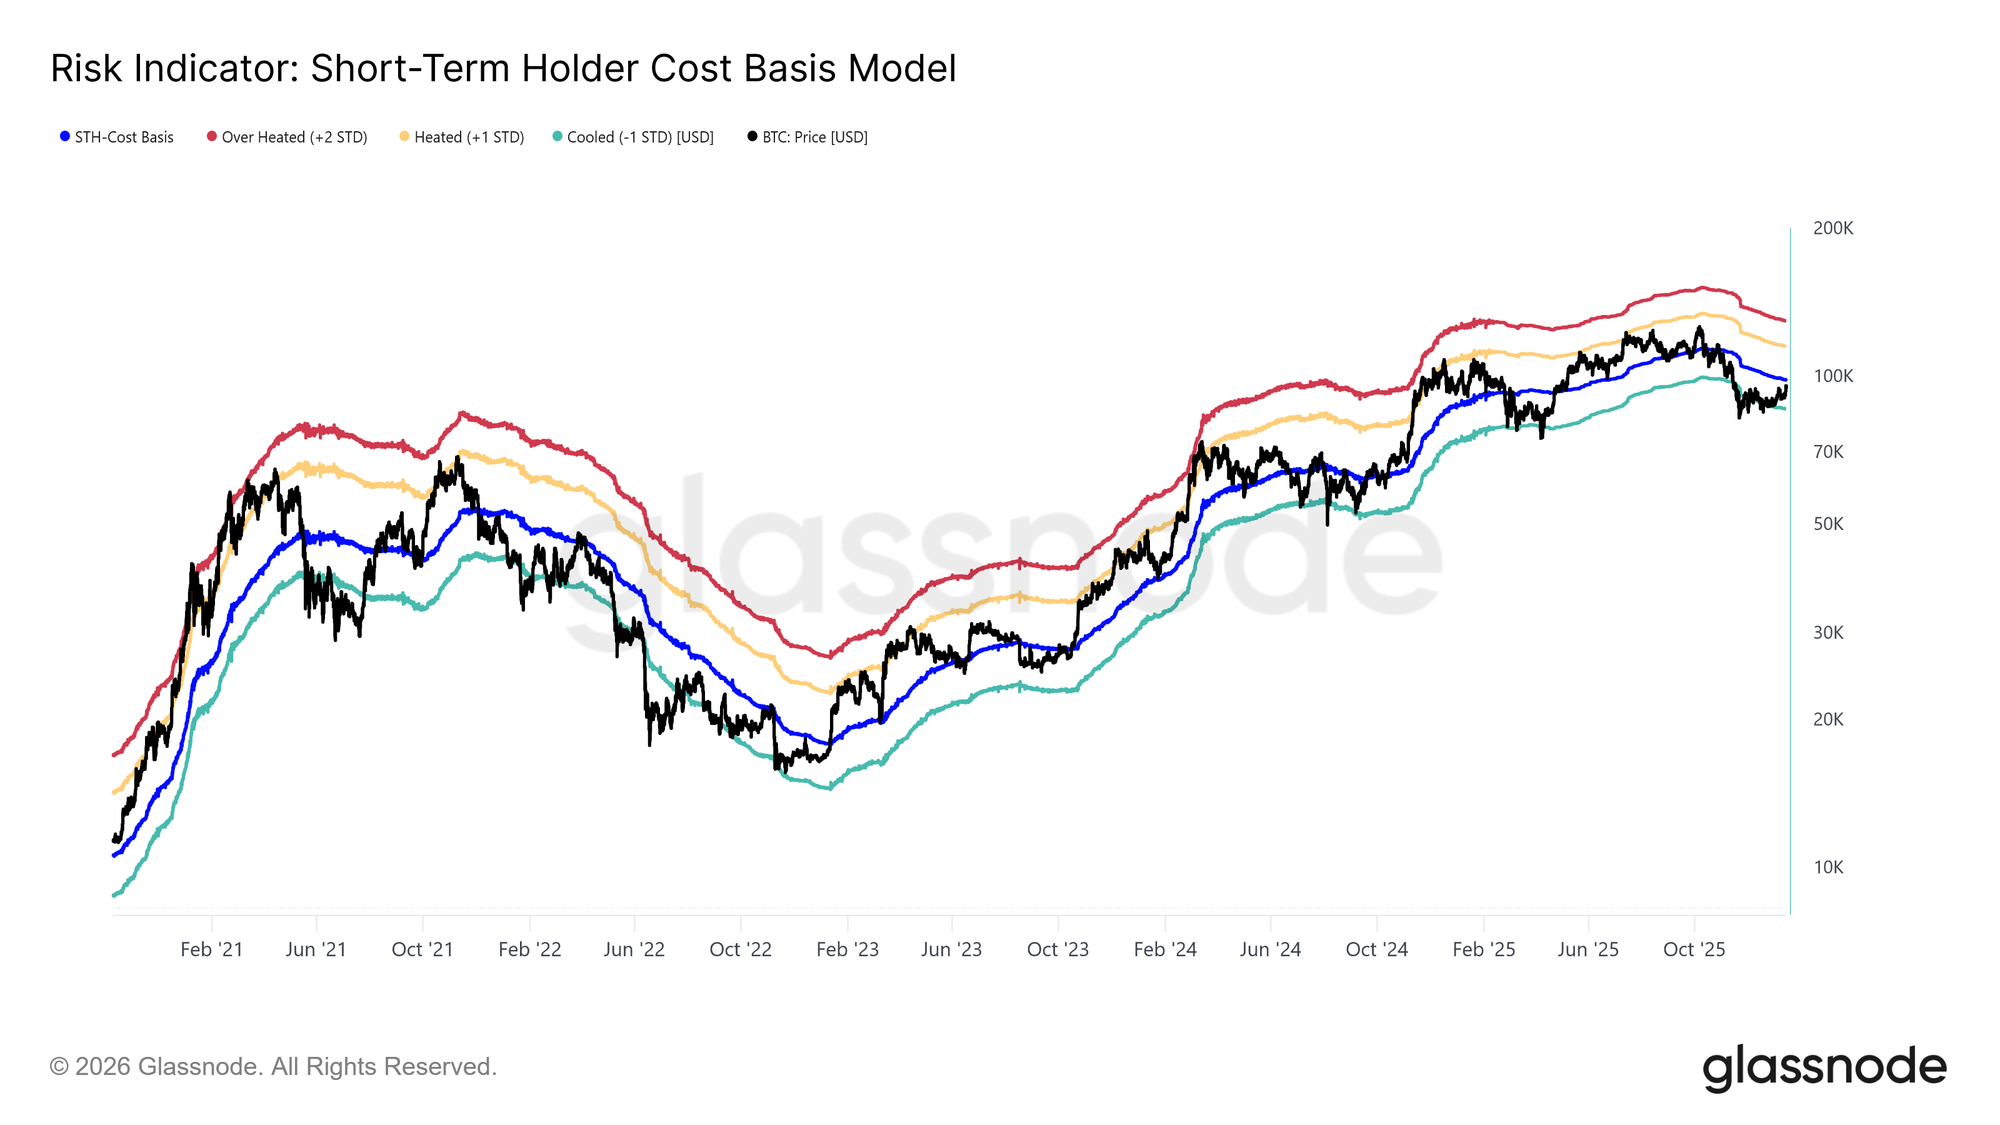
Facing renewed sell-side pressure from top buyers, attention shifts toward the Short-Term Holder cost basis, currently situated at $98.3k. This level represents the aggregate entry price of recent investors and serves as a critical gauge of market confidence. Sustained trading above this threshold would indicate that new demand is absorbing overhead supply, allowing recent buyers to remain profitable.

Historically, reclaiming and holding above the Short-Term Holder cost basis has marked the transition from corrective phases into more durable uptrends. Conversely, repeated failure to stabilize above this level risks reinforcing defensive behaviour among newer participants. As such, the ability of price to consolidate above $98.3k remains a necessary condition for restoring confidence in trend continuation and establishing the foundations for a sustainable rally.

Live Chart

LTH Distribution Slows

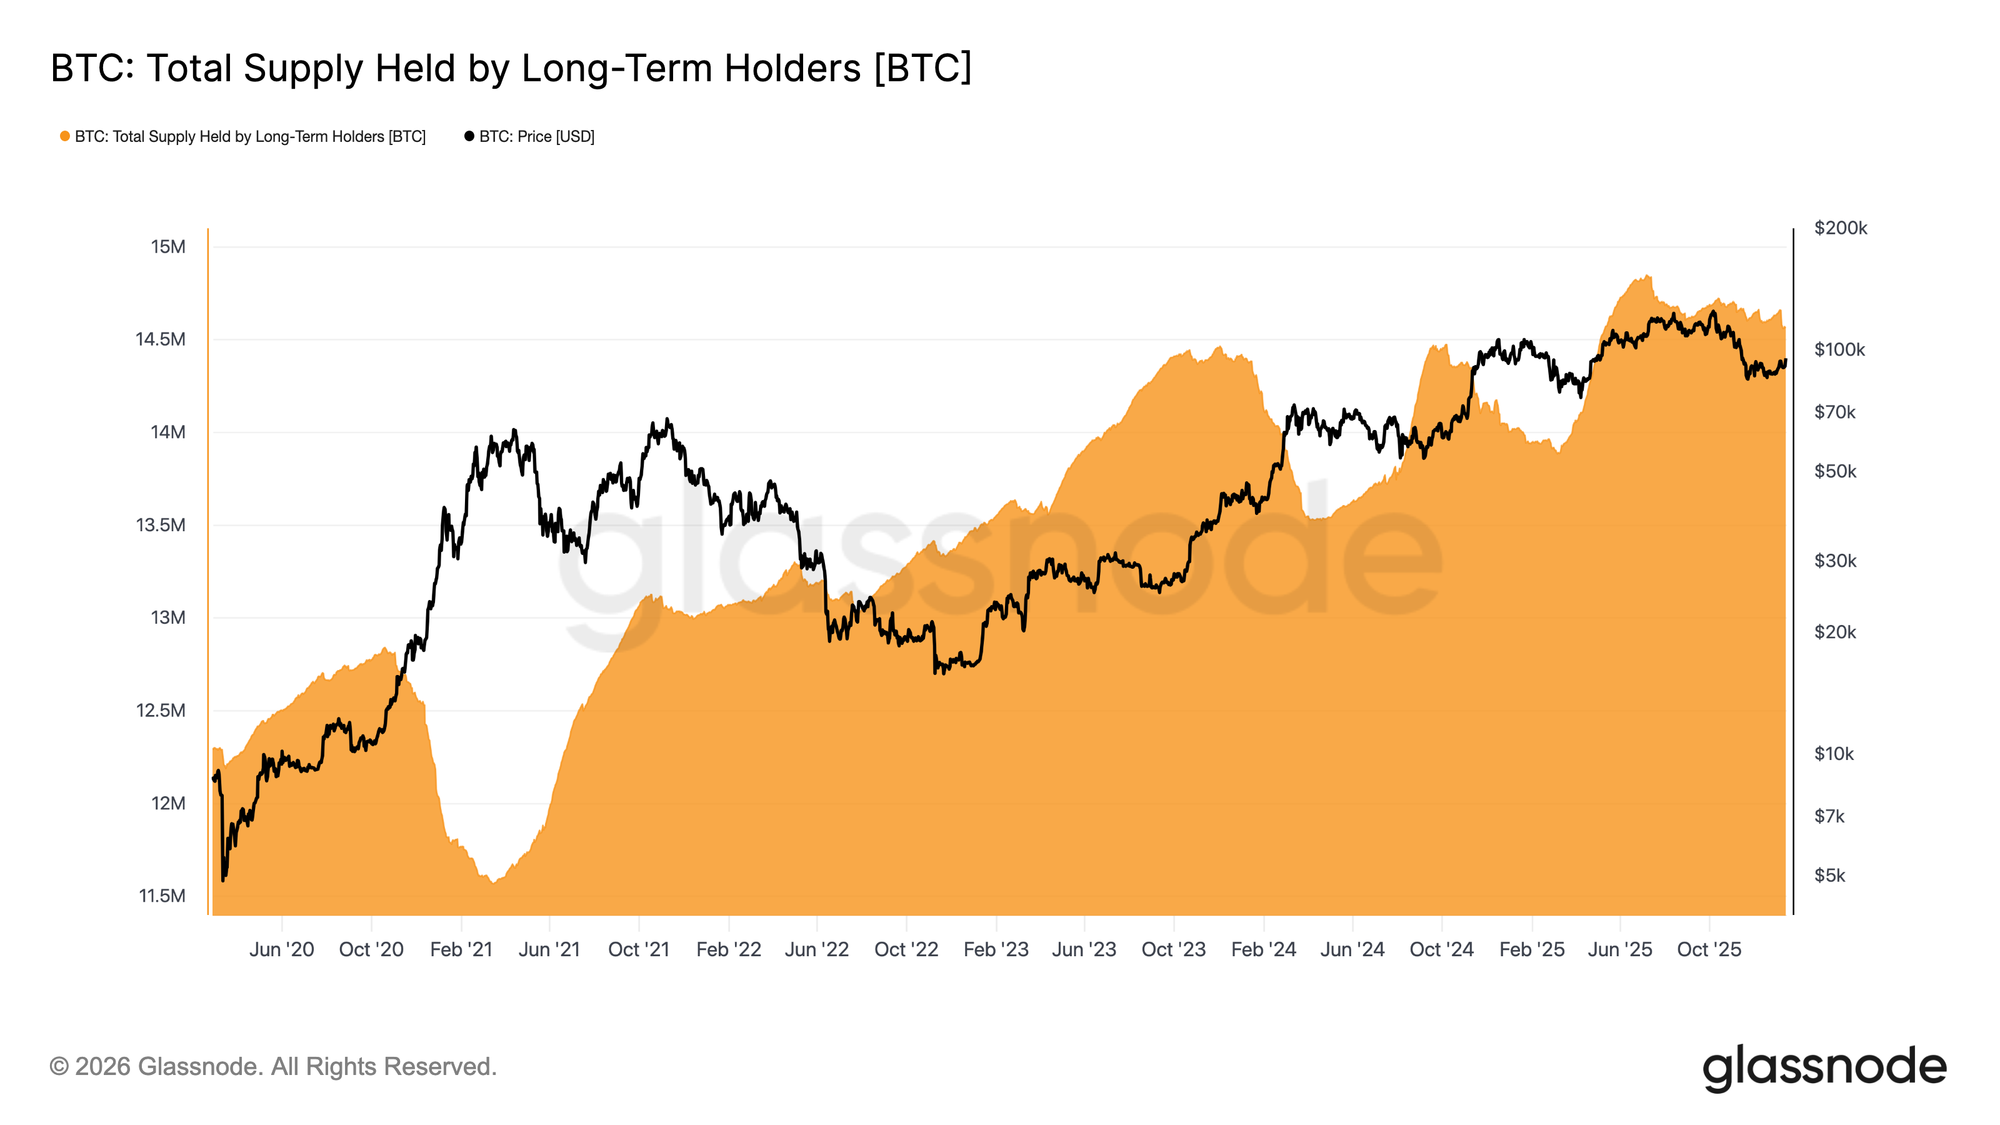
With price pressing into long-term holder supply, focus shifts to whether these investors are accelerating distribution or beginning to ease sell-side pressure. One useful gauge is the Total Supply Held by Long-Term Holders, which reflects the balance between coins maturing beyond the ~155-day threshold and coins being spent.

Currently, Long-Term Holder supply continues to trend lower, but the rate of decline has slowed materially compared to the aggressive distribution seen throughout Q3 and Q4 2025. This indicates that long-term holders remain net sellers, though their selling intensity is moderating.

For a sustainable rally to emerge, the market must transition into a regime where maturation supply outpaces long-term holder spending. Such a shift would push LTH supply higher, a structure last observed during Aug 2022–Sep 2023 and Mar 2024–Jul 2025, both periods that preceded stronger and more durable trend recoveries.

Live Chart

Demand Versus Distribution

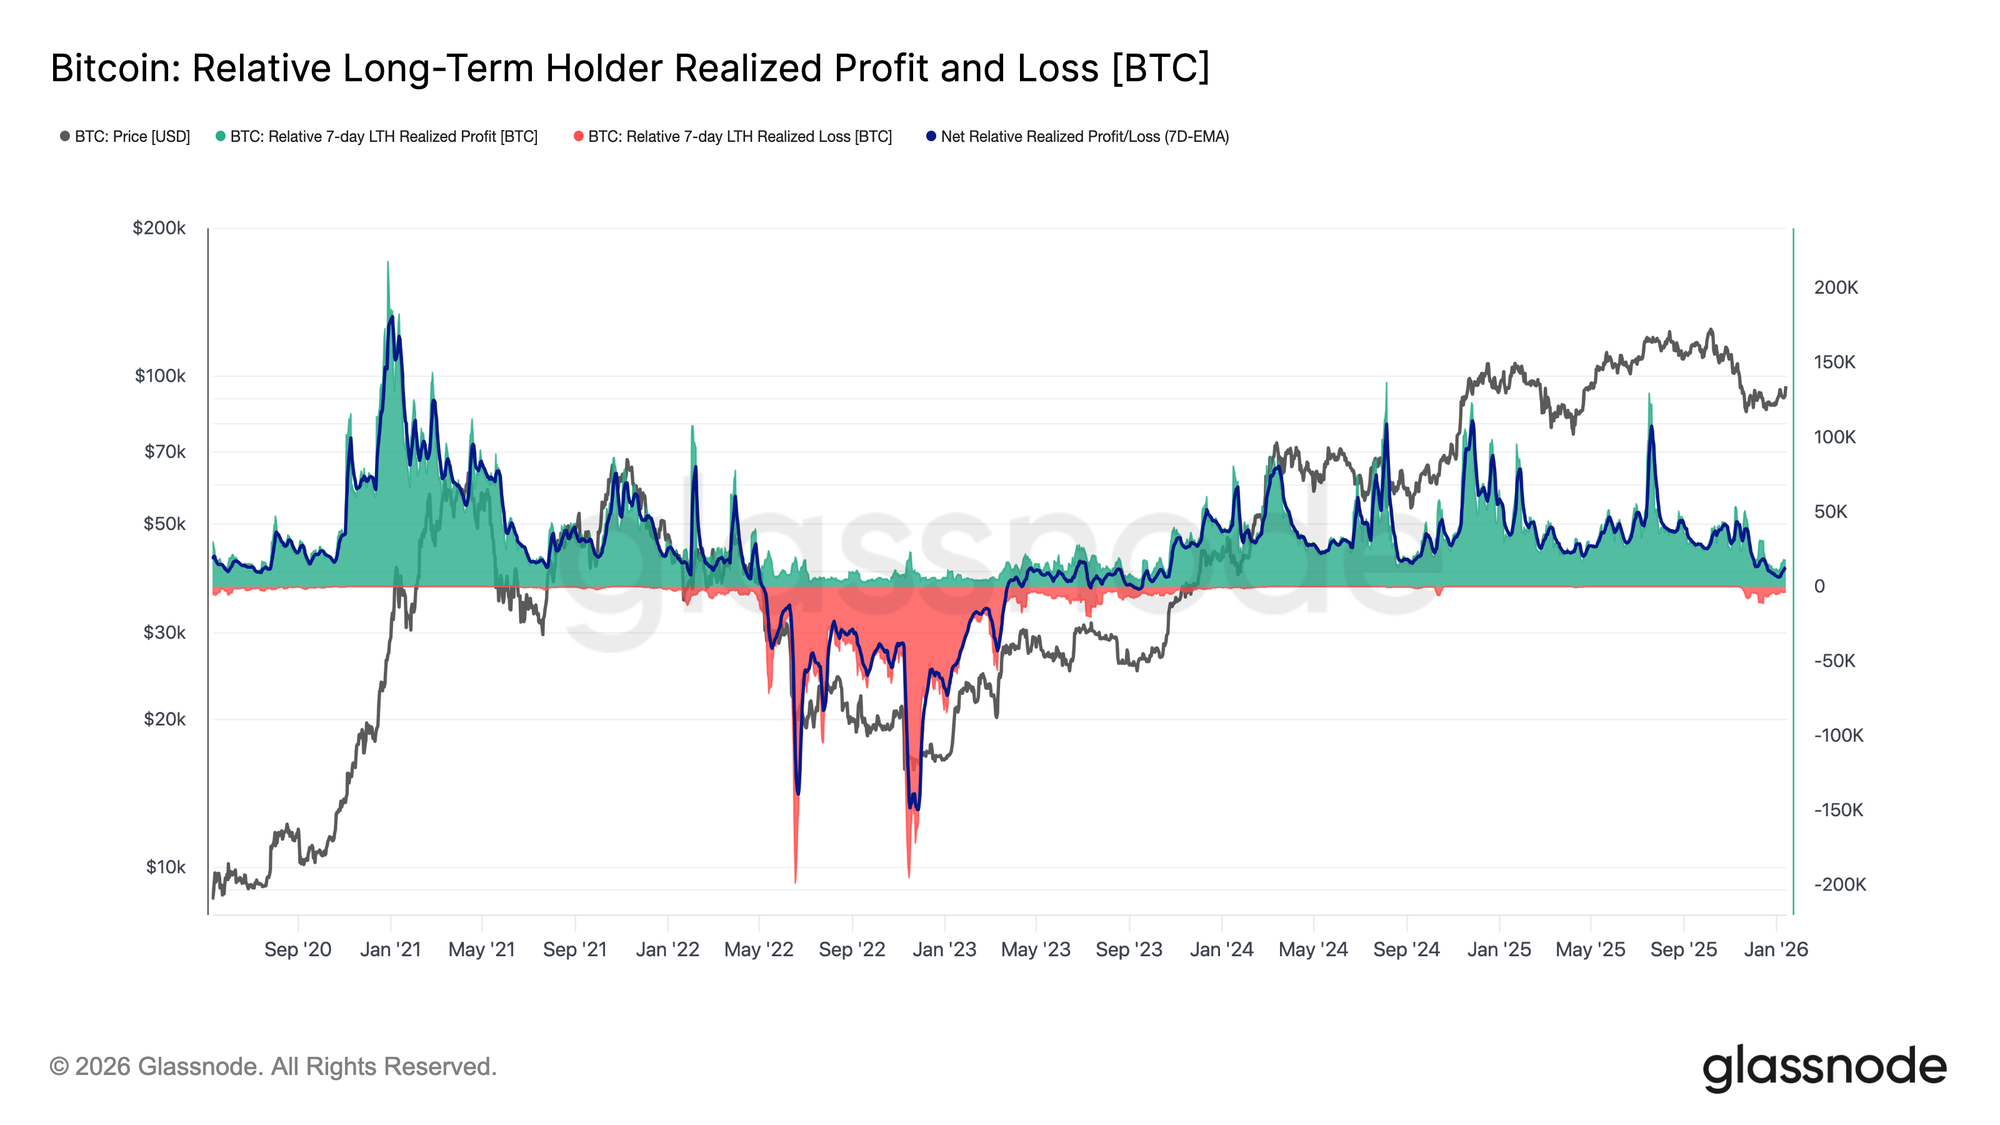
All in all, long-term holders who accumulated during Q2 2025 remain the most likely source of sell-side pressure should price decisively cut through the upper supply cluster. Their behaviour is well captured by the Net Realized Profit and Loss of Long-Term Holders, which currently reflects a markedly cooler distribution regime.

At present, long-term holders are realizing approximately 12.8k BTC per week in net profit, a substantial slowdown compared to the cycle peaks above 100k BTC per week. This moderation suggests profit-taking remains active, but far less aggressive than during prior distribution phases.

What follows will depend primarily on the demand side’s ability to absorb this supply, particularly from investors accumulated over Q2 2025. Failure to hold above the True Market Mean at ~$81k, in the long term, would significantly increase the risk of a deeper capitulation phase, reminiscent of the April 2022 to April 2023 period.

Live Chart

Off-Chain Insights

Institutional Flow Resets

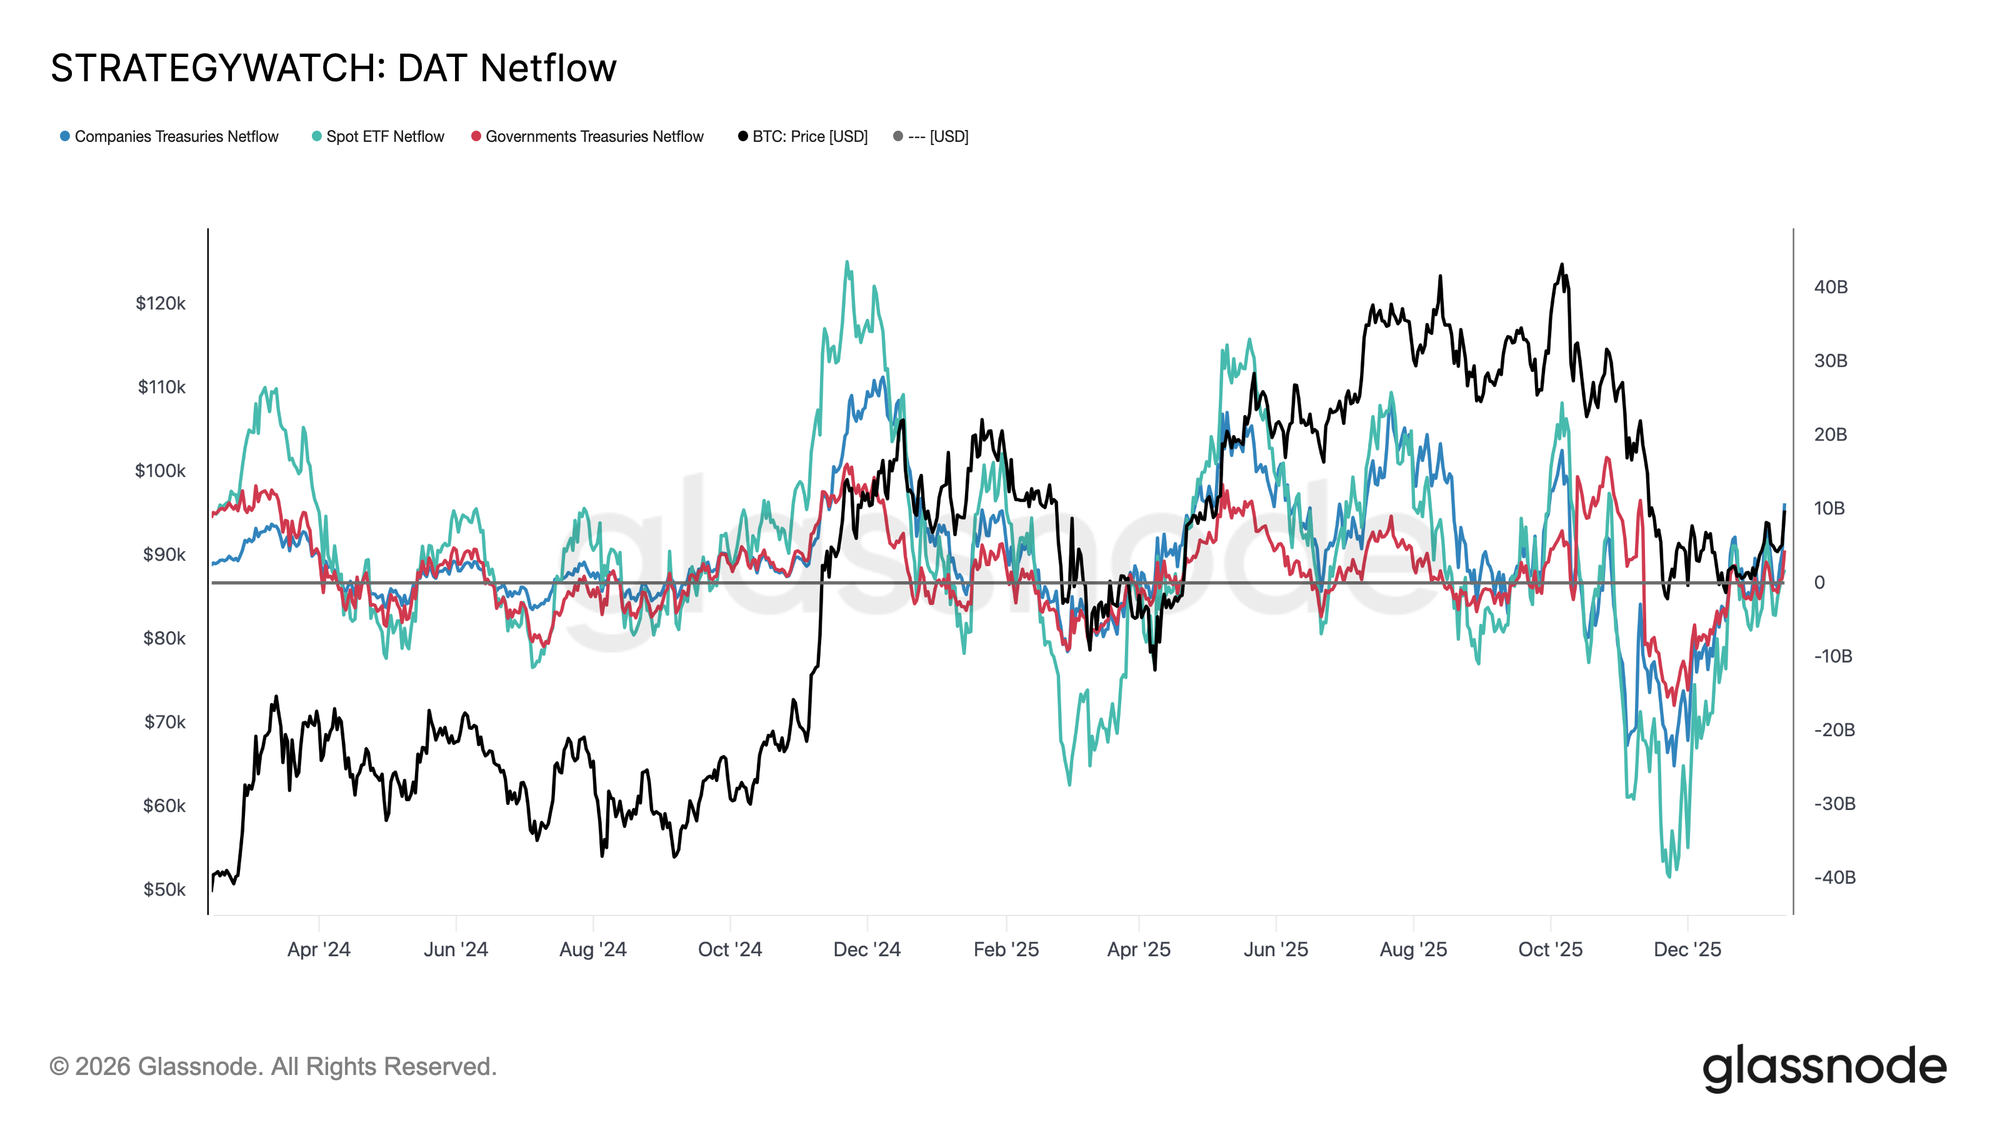
Institutional balance-sheet flows have gone through a full reset over the past few months. After a prolonged period of heavy outflows across spot ETFs, corporates, and sovereign entities, netflows have now stabilised, marking a clear exhaustion of sell-side pressure from long-term structural holders.

Spot ETFs have been the first to turn, moving back into positive territory and re-establishing themselves as the primary marginal buyer. Since their inception, Spot ETFs have played a major role in every expansion phase, and their renewed inflows suggest that real-money allocators are once again beginning to rebuild exposure rather than simply trading volatility.

Corporate and sovereign treasury flows have also flattened out, with inflows appearing sporadically around consolidation phases. However, accumulation remains uneven and event-driven rather than consistent.

In this environment, balance-sheet demand is acting more as a price stabiliser than a growth engine, leaving near-term direction increasingly sensitive to derivatives positioning and short-term liquidity conditions.

Live Chart

Spot Flows Turn Constructive

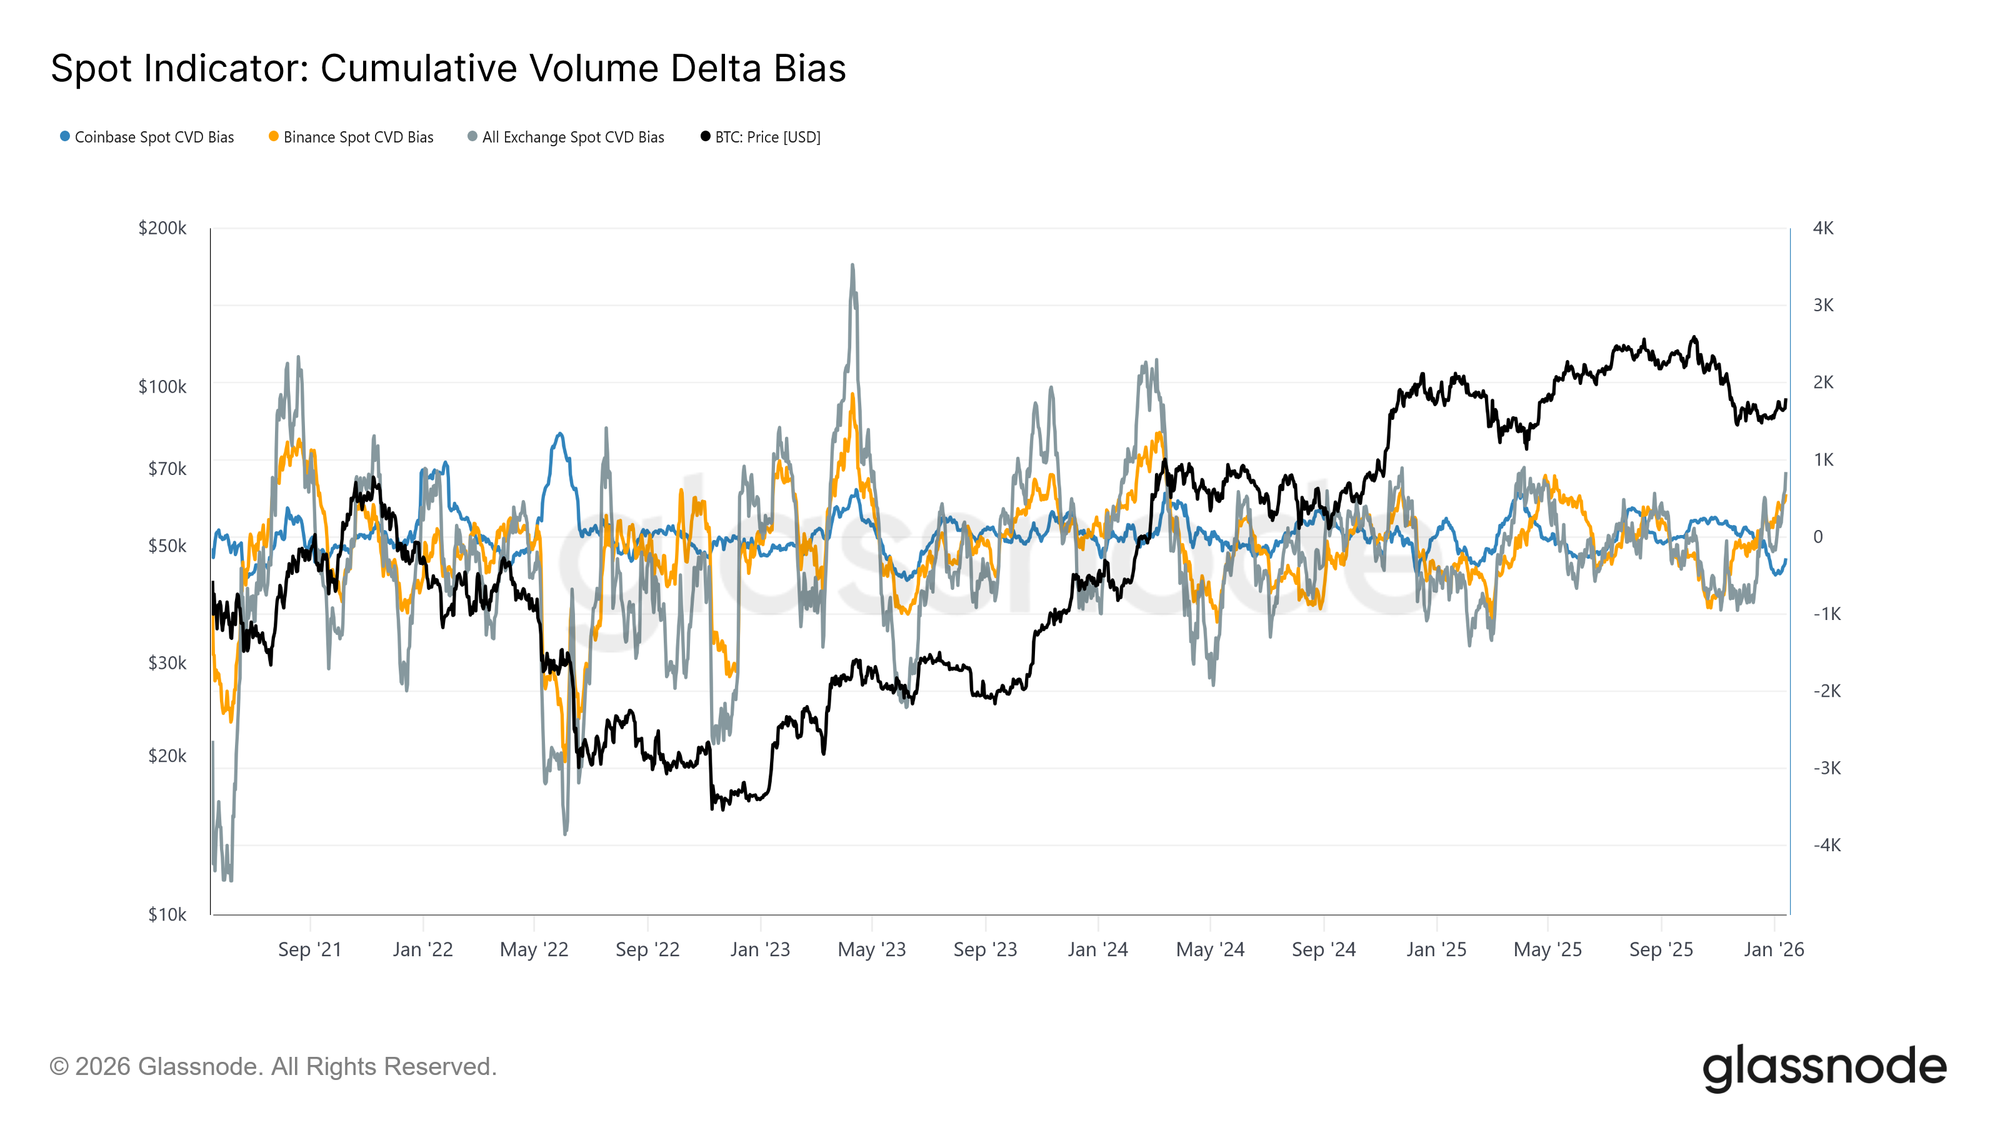
Spot market behaviour has begun to improve following the recent drawdown, with Binance and aggregate exchange CVD measures transitioning back into a buy-dominant regime. This reflects a shift away from persistent sell-side pressure and signals that market participants are once again absorbing supply rather than distributing into strength.

At the same time, Coinbase, which has been the most consistent source of sell-side aggression throughout the consolidation, has meaningfully slowed its selling activity. The easing of Coinbase-led distribution has removed a key source of overhead supply, helping to stabilise price and clear the way for the ongoing rally.

While spot participation is not yet displaying the persistent, aggressive accumulation typically seen during full trend expansion phases, the transition back into a net-buying posture across major venues represents a constructive structural shift.

Live Chart

Futures Traders Squeeze Shorts

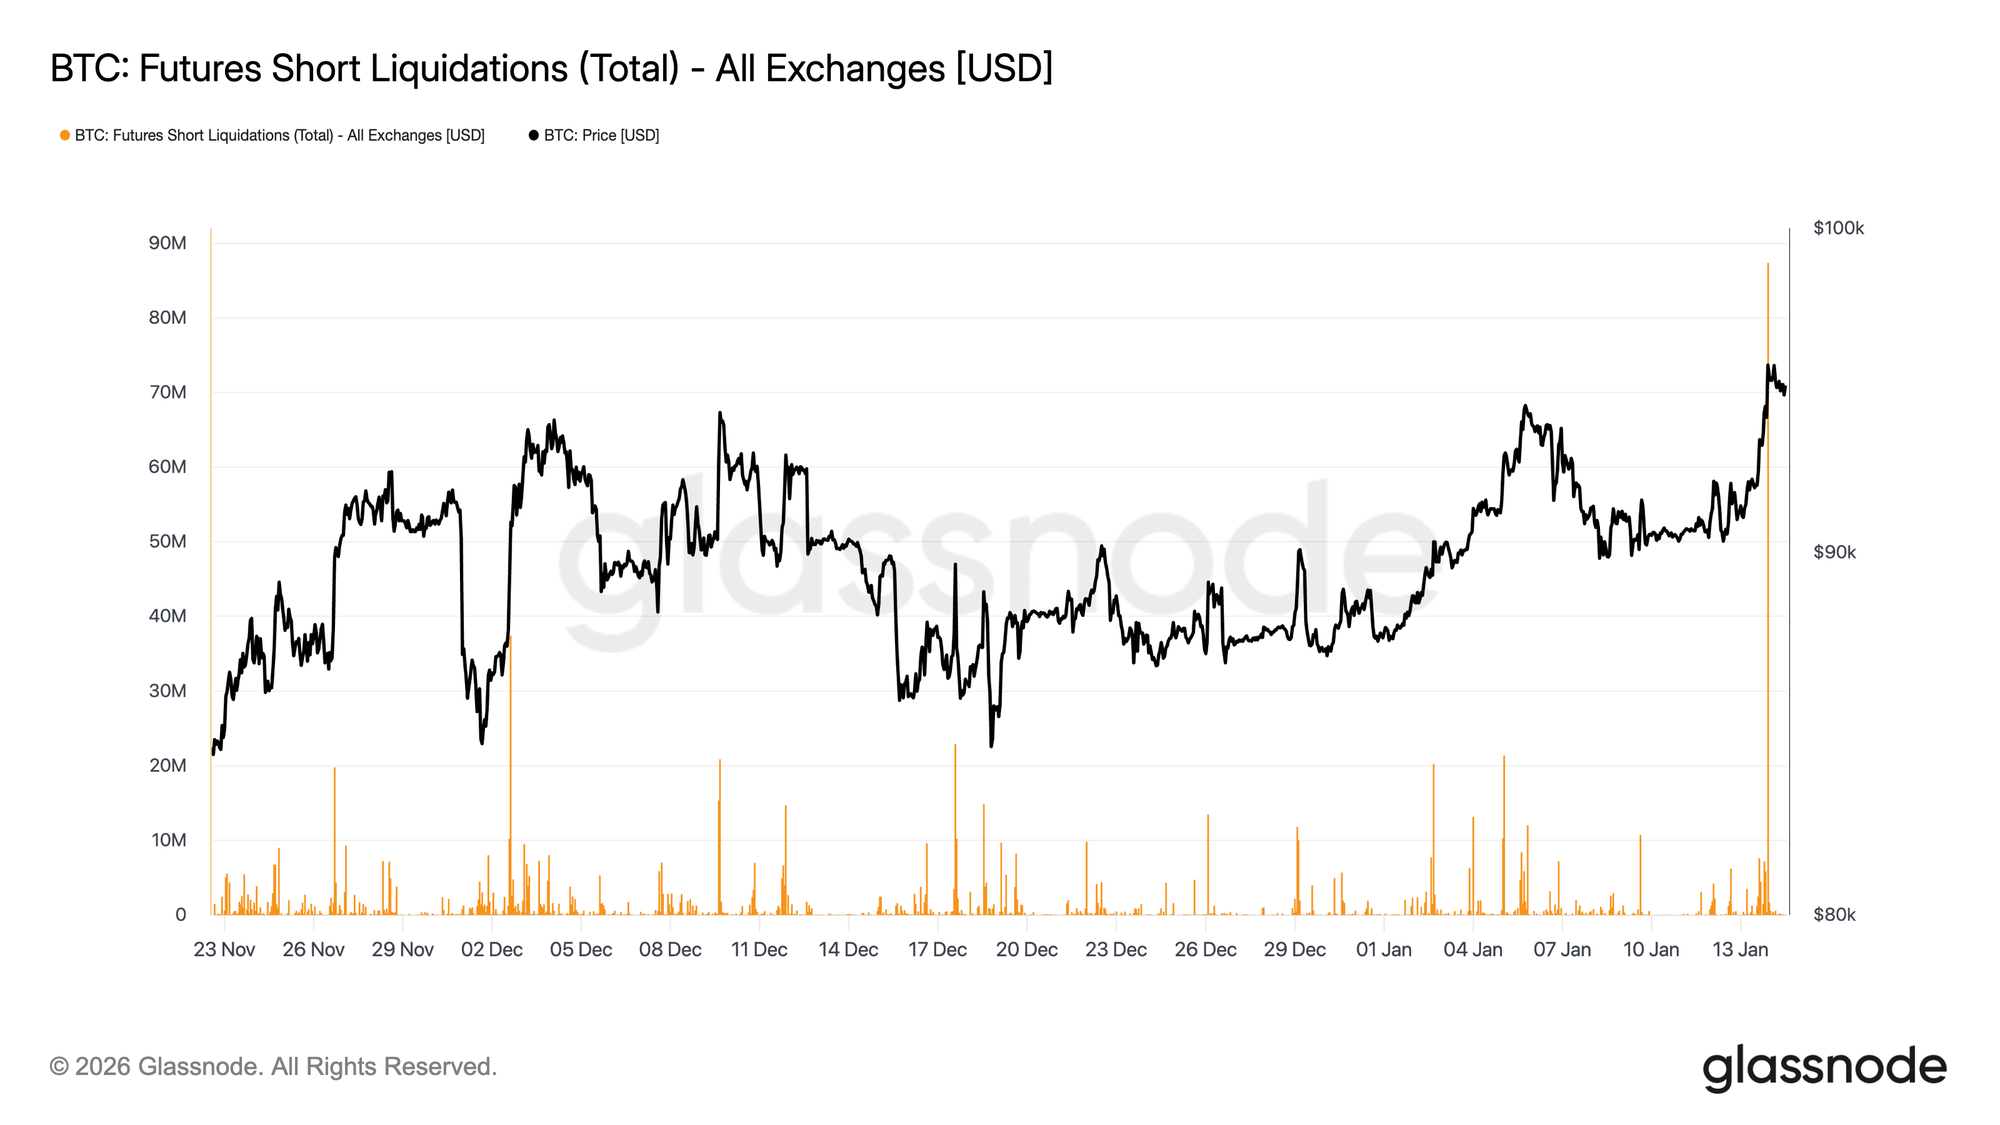
While the push into the $96K region was mechanically reinforced by short liquidations, it also unfolded on relatively thin derivatives volume. Futures turnover has remained well below the elevated activity seen throughout most of 2025, even as prices reclaimed higher levels.

This indicates that the breakout occurred in a comparatively light liquidity environment, where modest positioning shifts were able to drive disproportionately large price responses. In practical terms, it did not take significant new capital to force shorts out of the market and lift price through resistance.

This leaves the market reliant on whether spot demand and sustained volume can now step in to support continuation, or whether the rally risks fading once the mechanical buying pressure from forced covering is exhausted.

Live Chart

Low Volatility, Unresolved Risk

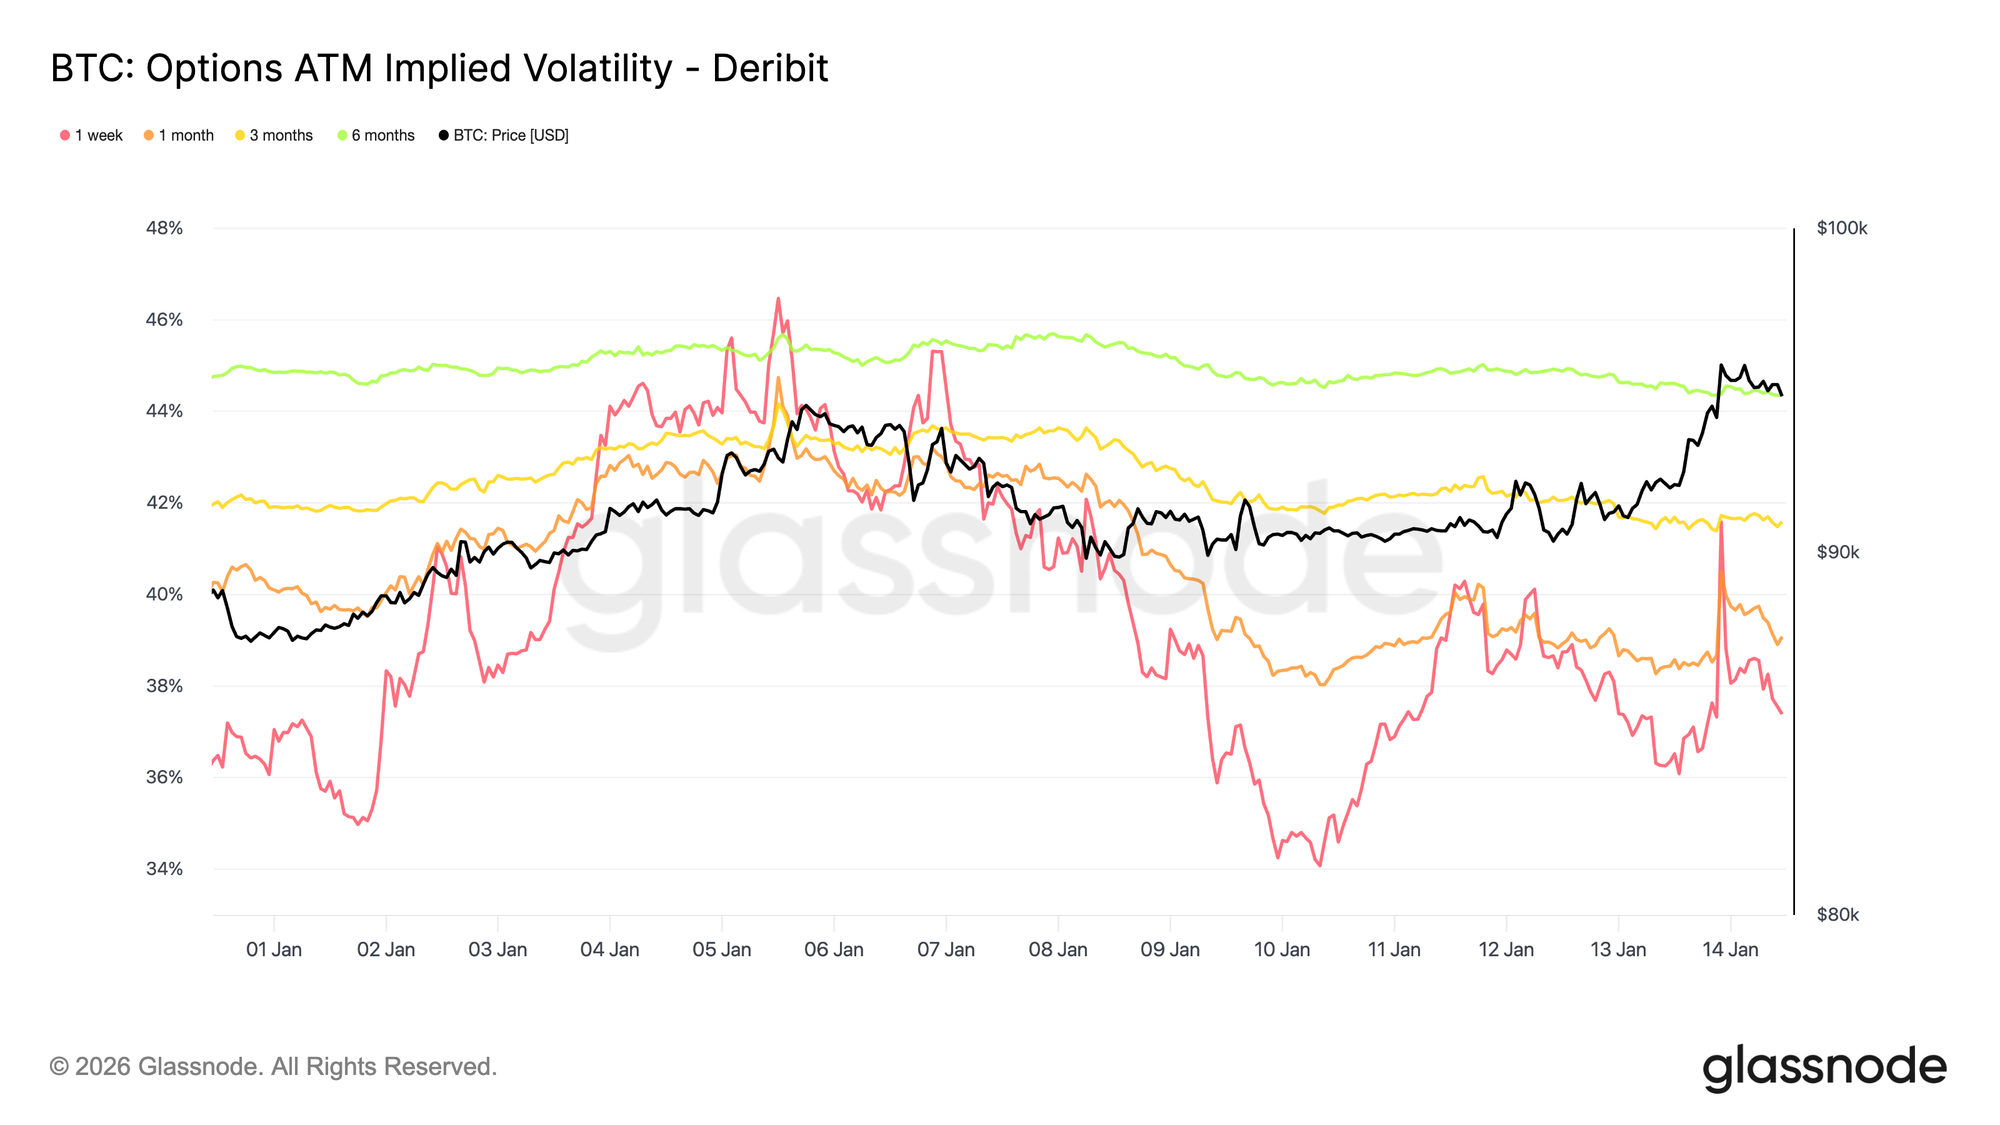
Implied volatility remains low across the curve, reinforcing the calm observed in recent price action. Longer-dated maturities have been drifting modestly lower, while short-dated implied volatility reacts more directly to spot moves. Those front-end reactions, however, fail to propagate up the curve, indicating limited demand for near-term convexity.

This is not a signal that uncertainty has disappeared. Rather, it suggests that risk is being deferred. The options market is not expressing confidence, but a view that any meaningful repricing is more likely to occur later than immediately.

Volatility increases gradually with maturity, pointing to uncertainty being assigned to time rather than to a specific near-term catalyst. The term structure is adjusting in level, not shape, consistent with a market that expects short-term stability while remaining exposed to latent risk.

This matters because volatility suppressed by positioning rather than clarity tends to reprice abruptly when conditions change.

Live Chart

Downside Asymmetry Remains Firmly Priced

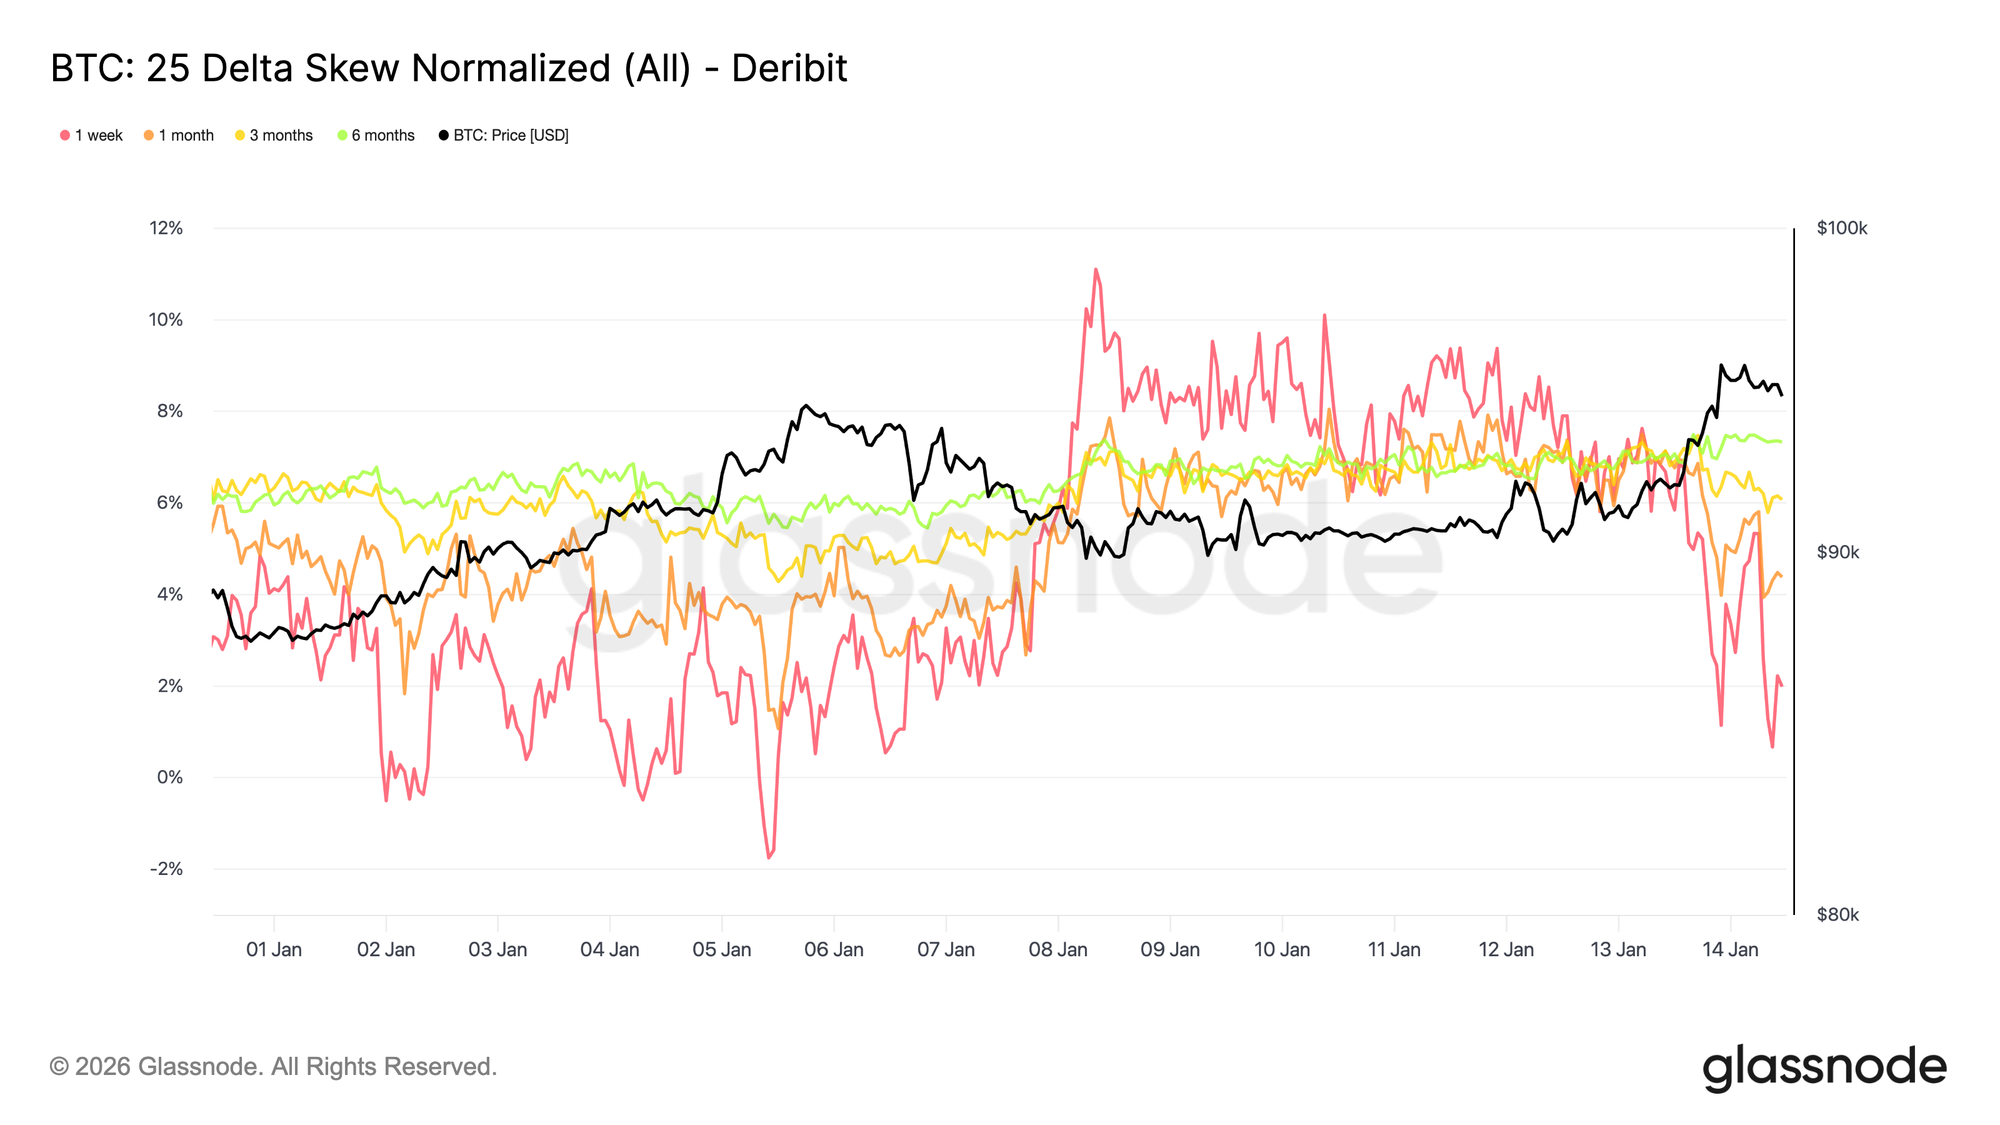
While overall volatility remains low, skew continues to price downside risk. The 25 delta skew stays biased toward puts, particularly in mid and longer maturities, pointing to persistent demand for longer-dated downside protection even as spot stabilizes and reclaims the 95K level.

This reflects a market that is comfortable carrying exposure but unwilling to do so without insurance. Protection is being maintained rather than aggressively added, signaling caution rather than stress. Short-dated skew briefly moved toward balance before rotating back in favor of puts, while longer-dated skew has shown little reaction to the move back above 95K.

The coexistence of low volatility and negative skew highlights a key tension. Participants are not positioning for immediate downside, but they continue to pay for asymmetric protection.

That combination is typical of range-bound markets where risks are acknowledged but not expected to materialize immediately.

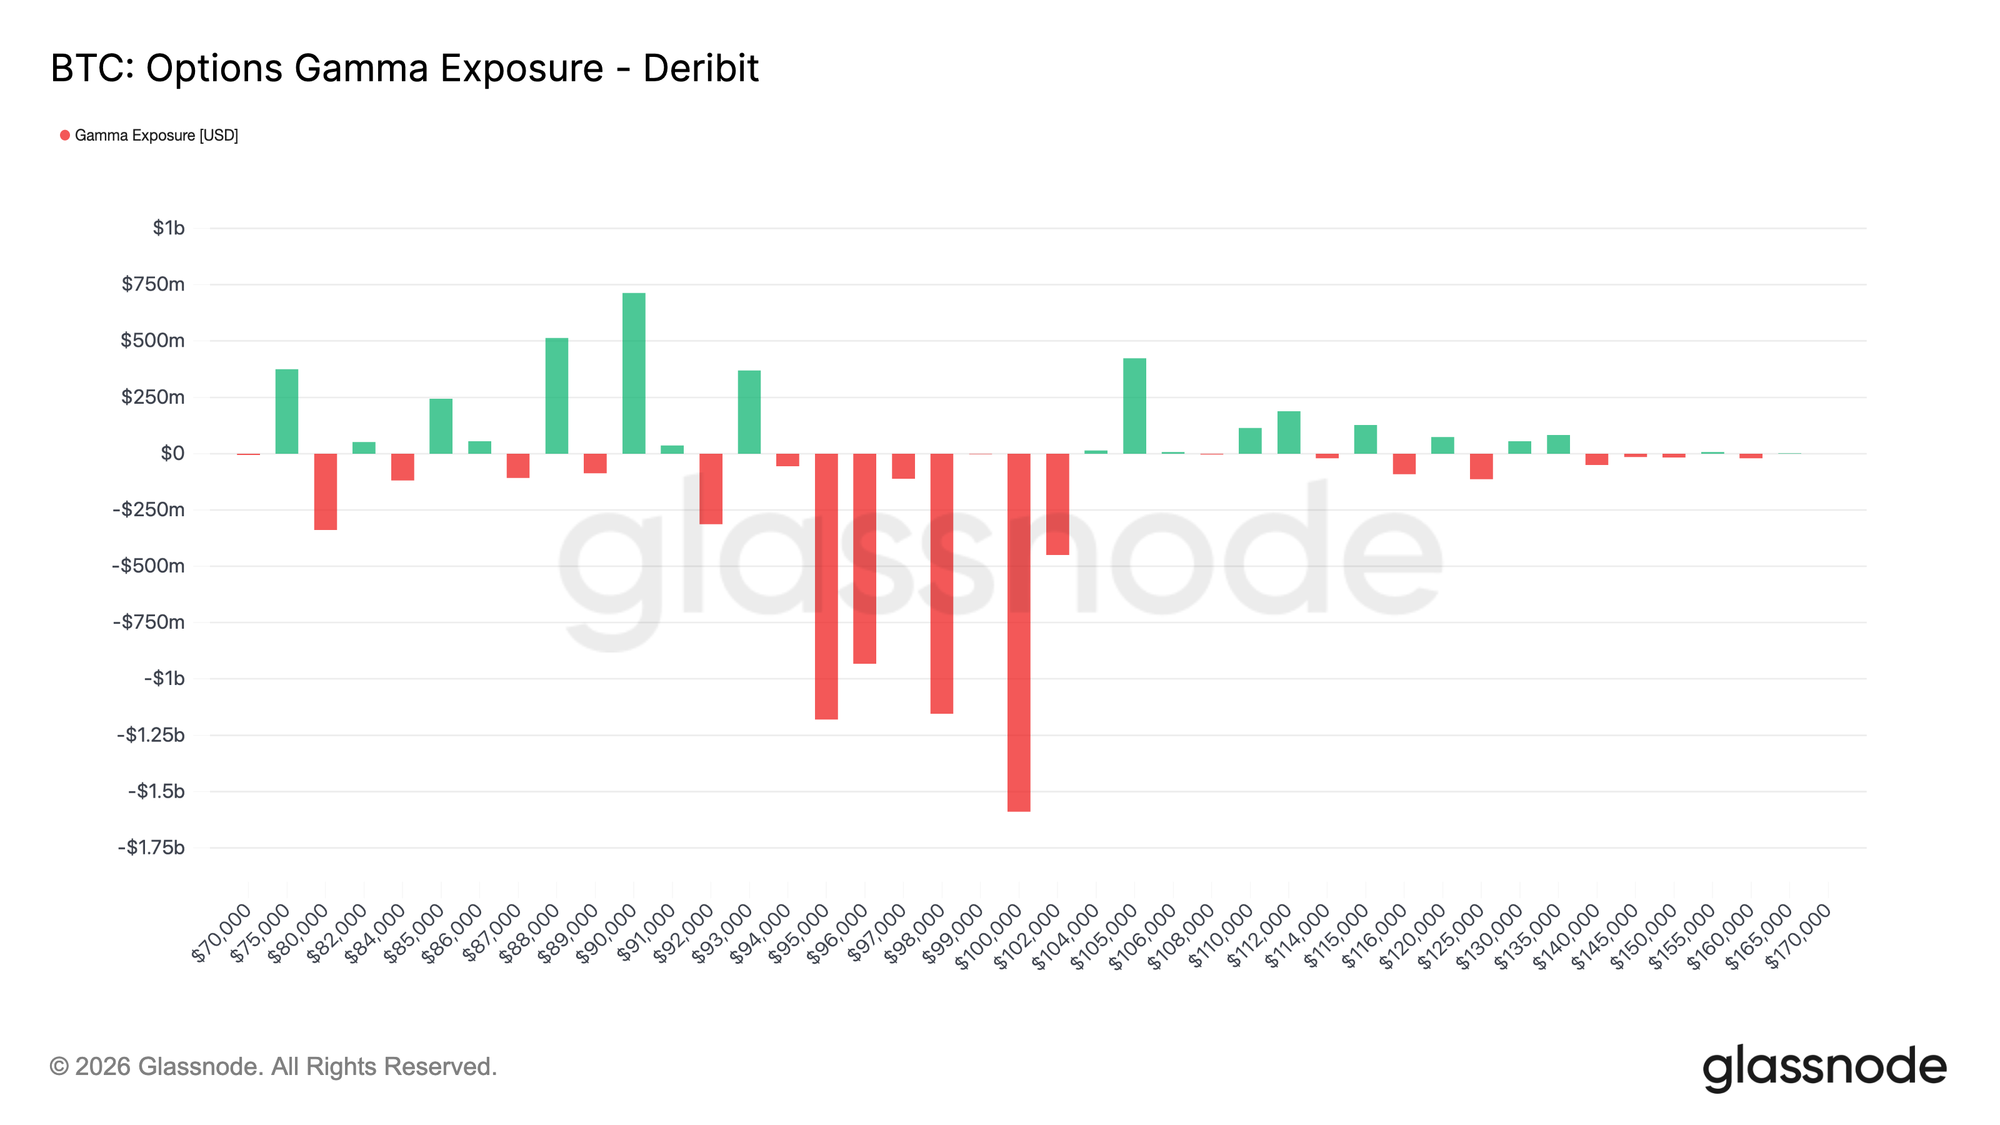
Short Gamma and Fragile Stability

The current strike distribution places dealers short gamma around spot, altering the market’s short-term dynamics. In a short gamma environment, hedging flows no longer absorb price moves. Instead, they tend to reinforce them, with dealers buying into rising prices and selling into declines.

With spot trading around the 95–96K area at the time of writing, price has moved into a short gamma zone that extends roughly from 94K to 104K. Within this range, sustained price action supported by volume is more likely to trigger directional hedging flows, increasing the potential for faster movement toward nearby high-interest strikes, including the 100K level.

This structure creates a fragile form of stability. Volatility can remain low while price is contained, but once momentum develops, moves are more likely to accelerate than fade. In this context, calm price behavior reflects positioning rather than balance, leaving the market more exposed to abrupt repricing than gradual adjustment.

Live Chart

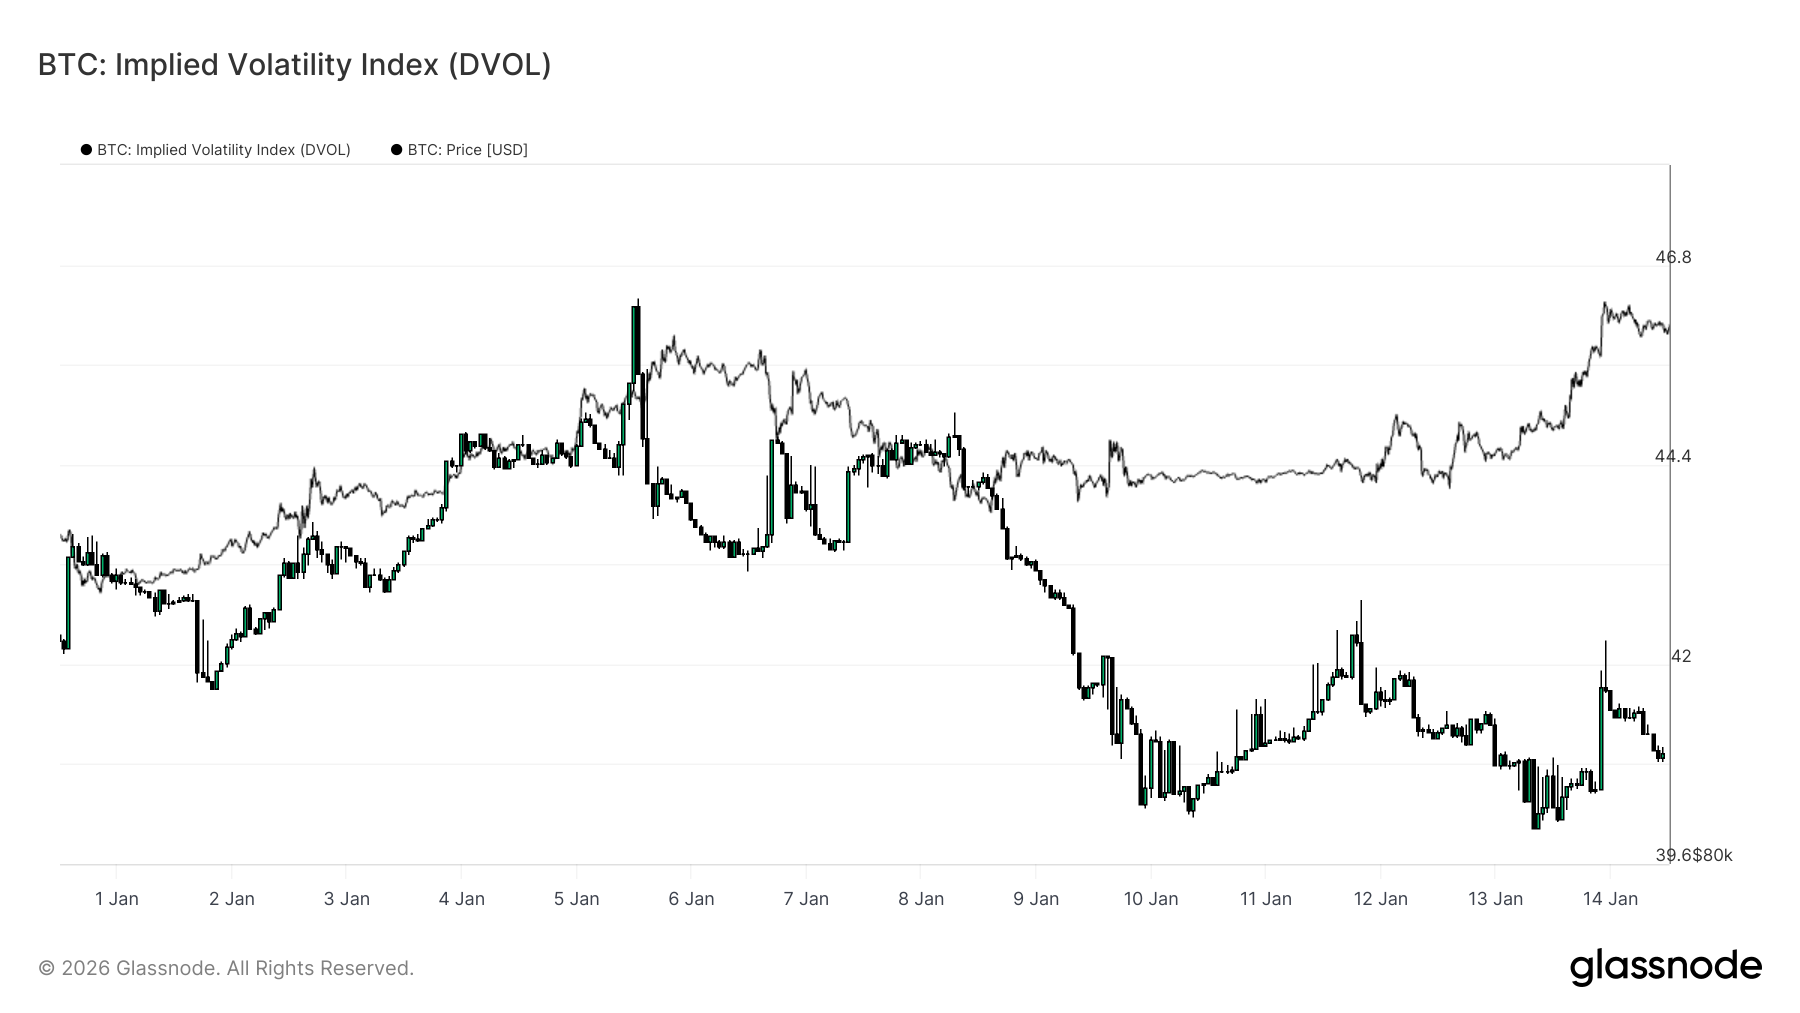
DVOL Confirms Volatility Is Being Deferred

The Implied Volatility Index (DVOL) provides a surface-wide view of option-implied uncertainty by aggregating volatility across strikes and maturities. Unlike at-the-money implied volatility, which reflects pricing at a specific point on the curve, DVOL captures how much volatility the market is embedding overall.

At present, DVOL remains relatively low and range-bound, even as spot has moved through key levels. This confirms what the term structure and skew already suggest: the options market is not paying up for immediate volatility. Uncertainty is acknowledged, but it is not being expressed through higher aggregate volatility pricing.

Importantly, this low DVOL reading coincides with downside-biased skew and short gamma positioning near spot. Volatility is therefore not being compressed by stabilizing hedging flows, but simply deferred at the surface level. This combination creates conditions where volatility can remain dormant, yet reprice sharply once a catalyst forces positioning to adjust.

Live Chart

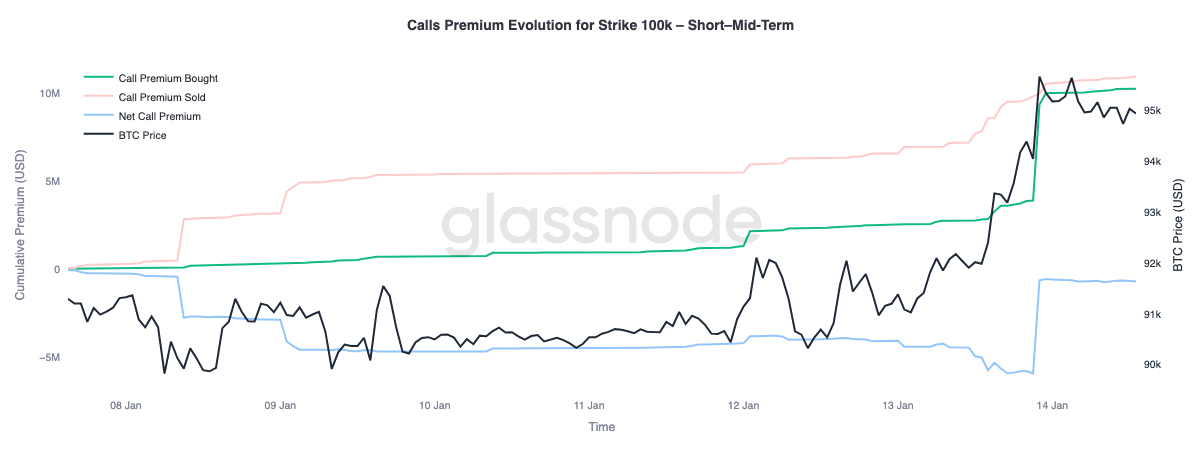
Call Premium Signals Conditional Upside

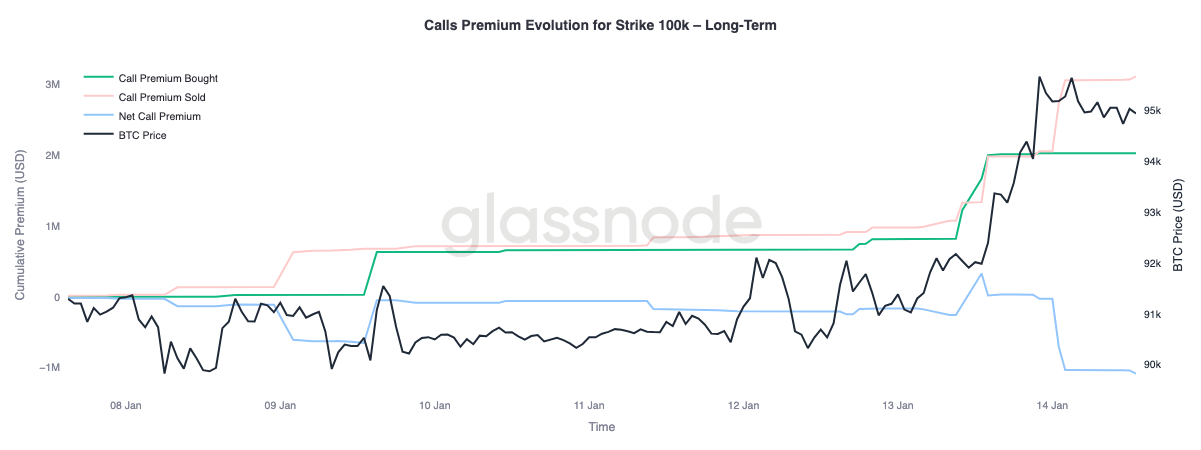
A closer look at the premium behavior of the 100K call strike highlights a clear divergence across maturities. This level remains the next major psychological threshold, and option flows show how the market is positioning around it.

In short to mid-term maturities, up to roughly three months, call premium bought has significantly outweighed call premium sold. This imbalance has driven net call premium higher, indicating active demand for near-dated upside exposure as spot approaches the level. In contrast, longer-dated maturities show the opposite behavior. As spot rallied, richer call premiums further out the curve were used as opportunities to sell upside.

This split suggests the market is positioning for a potential retest of the 100K area, while simultaneously expressing hesitation about sustained acceptance above that level over longer horizons. Upside is being targeted tactically in the near term, but monetized at longer maturities.

Conclusion

Bitcoin has entered a transitional phase marked by stabilising structural flows, improving spot behaviour, and a derivatives complex still shaped by deferred volatility risk. Long-term holder distribution has slowed, institutional balance-sheet flows have stabilised, and spot markets have begun to shift back into buy-dominant regimes, suggesting that much of the late-2025 sell-side pressure has now been absorbed.

However, the recent move into the $96K region was driven more by mechanical positioning dynamics than broad-based organic demand. Futures liquidity remains thin, and spot participation, while improving, has yet to show the persistent accumulation typically seen during full trend expansion.

Looking ahead to Q1, the underlying setup appears increasingly constructive. With sell pressure easing and volatility risk deferred rather than discharged, relatively modest inflows may once again generate outsized price responses. If spot accumulation and ETF-led institutional demand continue to rebuild, the current consolidation phase may serve as a base for renewed trend expansion.

Perguntas relacionadas

QWhat is the key supply zone that Bitcoin's price has entered, and why is it significant?

ABitcoin's price has entered a historically significant supply zone between approximately $93k and $110k, where a dense cluster of Long-Term Holder supply was accumulated between April and July 2025. This region has consistently acted as a transition barrier, stalling rebounds and preventing a structural recovery due to renewed sell-side pressure.

QWhat does the Short-Term Holder cost basis represent, and why is it critical for market confidence?

AThe Short-Term Holder cost basis, currently at $98.3k, represents the aggregate entry price of recent investors. It serves as a critical gauge of market confidence because sustained trading above this level indicates new demand is absorbing overhead supply, allowing recent buyers to remain profitable. Historically, reclaiming and holding above this level marks the transition from corrective phases into durable uptrends.

QHow has Long-Term Holder distribution behavior changed, and what is required for a sustainable rally?

ALong-Term Holder distribution has slowed materially compared to the aggressive selling in Q3 and Q4 2025, though they remain net sellers. For a sustainable rally to emerge, the market must transition into a regime where maturation supply (coins maturing beyond ~155 days) outpaces long-term holder spending, which would push LTH supply higher—a structure observed in periods preceding stronger trend recoveries.

QWhat role do institutional balance-sheet flows play in the current market environment?

AInstitutional balance-sheet flows have stabilized after a period of heavy outflows, with spot ETFs turning positive and acting as the primary marginal buyer. However, this demand is currently acting more as a price stabilizer than a growth engine, making near-term direction increasingly sensitive to derivatives positioning and short-term liquidity conditions.

QHow does the current derivatives market structure, particularly short gamma and low volatility, impact price stability?

AThe derivatives market is characterized by short gamma positioning near spot (approx. 94k–104k range) and low implied volatility, which defers risk rather than eliminates it. This creates fragile stability: while volatility remains low in calm conditions, hedging flows can reinforce price moves once momentum develops, leading to abrupt repricing rather than gradual adjustments.

Leituras Relacionadas

The Second Half of Macro Influencer Fu Peng's Career

Fu Peng, a prominent Chinese macroeconomist and former chief economist of Northeast Securities, has joined Hong Kong-based digital asset management firm Bitfire Group (formerly New Huo Group) as its chief economist. This move, announced in April 2026, triggered an 11% surge in Bitfire's stock price. Fu, known for his accessible macroeconomic commentary and large social media following, will focus on integrating digital assets into global asset allocation frameworks, particularly combining FICC (fixed income, currencies, and commodities) with cryptocurrencies for institutional clients. His career includes roles at Lehman Brothers and Solomon International, with significant influence gained through public communication. However, in late 2024, Fu faced temporary social media bans after a controversial private speech at HSBC on China's economic challenges, though he denied regulatory sanctions. He later left Northeast Securities citing health reasons. Bitfire, a licensed virtual asset manager serving high-net-worth clients, seeks to build trust and attract traditional capital through Fu’s expertise and credibility. The partnership represents a strategic shift for both: Fu enters the crypto sector after a traditional finance peak, while Bitfire aims to leverage his macro framework for institutional adoption. Outcomes remain uncertain regarding capital inflows and compatibility within corporate structure.

marsbitHá 49m

The Second Half of Macro Influencer Fu Peng's Career

marsbitHá 49m

Trading

Spot
Futuros

Artigos em Destaque

O que é BITCOIN

Compreender o HarryPotterObamaSonic10Inu (ERC-20) e a Sua Posição no Espaço Cripto Nos últimos anos, o mercado de criptomoedas assistiu a um aumento na popularidade das moedas meme, cativando não apenas os traders, mas também aqueles que procuram envolvimento comunitário e valor de entretenimento. Entre estes tokens únicos está o HarryPotterObamaSonic10Inu (ERC-20), um projeto intrigante que mistura referências culturais no tecido das criptomoedas. Este artigo explora os principais aspetos do HarryPotterObamaSonic10Inu, examinando os seus mecanismos, a sua ética orientada pela comunidade e o seu envolvimento com o vasto panorama cripto. O que é o HarryPotterObamaSonic10Inu (ERC-20)? Como o nome sugere, o HarryPotterObamaSonic10Inu é uma moeda meme construída na blockchain Ethereum, classificada sob o padrão ERC-20. Ao contrário das criptomoedas tradicionais, que podem enfatizar a utilidade prática ou o potencial de investimento, este token prospera no valor de entretenimento e na força da sua comunidade. O projeto visa promover um ambiente onde utilizadores envolvidos possam reunir-se, partilhar ideias e participar em atividades inspiradas por diversos fenómenos culturais. Uma característica notável do HarryPotterObamaSonic10Inu é a zero taxa sobre transações. Este elemento atraente visa encorajar a negociação e o envolvimento da comunidade, isento de encargos adicionais que podem desencorajar os traders de pequena escala. A oferta total da moeda está fixada em mil milhões de tokens, uma cifra que marca a sua intenção de manter uma circulação substancial dentro da comunidade. Criador do HarryPotterObamaSonic10Inu (ERC-20) As origens do HarryPotterObamaSonic10Inu estão um pouco envoltas em mistério; os detalhes sobre o criador permanecem desconhecidos. O desenvolvimento deste token carece de uma equipa identificável ou de um plano explícito, o que não é raro no setor das moedas meme. Em vez disso, o projeto surgiu de forma orgânica, com o seu progresso a depender fortemente do entusiasmo e da participação da sua comunidade. Investidores do HarryPotterObamaSonic10Inu (ERC-20) No que diz respeito a investimentos externos e apoios, o HarryPotterObamaSonic10Inu também permanece ambíguo. O token não lista quaisquer fundações de investimento conhecidas ou apoio organizacional significativo. Em vez disso, o “sangue vital” do projeto é a sua comunidade de base, que informa o seu crescimento e sustentabilidade através da ação coletiva e do envolvimento no espaço cripto. Como Funciona o HarryPotterObamaSonic10Inu (ERC-20)? Como uma moeda meme, o HarryPotterObamaSonic10Inu opera principalmente fora dos quadros tradicionais que muitas vezes governam o valor dos ativos. Existem vários aspetos distintivos que definem como o projeto funciona: Transações Sem Taxas: Sem taxas sobre transações, os utilizadores podem comprar e vender o token livremente, sem a preocupação de custos ocultos. Envolvimento da Comunidade: O projeto prospera na interação da comunidade, aproveitando plataformas de redes sociais para criar entusiasmo e facilitar a participação. Discussões, partilha de conteúdo e envolvimento são elementos cruciais que ajudam a expandir o seu alcance e a fomentar a lealdade entre os apoiantes. Sem Utilidade Prática: Deve ser notado que o HarryPotterObamaSonic10Inu não oferece utilidade concreta dentro do ecossistema financeiro. Em vez disso, é classificado como um token principalmente para entretenimento e atividades comunitárias. Referência Cultural: O token incorpora de forma inteligente elementos da cultura popular para atrair interesse, conectando-se tanto com entusiastas de memes como com seguidores de criptomoedas. HarryPotterObamaSonic10Inu exemplifica como as moedas meme operam de forma diferente de projetos de criptomoedas mais tradicionais, entrando no mercado como construções sociais inovadoras em vez de ativos utilitários. Linha do Tempo do HarryPotterObamaSonic10Inu (ERC-20) A história do HarryPotterObamaSonic10Inu é marcada por vários marcos notáveis: Criação: O token surgiu de um meme viral, capturando a imaginação de muitos entusiastas de criptomoedas. Datas específicas de criação não estão disponíveis, sublinhando a sua ascensão orgânica. Listagem em Exchanges: O HarryPotterObamaSonic10Inu conseguiu entrar em várias exchanges, permitindo um acesso e negociação mais fáceis pela comunidade. Iniciativas de Envolvimento da Comunidade: Atividades contínuas direcionadas a melhorar a interação comunitária, incluindo concursos, campanhas em redes sociais e geração de conteúdo por fãs e defensores. Planos de Expansão Futura: O roteiro do projeto inclui o lançamento de uma coleção de NFTs, mercadorias e um site de eCommerce relacionado aos seus temas culturais, envolvendo ainda mais a comunidade e tentando adicionar mais dimensões ao seu ecossistema. Pontos-Chave sobre o HarryPotterObamaSonic10Inu (ERC-20) Natureza Orientada pela Comunidade: O projeto prioriza a contribuição coletiva e a criatividade, assegurando que o envolvimento dos utilizadores está na vanguarda do seu desenvolvimento. Classificação como Moeda Meme: Representa o epítome da criptomoeda baseada em entretenimento, destacando-se dos veículos de investimento tradicionais. Sem Afiliação Direta com o Bitcoin: Apesar da semelhança no nome do ticker, o HarryPotterObamaSonic10Inu é distinto e não tem qualquer relação com o Bitcoin ou outras criptomoedas estabelecidas. Foco na Colaboração: O HarryPotterObamaSonic10Inu é projetado para criar um espaço de colaboração e partilha de histórias entre os seus detentores, proporcionando uma via para a criatividade e o fortalecimento da comunidade. Perspectivas Futuras: A ambição de expandir além da sua premissa inicial para NFTs e mercadorias delineia um caminho para o projeto potencialmente entrar em avenidas mais mainstream dentro da cultura digital. À medida que as moedas meme continuam a capturar a imaginação da comunidade cripto, HarryPotterObamaSonic10Inu (ERC-20) destaca-se devido aos seus laços culturais e abordagem centrada na comunidade. Embora possa não se encaixar no molde típico de um token orientado para utilidade, a sua essência reside na alegria e camaradagem fomentadas entre os seus apoiantes, destacando a natureza em evolução das criptomoedas em uma era cada vez mais digital. À medida que o projeto continua a desenvolver-se, será importante observar como as dinâmicas comunitárias influenciam a sua trajetória no panorama em constante mudança da tecnologia blockchain.

1.2k Visualizações TotaisPublicado em {updateTime}Atualizado em 2024.12.03

O que é BITCOIN

Como comprar BTC

Bem-vindo à HTX.com!Tornámos a compra de Bitcoin (BTC) simples e conveniente.Segue o nosso guia passo a passo para iniciar a tua jornada no mundo das criptos.Passo 1: cria a tua conta HTXUtiliza o teu e-mail ou número de telefone para te inscreveres numa conta gratuita na HTX.Desfruta de um processo de inscrição sem complicações e desbloqueia todas as funcionalidades.Obter a minha contaPasso 2: vai para Comprar Cripto e escolhe o teu método de pagamentoCartão de crédito/débito: usa o teu visa ou mastercard para comprar Bitcoin (BTC) instantaneamente.Saldo: usa os fundos da tua conta HTX para transacionar sem problemas.Terceiros: adicionamos métodos de pagamento populares, como Google Pay e Apple Pay, para aumentar a conveniência.P2P: transaciona diretamente com outros utilizadores na HTX.Mercado de balcão (OTC): oferecemos serviços personalizados e taxas de câmbio competitivas para os traders.Passo 3: armazena teu Bitcoin (BTC)Depois de comprar o teu Bitcoin (BTC), armazena-o na tua conta HTX.Alternativamente, podes enviá-lo para outro lugar através de transferência blockchain ou usá-lo para transacionar outras criptomoedas.Passo 4: transaciona Bitcoin (BTC)Transaciona facilmente Bitcoin (BTC) no mercado à vista da HTX.Acede simplesmente à tua conta, seleciona o teu par de trading, executa as tuas transações e monitoriza em tempo real.Oferecemos uma experiência de fácil utilização tanto para principiantes como para traders experientes.

3.8k Visualizações TotaisPublicado em {updateTime}Atualizado em 2025.03.21

Como comprar BTC

O que é $BITCOIN

OURO DIGITAL ($BITCOIN): Uma Análise Abrangente Introdução ao OURO DIGITAL ($BITCOIN) OURO DIGITAL ($BITCOIN) é um projeto baseado em blockchain que opera na rede Solana, com o objetivo de combinar as características dos metais preciosos tradicionais com a inovação das tecnologias descentralizadas. Embora partilhe um nome com o Bitcoin, frequentemente referido como “ouro digital” devido à sua percepção como uma reserva de valor, o OURO DIGITAL é um token separado projetado para criar um ecossistema único dentro da paisagem Web3. O seu objetivo é posicionar-se como um ativo digital alternativo viável, embora os detalhes sobre as suas aplicações e funcionalidades ainda estejam em desenvolvimento. O que é o OURO DIGITAL ($BITCOIN)? OURO DIGITAL ($BITCOIN) é um token de criptomoeda explicitamente projetado para uso na blockchain Solana. Em contraste com o Bitcoin, que fornece um papel amplamente reconhecido como armazenamento de valor, este token parece focar em aplicações e características mais amplas. Aspectos notáveis incluem: Infraestrutura Blockchain: O token é construído na blockchain Solana, conhecida pela sua capacidade de lidar com transações de alta velocidade e baixo custo. Dinâmicas de Oferta: O OURO DIGITAL tem um fornecimento máximo limitado a 100 quatrilhões de tokens (100P $BITCOIN), embora os detalhes sobre o seu fornecimento circulante ainda não tenham sido divulgados. Utilidade: Embora as funcionalidades precisas não estejam explicitamente delineadas, existem indicações de que o token poderia ser utilizado para várias aplicações, potencialmente envolvendo aplicações descentralizadas (dApps) ou estratégias de tokenização de ativos. Quem é o Criador do OURO DIGITAL ($BITCOIN)? Neste momento, a identidade dos criadores e da equipa de desenvolvimento por trás do OURO DIGITAL ($BITCOIN) permanece desconhecida. Esta situação é típica entre muitos projetos inovadores no espaço da blockchain, particularmente aqueles alinhados com finanças descentralizadas e fenómenos de moedas meme. Embora tal anonimato possa fomentar uma cultura orientada pela comunidade, intensifica as preocupações sobre governança e responsabilidade. Quem são os Investidores do OURO DIGITAL ($BITCOIN)? As informações disponíveis indicam que o OURO DIGITAL ($BITCOIN) não tem apoiantes institucionais conhecidos ou investimentos proeminentes de capital de risco. O projeto parece operar num modelo peer-to-peer focado no apoio e adoção da comunidade, em vez de rotas de financiamento tradicionais. A sua atividade e liquidez estão principalmente situadas em exchanges descentralizadas (DEXs), como a PumpSwap, em vez de plataformas de negociação centralizadas estabelecidas, destacando ainda mais a sua abordagem de base. Como Funciona o OURO DIGITAL ($BITCOIN) A mecânica operacional do OURO DIGITAL ($BITCOIN) pode ser elaborada com base no seu design de blockchain e nas características da rede: Mecanismo de Consenso: Ao aproveitar o exclusivo proof-of-history (PoH) da Solana combinado com um modelo de proof-of-stake (PoS), o projeto assegura uma validação eficiente das transações, contribuindo para o alto desempenho da rede. Tokenomics: Embora mecanismos deflacionários específicos não tenham sido extensivamente detalhados, o vasto fornecimento máximo de tokens implica que pode atender a microtransações ou casos de uso de nicho que ainda estão por definir. Interoperabilidade: Existe o potencial para integração com o ecossistema mais amplo da Solana, incluindo várias plataformas de finanças descentralizadas (DeFi). No entanto, os detalhes sobre integrações específicas permanecem não especificados. Cronologia de Eventos Chave Aqui está uma cronologia que destaca marcos significativos relacionados ao OURO DIGITAL ($BITCOIN): 2023: O lançamento inicial do token ocorre na blockchain Solana, marcado pelo seu endereço de contrato. 2024: O OURO DIGITAL ganha visibilidade ao tornar-se disponível para negociação em exchanges descentralizadas como a PumpSwap, permitindo que os utilizadores o negociem contra SOL. 2025: O projeto testemunha atividade de negociação esporádica e potencial interesse em envolvimentos liderados pela comunidade, embora não tenham sido documentadas parcerias ou avanços técnicos notáveis até ao momento. Análise Crítica Forças Escalabilidade: A infraestrutura subjacente da Solana suporta altos volumes de transações, o que pode aumentar a utilidade do $BITCOIN em vários cenários de transação. Acessibilidade: O potencial preço de negociação baixo por token pode atrair investidores de retalho, facilitando uma participação mais ampla devido a oportunidades de propriedade fracionada. Riscos Falta de Transparência: A ausência de apoiantes, desenvolvedores ou um processo de auditoria publicamente conhecidos pode gerar ceticismo em relação à sustentabilidade e confiabilidade do projeto. Volatilidade do Mercado: A atividade de negociação depende fortemente do comportamento especulativo, o que pode resultar em volatilidade significativa dos preços e incerteza para os investidores. Conclusão O OURO DIGITAL ($BITCOIN) surge como um projeto intrigante, mas ambíguo, dentro do ecossistema em rápida evolução da Solana. Embora tente aproveitar a narrativa do “ouro digital”, a sua divergência do papel estabelecido do Bitcoin como reserva de valor sublinha a necessidade de uma diferenciação mais clara da sua utilidade pretendida e estrutura de governança. A aceitação e adoção futuras dependerão provavelmente da abordagem da atual opacidade e da definição mais explícita das suas estratégias operacionais e económicas. Nota: Este relatório abrange informações sintetizadas disponíveis até outubro de 2023, e desenvolvimentos podem ter ocorrido além do período de pesquisa.

92 Visualizações TotaisPublicado em {updateTime}Atualizado em 2025.05.13

O que é $BITCOIN

Discussões

Bem-vindo à Comunidade HTX. Aqui, pode manter-se informado sobre os mais recentes desenvolvimentos da plataforma e obter acesso a análises profissionais de mercado. As opiniões dos utilizadores sobre o preço de BTC (BTC) são apresentadas abaixo.

活动图片