Bitcoin's Short-Term Bear-to-Bull Transition: Will History Repeat Itself? | Invited Analysis

Odaily星球日报Publicado em 2026-01-19Última atualização em 2026-01-19

Resumo

Summary of Bitcoin Market Analysis by Conaldo (Odaily Guest Analyst): This weekly trading report provides a technical analysis of Bitcoin's recent price action and outlines short-term trading strategies. The analyst, leveraging proprietary quantitative models (Momentum Quant, Sentiment Quant, and Spread Trading models), reviews the past week and forecasts the upcoming period. **Key Points & Performance:** * **Strategy Execution:** A single short-term, leveraged (1x) trade was executed last week, resulting in a -1.07% return. The trade was closed according to strict risk management rules after the market moved against the initial short signal. * **Price Validation:** The previous week's core prediction was validated as BTC's price successfully broke through the key resistance zone of $94,500-$95,000, reaching a high near $97,963. * **Current Market Structure:** The weekly chart analysis indicates the overall trend remains bearish, requiring caution. The daily chart shows a recent rebound with initial signs of bullish momentum, though its sustainability is not yet confirmed. **Technical Outlook & Key Levels (Jan 19-25):** * **Critical Zone:** The $94,500-$95,000 area is identified as the crucial level to watch for determining short-term direction. * **Resistance Levels:** Key resistance areas are $94,500-$95,000, $97,500-$99,500, and a major level near $102,000 (the 21-week moving average). * **Support Levels:** Key support areas are $89,500-$91,000, $86,000-$86,...

Odaily invited market analyst Conaldo, a Master of Financial Statistics from Columbia University, who has focused on quantitative trading in U.S. stocks since college and gradually expanded into digital assets such as Bitcoin. He has developed a systematic quantitative trading model and risk control system through practical experience; possesses keen data insight into market fluctuations, and is committed to continuous growth in the professional trading field, pursuing steady returns. He will delve into BTC technical, macroeconomic, and capital flow changes weekly, review and showcase practical strategies, and preview noteworthy upcoming events for reference.
Trading Weekly Report Core Summary:

• Strategy Execution (Short-term): Last week's trading strictly followed the established strategy, completing one short-term operation (1x leverage) with a return of -1.07%. (See Figure 1)

• Core View (Short-term) Validation: The core view proposed last week has been precisely validated by the market. Over the past week, the price broke through the key resistance range of $94,500~$95,000 and is currently confirming its validity. The price reached a high of $97,963, differing by less than 0.5% from the given resistance lower bound of $97,500, once again confirming our ability to judge key points.

• Market Outlook for the Coming Weeks: Is Bitcoin about to transition from a bear market to a bull market? Is the current market a rebound or a reversal? The 21-week moving average may become the market's bull-bear dividing line in the future. (Detailed explanation in Figure 4)

The following will review market predictions, strategy execution, and specific trading processes in detail.

I. Bitcoin Market Review Last Week: (01.12~01.18)

1. Last Week's Short-term Operation Review: As shown in (Figure 1)

We strictly followed the trading signals from our self-built spread trading model and momentum quantitative model, combined with market trend predictions, to complete one short-term operation. This trade resulted in a loss of 1.07%.

Specific trade details and review are as follows:

Bitcoin 30-minute K-line chart: (Momentum Quantitative model + Spread Trading model)
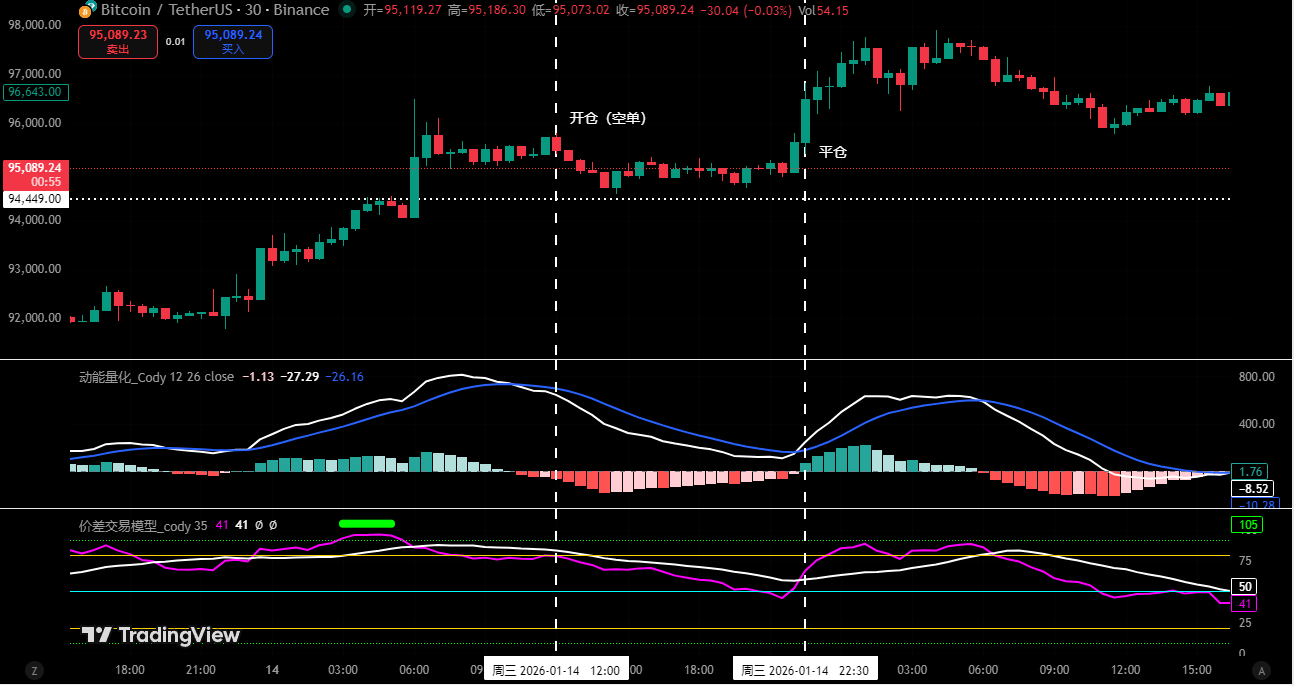
Figure 1

1. Trade Details Summary: (No leverage)

2. Short-term Trade Review:

• First Trade (Loss 1.07%): This operation executed Plan A (Selling short at resistance) strategy: When the price rose to the key resistance area of $94,500~$95,000 and showed signs of resistance, the spread trading model simultaneously triggered a top signal (green dot), forming double confirmation. Accordingly, we established a 30% short position at $95,460 as planned; however, the market deviated from expectations, finding support near $94,500 and turning upward. When the momentum quantitative model and spread trading model triggered a bottom signal again, we immediately stopped loss and exited at $96,493. Although this trade resulted in a loss, we strictly adhered to the operational discipline of "trading upon signal trigger, risk control first", achieving unity of knowledge and action.

2. Last Week's Trend Prediction and Operation Strategy Review:

1. Last week clearly stated: Maintain oscillation within the $84,000~$94,500 range, focusing on directional choices and validity at both ends of the range.

2. Key point review: Resistance at $94,500~$95,000 area, important resistance near $97,500~$99,500; support at $89,500~$91,000 area.

2. Operation Strategy Review:

• Midline Strategy: If the price successfully breaks through and stabilizes above $94,500, close all midline positions (short positions) and hold coins观望.

• Short-term Strategy: If maintaining oscillation within the $84,000~$94,500 range, execute operations according to Plan A:

• Open Position: When rebounding to the $94,500~$95,000 area combined with model top signals, establish a 30% short position.

• Risk Control: Initial stop loss for short positions set about 1.5% above the entry price (i.e., 1.015 * entry price).

• Close Position: When falling near core support levels combined with model signals, gradually close positions to take profits.

II. Analyzing Bitcoin's Price Structure from a Technical Perspective: Comprehensive Judgment Based on Multiple Models and Dimensions

Combining market movements, the author conducts an in-depth analysis of Bitcoin's price structure from multiple models and dimensions based on a self-built trading system.

Bitcoin Weekly K-line chart: (Momentum Quantitative Model + Sentiment Quantitative Model)
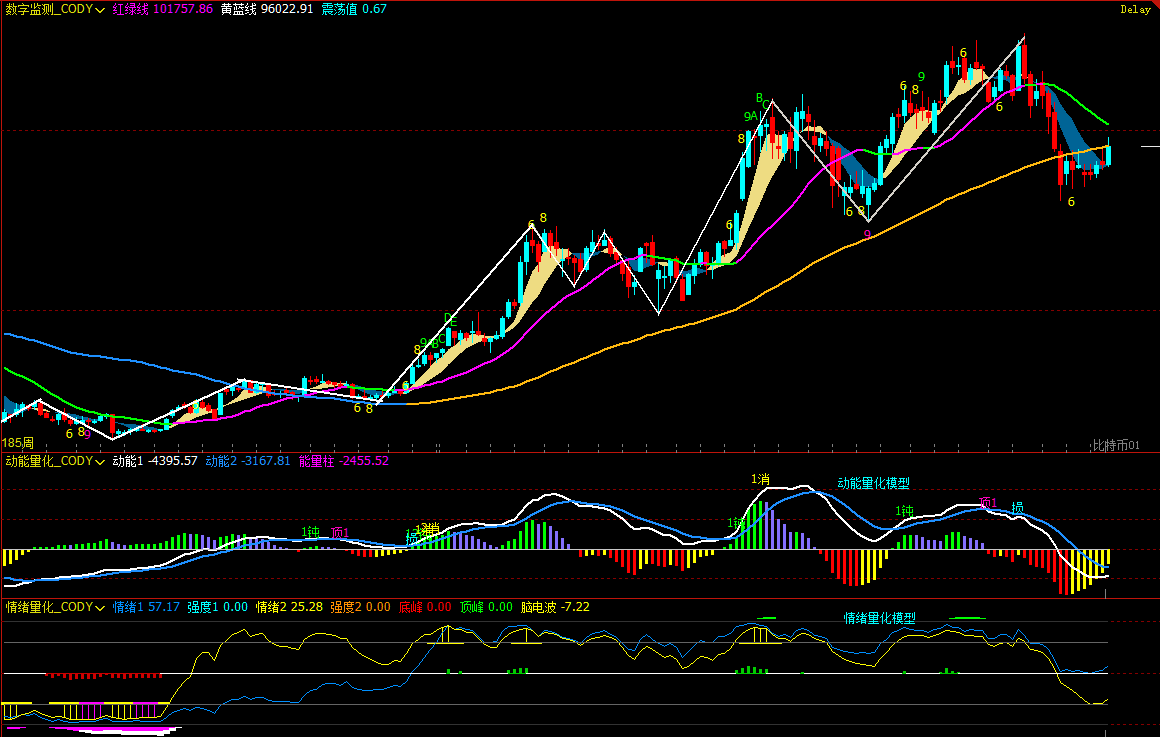
Figure 2

1. As shown in (Figure 2), analysis from the weekly chart:

Momentum Quantitative Model: Technical indicators show, continuing the pattern of previous weeks, the momentum lines are gradually converging, while the negative energy bars continue to shrink. However, the current signals do not confirm a reversal of the bearish trend.

Momentum Quantitative Model indicates: Price decline index: High

Sentiment Quantitative Model: Blue sentiment line value 57.17, strength zero; yellow sentiment line value 25.28, strength zero, peak value is 0.

Sentiment Quantitative Model indicates: Price pressure and support index: Neutral

Digital Monitoring Model: The price has been below the bull-bear (yellow-blue line) dividing line for 9 weeks. Last week, the bulls once again冲击 this line, closing near below.

Digital Monitoring Model indicates: Monitoring (top/bottom) digital signals have not appeared; weekly K-line closed as a medium阳线, gain about 2.92%.

The above data suggests: Bitcoin weekly chart is in a bearish trend, be wary of oscillation adjustment risks.

Bitcoin Daily K-line chart: (Momentum Quantitative Model + Sentiment Quantitative Model)
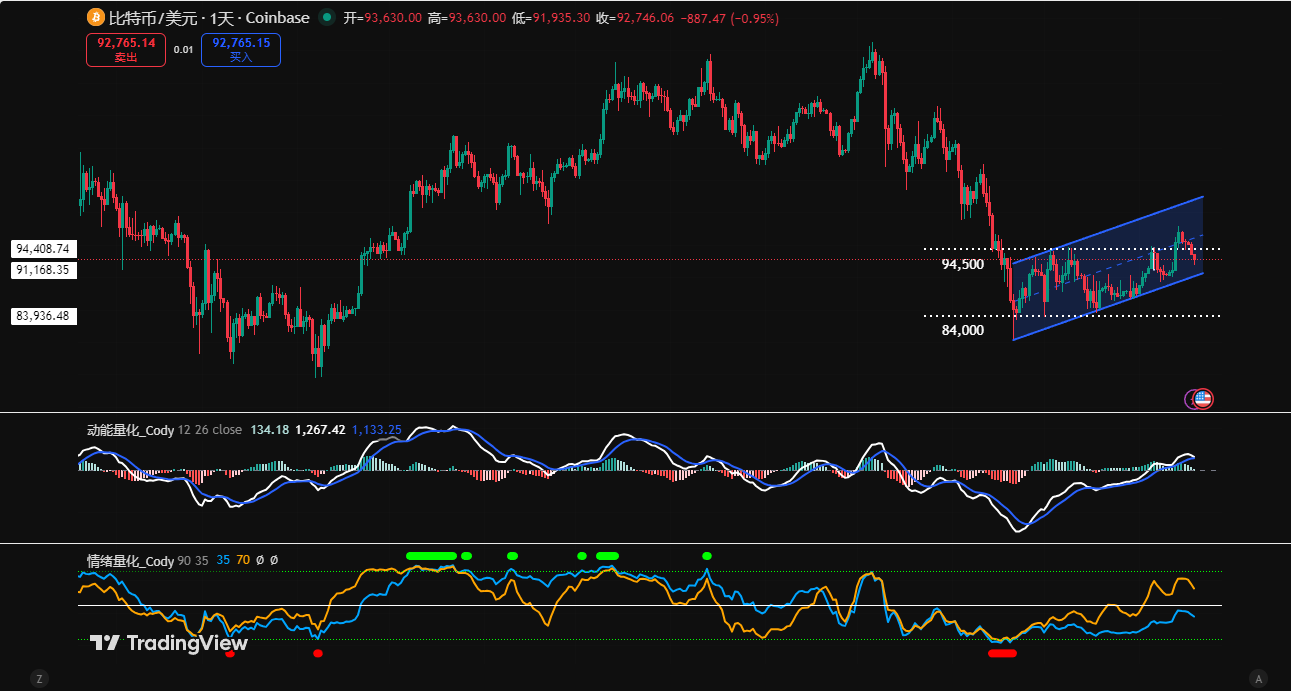
Figure 3

2. As shown in (Figure 3), analysis from the daily chart:

Momentum Quantitative Model: Last week overall showed a "first rise then fall" pattern. In the first half of the week, the price accelerated its rebound, the momentum line stood above the zero axis, and the positive energy bars rapidly expanded; but in the latter half, the energy bars明显萎缩, the momentum lines converged again, slowly approaching the zero axis.

Momentum Quantitative Model indicates: Daily chart bullish momentum shows exhaustion, focus on the gain/loss of the zero axis.

Sentiment Quantitative Model: After last week's daily close, blue sentiment line value 38, strength zero; yellow sentiment line value 76, strength zero.

Sentiment Quantitative Model indicates: Pressure and support index: Neutral

The above data suggests: The daily level rebound continues, the market initially shows a bullish pattern, but validity needs confirmation. Next, focus on the battle between bulls and bears over the zero axis.

III. This Week's Market Prediction: (01.19~01.25)

1. This Week's Core View: Focus on the gain/loss of the $94,500~$95,000 area.

Resistance Effective: If the price rebounds to this area and confirms resistance, it is expected to maintain oscillation within the $84,000~$94,500 range, with the subsequent first test target at the $89,500~$91,000 area.

Effectively Stabilized: If it can strongly stabilize above this area, the price is expected to oscillate and rebound, but the height is limited.

2. Core Resistance Levels:

• First Resistance Area: $94,500~$95,000 area (previous box edge)

• Second Resistance Area: $97,500~$99,500 area (previous oscillation center)

• Important Resistance Level: Near $10,200 (near the 21-week moving average)

3. Core Support Levels:

• First Support Level: $89,500~$91,000 area (previous筹码密集成交区)

• Second Support Level: $86,000~$86,500 area (previous important support level)

• Important Support Level: Near $84,000 (previous box lower edge)

IV. This Week's Operation Strategy (Excluding Sudden News Impact): (01.19~01.25)

1. Midline Strategy: No position, market trends may oscillate and fluctuate,暂时持币观望.

2. Short-term Strategy: Use 30% of position, set stop loss points, based on support and resistance levels, look for "spread" opportunities. (Using 30 minutes as the operation cycle).

3. In operation, focus on the gain/loss of the $94,500~$95,000 area. To dynamically respond to market changes combined with real-time model signals, we have prepared two short-term operation plans, A/B:

Plan A: If the price stabilizes above the $94,500~$95,000 area:

• Open Position: After the price breaks through the $94,500~$95,000 area and shows stabilization signals, combined with model bottom signals, establish a 30% long position.

• Risk Control: Initial stop loss for long positions set about 1.5% below the entry price (i.e., 0.985 * entry price).

• Close Position: When rebounding near core resistance levels combined with model signals, gradually close positions to take profits.

Plan B: If the price effectively breaks below the $94,500~$95,000 area:

• Open Position: If the rebound confirms a effective break below this area, establish a 30% short position.

• Risk Control: Initial stop loss for short positions set about 1.5% above the entry price (i.e., 1.015 * entry price).

• Close Position: When falling near $86,500 combined with model signals, gradually close positions to take profits.

Bitcoin Weekly K-line Chart: Comparative Analysis of Historical Price Structure (2021.11 VS 2025.10)
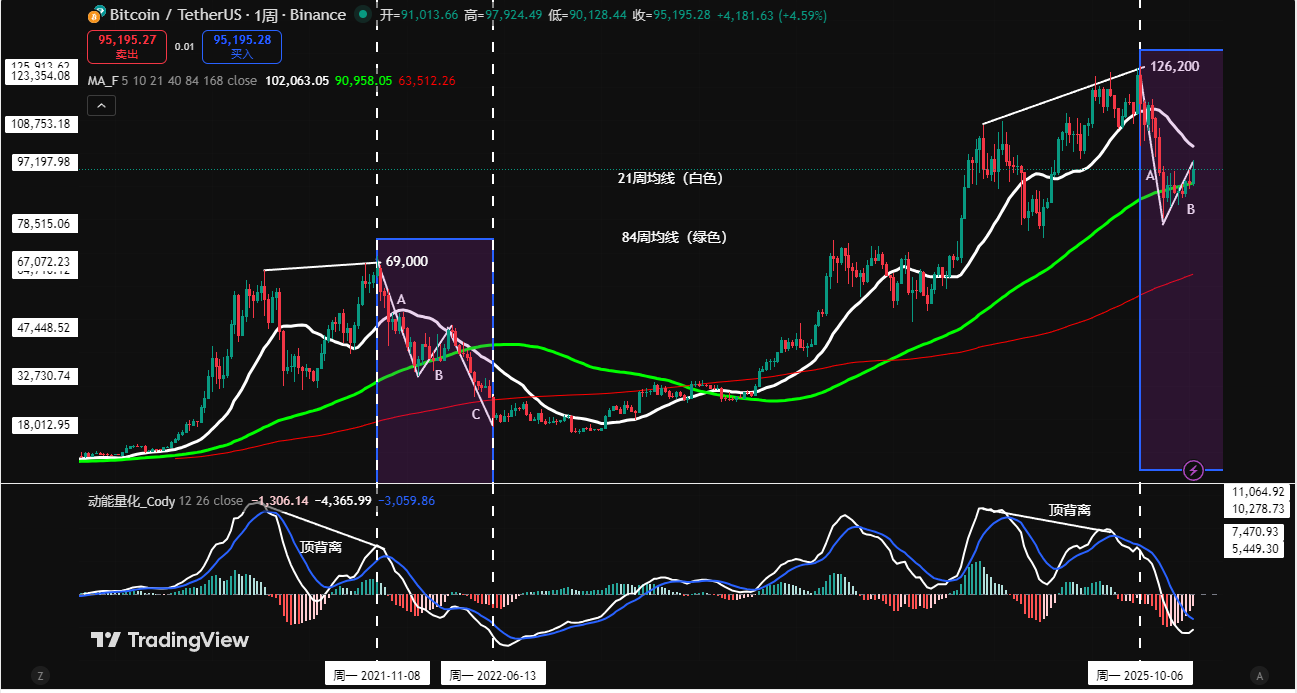
Figure 4

Note: In the above figure, 21-week moving average (white), 84-week moving average (green)

V. How Will History Repeat? Similarities, Differences, and Lessons from Two Rounds of Weekly Level Adjustments:
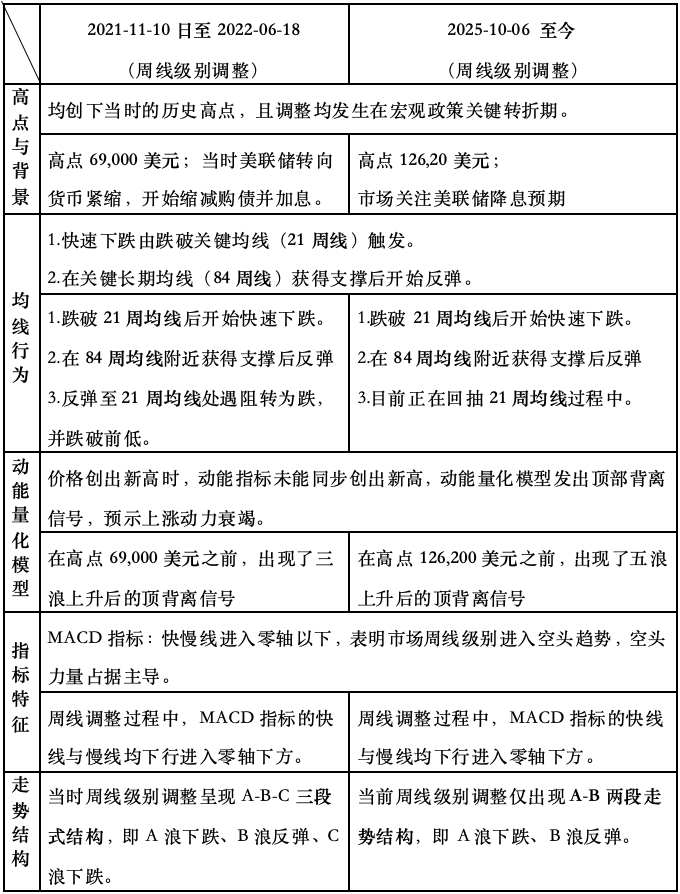
In summary, we can extract the following core insights:

1. The current weekly level is in a bearish trend, which limits the space for daily rebounds.

2. In the coming weeks, whether the price can effectively break through and stabilize above the 21-week moving average will become the market's focus. If the price fails to form an effective breakthrough when rebounding to this moving average, the market may repeat the historical adjustment pattern, even breaking below the $80,000 mark.

3. Whether the weekly level MACD indicator can show signs of stopping decline and stabilizing, and the momentum line effectively crosses above the zero axis, becomes a key basis for judging whether the market trend has reversed.

VI. Special Notes:​​

1. When opening a position: Immediately set the initial stop loss level.

2. When profit reaches 1%: Move the stop loss to the entry price (break-even point) to ensure capital safety.

3. When profit reaches 2%​​: Move the stop loss to the 1% profit level.

4. Continuous tracking: Thereafter, for every additional 1% profit, move the stop loss同步 by 1%, dynamically protecting and locking in profits.

Financial markets change rapidly, all market analysis and trading strategies require dynamic adjustment. All views, analytical models, and operation strategies involved in this article are derived from personal technical analysis, for personal trading log purposes only, and do not constitute any investment advice or operational basis. The market has risks, investment needs caution, DYOR.


Criptomoedas em alta

Perguntas relacionadas

QWhat was the outcome of the short-term trading operation executed last week according to the article?

AThe short-term trading operation resulted in a loss of 1.07%.

QWhat is the key price zone that the article identifies as crucial for Bitcoin's price action this week?

AThe crucial price zone for Bitcoin's price action this week is $94,500 to $95,000.

QAccording to the analyst's models, what is the current trend on the weekly chart for Bitcoin?

AThe weekly chart is currently in a bearish trend, indicating a high probability of a price decline.

QWhat historical indicator does the article suggest is a critical focal point for determining a potential market reversal?

AThe 21-week moving average is suggested as a critical focal point for determining a potential market reversal.

QWhat are the two trading models mentioned as the basis for the analyst's trading signals?

AThe two trading models mentioned are the Spread Trading Model and the Momentum Quant Model.

Leituras Relacionadas

After Three Consecutive Quarters of Decline, Can the Crypto Market Find a Window for Stabilization in Q3?

The cryptocurrency market has just concluded its worst-performing quarter since 2022, with total capitalization dropping 12.6% to $2.1 trillion. All core metrics indicate capital is leaving the sector, not just rotating within it. Bitcoin fell 14.2% and Ethereum dropped 25.4% in Q2, breaking their previous correlation with US tech stocks. A key driver is the reversal in US spot Bitcoin ETF flows, which saw a net outflow of approximately $4.67 billion in Q2, including a record monthly outflow near $4.5 billion in June. While recent data suggests long-term holders are accumulating again, sustained ETF outflows mean continued selling pressure. Market focus is now singularly on the Federal Reserve. The upcoming July FOMC meeting is seen as the most critical event for Q3. A dovish signal could support Bitcoin reclaiming a $68,000-$84,000 range, while a hawkish stance might establish a new trading band around $50,000-$56,000. Additionally, regulatory uncertainty persists, with the progress of the crucial *CLARITY Act* stalling in the Senate, reducing its perceived 2026 passage probability to 40-45%. Despite the broad downturn, a few sectors showed growth. Prediction markets saw nominal volume surge 48.7% year-over-year to $113.8 billion, and tokenized collectibles transaction volume rose 143% quarterly to $1.4 billion. The Real-World Asset (RWA) tokenization sector also continued steady growth, now representing ~$28.1 billion in on-chain value. The market's foundation for an extreme crash appears limited, with Bitcoin price hovering near its 200-week moving average. However, the trading paradigm has shifted from narrative-driven speculation to decisions based on price action, policy developments, and interest rate expectations, making a broad sentiment-driven rally unlikely in the near term.

marsbitHá 47m

After Three Consecutive Quarters of Decline, Can the Crypto Market Find a Window for Stabilization in Q3?

marsbitHá 47m

BIT Trading Moment: BTC Still Suppressed by Weekly 200 EMA, Rejection May Restart Decline; Storage and Semiconductors that Surged Last Night Begin Falling in Evening Trading

**Crypto & Stock Market Wrap: Bitcoin Tests Resistance, Stocks Retreat After AI Surge** Bitcoin consolidates around $66,000, facing key resistance near $68,000—an area seen as a major psychological and technical hurdle where previous rallies have failed. Analysts note the cryptocurrency is caught between its 200-week moving average (~$63,333) and 200-week EMA (~$68,328). A clear break above $68k is needed to signal a stronger bullish trend, while a rejection could lead to a retest of $63k support. Market sentiment remains cautious, with low futures open interest pointing to a low-liquidity rebound rather than a full bull market. Bitcoin spot ETFs saw another $203 million inflow. US stock futures pointed lower after a strong Tuesday session led by a massive rebound in semiconductors and memory stocks. The rally was fueled by renewed optimism about AI-driven hardware demand, with Micron, SanDisk, and SK Hynix surging. However, those gains reversed in pre-market trading. Super Micro Computer (SMCI) soared over 20% after hours on strong guidance and a record backlog. Other standouts included Rocket Lab and nuclear energy plays Oklo and X-Energy. Rising oil prices (Brent above $91) and climbing Treasury yields (10-year near 4.64%), however, are reigniting inflation concerns and acting as a headwind for equities. In Asia, markets were mixed. South Korea's KOSPI pared early gains to close slightly higher as semiconductor stocks like SK Hynix gave back initial surges. Japan's Nikkei edged lower as the yen hit a fresh 38-year low against the dollar, raising fears of potential market intervention. Key events to watch include the Samsung Galaxy launch, AMD's AI event, and a slew of major tech earnings from Alphabet, Tesla, and IBM after the close on Wednesday, followed by the ECB meeting and Intel's earnings on Thursday.

marsbitHá 55m

BIT Trading Moment: BTC Still Suppressed by Weekly 200 EMA, Rejection May Restart Decline; Storage and Semiconductors that Surged Last Night Begin Falling in Evening Trading

marsbitHá 55m

Former CFTC Chairman, Circle President Tarbert: Preaching Long-Termism While Cashing Out $30 Million Himself

Former CFTC Chairman and Circle President Heath Tarbert has consistently advocated for a long-term vision in public, urging patience from investors as Circle’s stock price has fallen significantly from its peak. However, it has been revealed that since Circle’s IPO, Tarbert has continuously sold his CRCL shares through pre-arranged trading plans, cashing out approximately $30 million, without making any public market purchases. This contrast between his public messaging and personal actions has drawn criticism. Tarbert joined Circle in July 2023 as Chief Legal Officer, leveraging his regulatory experience to help guide the company through its IPO and expansion. Despite promoting stablecoins as long-term infrastructure, he established a 10b5-1 trading plan just before Circle went public, leading to substantial stock sales over the following year. In March 2026, he initiated another plan to sell more shares. His career trajectory highlights a pattern of moving between high-level regulatory roles and influential positions in the financial sector. After resigning as CFTC Chairman in early 2021, he joined Citadel Securities as Chief Legal Officer just 27 days later, during a period of intense regulatory scrutiny for the firm. He later joined Circle, aiding its efforts to navigate regulatory challenges for its public listing. While Tarbert's expertise in policy and compliance is valuable to companies like Circle, his actions—advocating long-term confidence while personally divesting—raise questions about the alignment between his public statements and his private financial decisions, leaving investors who followed his advice to bear the market risks.

marsbitHá 1h

Former CFTC Chairman, Circle President Tarbert: Preaching Long-Termism While Cashing Out $30 Million Himself

marsbitHá 1h

Gate Research Institute: The 'Wall Street-ization' Wave of Crypto Financial Products – Competition or Integration?

The article titled "Gate Research Institute: Are Crypto Financial Products Sparking a 'Wall Street' Wave—Competition or Convergence?" explores the evolving relationship between the crypto ecosystem and traditional finance (TradFi). The piece begins by reflecting on Bitcoin's original 2009 vision of decentralization, disintermediation, and moving away from banks. It then contrasts this with the 2024 landscape, where key crypto assets like Bitcoin are increasingly held through Wall Street products like ETFs issued by giants like BlackRock. The article questions whether this signifies that TradFi is systematically taking over the rights to issue, price, custody, and distribute crypto financial assets. The core argument is that this is not a zero-sum takeover but rather a bidirectional convergence where each side addresses the other's weaknesses. Crypto offers 24/7 global markets, programmable settlement, and open access but lacks compliant channels, institutional-grade custody, deep fiat liquidity, and mainstream distribution. TradFi possesses these but is constrained by legacy systems, limited operating hours, and slow settlement. Two primary convergence paths are highlighted: * **Path A (CEX to TradFi):** Exemplified by Gate, which has progressed from offering tokenized stocks and CFDs to providing direct, real stock trading (US, Hong Kong, South Korea) within its platform, using USDT. * **Path B (TradFi to Crypto):** Exemplified by Robinhood, which has integrated crypto trading, acquired exchanges like Bitstamp, and is moving traditional assets like stocks onto the blockchain via tokenization and its own Layer 2. Both paths are ultimately competing to become the next-generation, unified financial account—a "super account" where users can seamlessly trade cryptocurrencies, stocks, ETFs, RWA (Real World Assets), and tokenized treasury products in one interface. The growth of RWA and tokenized treasuries (e.g., BlackRock's BUIDL) is presented as the asset-layer fusion, providing stable, yield-bearing assets on-chain and acting as a bridge between the two worlds. In conclusion, the "Wall Street-ization" of crypto is framed as a mutual transformation. Decentralized ideals persist in the protocol layer, while at the application layer, a more efficient, global, and accessible unified capital market is emerging from this convergence. The future competition lies not between crypto exchanges and stockbrokers, but between platforms vying to offer the most comprehensive asset coverage, liquidity, and user experience within a single account.

marsbitHá 1h

Gate Research Institute: The 'Wall Street-ization' Wave of Crypto Financial Products – Competition or Integration?

marsbitHá 1h

Trading

Spot

Artigos em Destaque

O que é BITCOIN

Compreender o HarryPotterObamaSonic10Inu (ERC-20) e a Sua Posição no Espaço Cripto Nos últimos anos, o mercado de criptomoedas assistiu a um aumento na popularidade das moedas meme, cativando não apenas os traders, mas também aqueles que procuram envolvimento comunitário e valor de entretenimento. Entre estes tokens únicos está o HarryPotterObamaSonic10Inu (ERC-20), um projeto intrigante que mistura referências culturais no tecido das criptomoedas. Este artigo explora os principais aspetos do HarryPotterObamaSonic10Inu, examinando os seus mecanismos, a sua ética orientada pela comunidade e o seu envolvimento com o vasto panorama cripto. O que é o HarryPotterObamaSonic10Inu (ERC-20)? Como o nome sugere, o HarryPotterObamaSonic10Inu é uma moeda meme construída na blockchain Ethereum, classificada sob o padrão ERC-20. Ao contrário das criptomoedas tradicionais, que podem enfatizar a utilidade prática ou o potencial de investimento, este token prospera no valor de entretenimento e na força da sua comunidade. O projeto visa promover um ambiente onde utilizadores envolvidos possam reunir-se, partilhar ideias e participar em atividades inspiradas por diversos fenómenos culturais. Uma característica notável do HarryPotterObamaSonic10Inu é a zero taxa sobre transações. Este elemento atraente visa encorajar a negociação e o envolvimento da comunidade, isento de encargos adicionais que podem desencorajar os traders de pequena escala. A oferta total da moeda está fixada em mil milhões de tokens, uma cifra que marca a sua intenção de manter uma circulação substancial dentro da comunidade. Criador do HarryPotterObamaSonic10Inu (ERC-20) As origens do HarryPotterObamaSonic10Inu estão um pouco envoltas em mistério; os detalhes sobre o criador permanecem desconhecidos. O desenvolvimento deste token carece de uma equipa identificável ou de um plano explícito, o que não é raro no setor das moedas meme. Em vez disso, o projeto surgiu de forma orgânica, com o seu progresso a depender fortemente do entusiasmo e da participação da sua comunidade. Investidores do HarryPotterObamaSonic10Inu (ERC-20) No que diz respeito a investimentos externos e apoios, o HarryPotterObamaSonic10Inu também permanece ambíguo. O token não lista quaisquer fundações de investimento conhecidas ou apoio organizacional significativo. Em vez disso, o “sangue vital” do projeto é a sua comunidade de base, que informa o seu crescimento e sustentabilidade através da ação coletiva e do envolvimento no espaço cripto. Como Funciona o HarryPotterObamaSonic10Inu (ERC-20)? Como uma moeda meme, o HarryPotterObamaSonic10Inu opera principalmente fora dos quadros tradicionais que muitas vezes governam o valor dos ativos. Existem vários aspetos distintivos que definem como o projeto funciona: Transações Sem Taxas: Sem taxas sobre transações, os utilizadores podem comprar e vender o token livremente, sem a preocupação de custos ocultos. Envolvimento da Comunidade: O projeto prospera na interação da comunidade, aproveitando plataformas de redes sociais para criar entusiasmo e facilitar a participação. Discussões, partilha de conteúdo e envolvimento são elementos cruciais que ajudam a expandir o seu alcance e a fomentar a lealdade entre os apoiantes. Sem Utilidade Prática: Deve ser notado que o HarryPotterObamaSonic10Inu não oferece utilidade concreta dentro do ecossistema financeiro. Em vez disso, é classificado como um token principalmente para entretenimento e atividades comunitárias. Referência Cultural: O token incorpora de forma inteligente elementos da cultura popular para atrair interesse, conectando-se tanto com entusiastas de memes como com seguidores de criptomoedas. HarryPotterObamaSonic10Inu exemplifica como as moedas meme operam de forma diferente de projetos de criptomoedas mais tradicionais, entrando no mercado como construções sociais inovadoras em vez de ativos utilitários. Linha do Tempo do HarryPotterObamaSonic10Inu (ERC-20) A história do HarryPotterObamaSonic10Inu é marcada por vários marcos notáveis: Criação: O token surgiu de um meme viral, capturando a imaginação de muitos entusiastas de criptomoedas. Datas específicas de criação não estão disponíveis, sublinhando a sua ascensão orgânica. Listagem em Exchanges: O HarryPotterObamaSonic10Inu conseguiu entrar em várias exchanges, permitindo um acesso e negociação mais fáceis pela comunidade. Iniciativas de Envolvimento da Comunidade: Atividades contínuas direcionadas a melhorar a interação comunitária, incluindo concursos, campanhas em redes sociais e geração de conteúdo por fãs e defensores. Planos de Expansão Futura: O roteiro do projeto inclui o lançamento de uma coleção de NFTs, mercadorias e um site de eCommerce relacionado aos seus temas culturais, envolvendo ainda mais a comunidade e tentando adicionar mais dimensões ao seu ecossistema. Pontos-Chave sobre o HarryPotterObamaSonic10Inu (ERC-20) Natureza Orientada pela Comunidade: O projeto prioriza a contribuição coletiva e a criatividade, assegurando que o envolvimento dos utilizadores está na vanguarda do seu desenvolvimento. Classificação como Moeda Meme: Representa o epítome da criptomoeda baseada em entretenimento, destacando-se dos veículos de investimento tradicionais. Sem Afiliação Direta com o Bitcoin: Apesar da semelhança no nome do ticker, o HarryPotterObamaSonic10Inu é distinto e não tem qualquer relação com o Bitcoin ou outras criptomoedas estabelecidas. Foco na Colaboração: O HarryPotterObamaSonic10Inu é projetado para criar um espaço de colaboração e partilha de histórias entre os seus detentores, proporcionando uma via para a criatividade e o fortalecimento da comunidade. Perspectivas Futuras: A ambição de expandir além da sua premissa inicial para NFTs e mercadorias delineia um caminho para o projeto potencialmente entrar em avenidas mais mainstream dentro da cultura digital. À medida que as moedas meme continuam a capturar a imaginação da comunidade cripto, HarryPotterObamaSonic10Inu (ERC-20) destaca-se devido aos seus laços culturais e abordagem centrada na comunidade. Embora possa não se encaixar no molde típico de um token orientado para utilidade, a sua essência reside na alegria e camaradagem fomentadas entre os seus apoiantes, destacando a natureza em evolução das criptomoedas em uma era cada vez mais digital. À medida que o projeto continua a desenvolver-se, será importante observar como as dinâmicas comunitárias influenciam a sua trajetória no panorama em constante mudança da tecnologia blockchain.

1.7k Visualizações TotaisPublicado em {updateTime}Atualizado em 2024.12.03

O que é BITCOIN

Como comprar BTC

Bem-vindo à HTX.com!Tornámos a compra de Bitcoin (BTC) simples e conveniente.Segue o nosso guia passo a passo para iniciar a tua jornada no mundo das criptos.Passo 1: cria a tua conta HTXUtiliza o teu e-mail ou número de telefone para te inscreveres numa conta gratuita na HTX.Desfruta de um processo de inscrição sem complicações e desbloqueia todas as funcionalidades.Obter a minha contaPasso 2: vai para Comprar Cripto e escolhe o teu método de pagamentoCartão de crédito/débito: usa o teu visa ou mastercard para comprar Bitcoin (BTC) instantaneamente.Saldo: usa os fundos da tua conta HTX para transacionar sem problemas.Terceiros: adicionamos métodos de pagamento populares, como Google Pay e Apple Pay, para aumentar a conveniência.P2P: transaciona diretamente com outros utilizadores na HTX.Mercado de balcão (OTC): oferecemos serviços personalizados e taxas de câmbio competitivas para os traders.Passo 3: armazena teu Bitcoin (BTC)Depois de comprar o teu Bitcoin (BTC), armazena-o na tua conta HTX.Alternativamente, podes enviá-lo para outro lugar através de transferência blockchain ou usá-lo para transacionar outras criptomoedas.Passo 4: transaciona Bitcoin (BTC)Transaciona facilmente Bitcoin (BTC) no mercado à vista da HTX.Acede simplesmente à tua conta, seleciona o teu par de trading, executa as tuas transações e monitoriza em tempo real.Oferecemos uma experiência de fácil utilização tanto para principiantes como para traders experientes.

4.3k Visualizações TotaisPublicado em {updateTime}Atualizado em 2026.06.02

Como comprar BTC

O que é $BITCOIN

OURO DIGITAL ($BITCOIN): Uma Análise Abrangente Introdução ao OURO DIGITAL ($BITCOIN) OURO DIGITAL ($BITCOIN) é um projeto baseado em blockchain que opera na rede Solana, com o objetivo de combinar as características dos metais preciosos tradicionais com a inovação das tecnologias descentralizadas. Embora partilhe um nome com o Bitcoin, frequentemente referido como “ouro digital” devido à sua percepção como uma reserva de valor, o OURO DIGITAL é um token separado projetado para criar um ecossistema único dentro da paisagem Web3. O seu objetivo é posicionar-se como um ativo digital alternativo viável, embora os detalhes sobre as suas aplicações e funcionalidades ainda estejam em desenvolvimento. O que é o OURO DIGITAL ($BITCOIN)? OURO DIGITAL ($BITCOIN) é um token de criptomoeda explicitamente projetado para uso na blockchain Solana. Em contraste com o Bitcoin, que fornece um papel amplamente reconhecido como armazenamento de valor, este token parece focar em aplicações e características mais amplas. Aspectos notáveis incluem: Infraestrutura Blockchain: O token é construído na blockchain Solana, conhecida pela sua capacidade de lidar com transações de alta velocidade e baixo custo. Dinâmicas de Oferta: O OURO DIGITAL tem um fornecimento máximo limitado a 100 quatrilhões de tokens (100P $BITCOIN), embora os detalhes sobre o seu fornecimento circulante ainda não tenham sido divulgados. Utilidade: Embora as funcionalidades precisas não estejam explicitamente delineadas, existem indicações de que o token poderia ser utilizado para várias aplicações, potencialmente envolvendo aplicações descentralizadas (dApps) ou estratégias de tokenização de ativos. Quem é o Criador do OURO DIGITAL ($BITCOIN)? Neste momento, a identidade dos criadores e da equipa de desenvolvimento por trás do OURO DIGITAL ($BITCOIN) permanece desconhecida. Esta situação é típica entre muitos projetos inovadores no espaço da blockchain, particularmente aqueles alinhados com finanças descentralizadas e fenómenos de moedas meme. Embora tal anonimato possa fomentar uma cultura orientada pela comunidade, intensifica as preocupações sobre governança e responsabilidade. Quem são os Investidores do OURO DIGITAL ($BITCOIN)? As informações disponíveis indicam que o OURO DIGITAL ($BITCOIN) não tem apoiantes institucionais conhecidos ou investimentos proeminentes de capital de risco. O projeto parece operar num modelo peer-to-peer focado no apoio e adoção da comunidade, em vez de rotas de financiamento tradicionais. A sua atividade e liquidez estão principalmente situadas em exchanges descentralizadas (DEXs), como a PumpSwap, em vez de plataformas de negociação centralizadas estabelecidas, destacando ainda mais a sua abordagem de base. Como Funciona o OURO DIGITAL ($BITCOIN) A mecânica operacional do OURO DIGITAL ($BITCOIN) pode ser elaborada com base no seu design de blockchain e nas características da rede: Mecanismo de Consenso: Ao aproveitar o exclusivo proof-of-history (PoH) da Solana combinado com um modelo de proof-of-stake (PoS), o projeto assegura uma validação eficiente das transações, contribuindo para o alto desempenho da rede. Tokenomics: Embora mecanismos deflacionários específicos não tenham sido extensivamente detalhados, o vasto fornecimento máximo de tokens implica que pode atender a microtransações ou casos de uso de nicho que ainda estão por definir. Interoperabilidade: Existe o potencial para integração com o ecossistema mais amplo da Solana, incluindo várias plataformas de finanças descentralizadas (DeFi). No entanto, os detalhes sobre integrações específicas permanecem não especificados. Cronologia de Eventos Chave Aqui está uma cronologia que destaca marcos significativos relacionados ao OURO DIGITAL ($BITCOIN): 2023: O lançamento inicial do token ocorre na blockchain Solana, marcado pelo seu endereço de contrato. 2024: O OURO DIGITAL ganha visibilidade ao tornar-se disponível para negociação em exchanges descentralizadas como a PumpSwap, permitindo que os utilizadores o negociem contra SOL. 2025: O projeto testemunha atividade de negociação esporádica e potencial interesse em envolvimentos liderados pela comunidade, embora não tenham sido documentadas parcerias ou avanços técnicos notáveis até ao momento. Análise Crítica Forças Escalabilidade: A infraestrutura subjacente da Solana suporta altos volumes de transações, o que pode aumentar a utilidade do $BITCOIN em vários cenários de transação. Acessibilidade: O potencial preço de negociação baixo por token pode atrair investidores de retalho, facilitando uma participação mais ampla devido a oportunidades de propriedade fracionada. Riscos Falta de Transparência: A ausência de apoiantes, desenvolvedores ou um processo de auditoria publicamente conhecidos pode gerar ceticismo em relação à sustentabilidade e confiabilidade do projeto. Volatilidade do Mercado: A atividade de negociação depende fortemente do comportamento especulativo, o que pode resultar em volatilidade significativa dos preços e incerteza para os investidores. Conclusão O OURO DIGITAL ($BITCOIN) surge como um projeto intrigante, mas ambíguo, dentro do ecossistema em rápida evolução da Solana. Embora tente aproveitar a narrativa do “ouro digital”, a sua divergência do papel estabelecido do Bitcoin como reserva de valor sublinha a necessidade de uma diferenciação mais clara da sua utilidade pretendida e estrutura de governança. A aceitação e adoção futuras dependerão provavelmente da abordagem da atual opacidade e da definição mais explícita das suas estratégias operacionais e económicas. Nota: Este relatório abrange informações sintetizadas disponíveis até outubro de 2023, e desenvolvimentos podem ter ocorrido além do período de pesquisa.

142 Visualizações TotaisPublicado em {updateTime}Atualizado em 2025.05.13

O que é $BITCOIN

Discussões

Bem-vindo à Comunidade HTX. Aqui, pode manter-se informado sobre os mais recentes desenvolvimentos da plataforma e obter acesso a análises profissionais de mercado. As opiniões dos utilizadores sobre o preço de BTC (BTC) são apresentadas abaixo.

活动图片













