Bitcoin's Bull-Bear Range Battle Continues, HYPE Faces Critical Test of Wave V Support | Exclusive Analysis

marsbitPublicado em 2026-04-20Última atualização em 2026-04-20

Resumo

This market analysis covers Bitcoin (BTC) and HYPE, highlighting key levels and trading strategies for the week. HYPE is currently testing a critical support level at $40.17. A hold above this level could lead to consolidation between $40.17–$45.76, while a break below it may signal the end of its current V-wave uptrend from the April 2 low. The short-term strategy is to look for long entries near $40.17 if support holds, using 30% leverage and strict stop-loss discipline. Bitcoin is interpreted to be in a larger D-wave rebound from the February 6 low of $60,000, currently trading within a $73,500–$79,000 range. Key resistance lies at $79,000–$80,600 and $83,500–$84,500, with supports at $73,500, $69,500, and $65,000–$66,000. The medium-term strategy maintains a 60% short position from $89,000. Short-term tactics include selling into rallies near $76,500–$79,000 (Scenario A) or breaking below $73,500 (Scenario B), using 30% leverage. Last week, a 1x leveraged long trade in HYPE yielded a 6.80% gain, and the BTC short from $89,000 is currently up approximately 17.08%. Risk management is emphasized: set stop-losses at entry, move to breakeven at +1% profit, and trail stops to lock in gains thereafter. All views are based on technical analysis and are not investment advice. Traders are urged to exercise caution and adapt to market changes.

This week, the market is seeking direction amid fluctuations, with opportunities and risks coexisting. HYPE's daily Wave V structure faces a critical validation point, where the success or failure of the $40.17 support will determine the subsequent trend; BTC, meanwhile, hovers between the continuation of the D-wave rebound and pressure from resistance zones, with the bull-bear battle in the $73,500~$79,000 range remaining the core focus.

Following the trend and adhering to strict discipline are key to navigating complex market conditions steadily.

Summary of This Week's Core Trading Views:

• Analysis of HYPE's current trend structure. (Details in Part 1)

• HYPE's market forecast and short-term trading strategy for this week. (Details in Part 2)

• Analysis of BTC's multi-cycle trend structure. (Details in Part 3)

• BTC's market forecast and medium- and short-term trading strategies for this week. (Details in Part 4)

Market Validation of Last Week's Trading Strategy and Core Views:

• HYPE Short-term Trading Results: HYPE completed one short-term long position trade (1x leverage) last week, achieving a cumulative return of approximately 6.80%. (Details in Table 1)

• Market Validation of HYPE's Trend Forecast: In our previous article, we indicated that the rebound initiated from the low of $34.44 on April 2nd for HYPE, in terms of wave structure, belongs to a potential daily Wave V rise. The current market movement validates our previous view. Last week, the market rebound reached a high of $45.75, not only successfully breaking through the Wave III high of $43.78 from March 18th but also setting a new high for this upward trend.

• Validation of BTC Medium-term Trading Results: Bitcoin followed the established medium-term strategy last week, continuing to hold the short position established at $89,000 (1x leverage). As of last week's close (approximately $73,800), the profit was about 17.08%, with a maximum profit of about 32.58% during the period.

• Market Validation of BTC's Trend Forecast: In last week's article, we indicated that the market would maintain a wide-range volatile consolidation pattern. The current market movement validates our previous forecast.

I. HYPE: Trend Structure Analysis

HYPE_4-hour K-line Chart
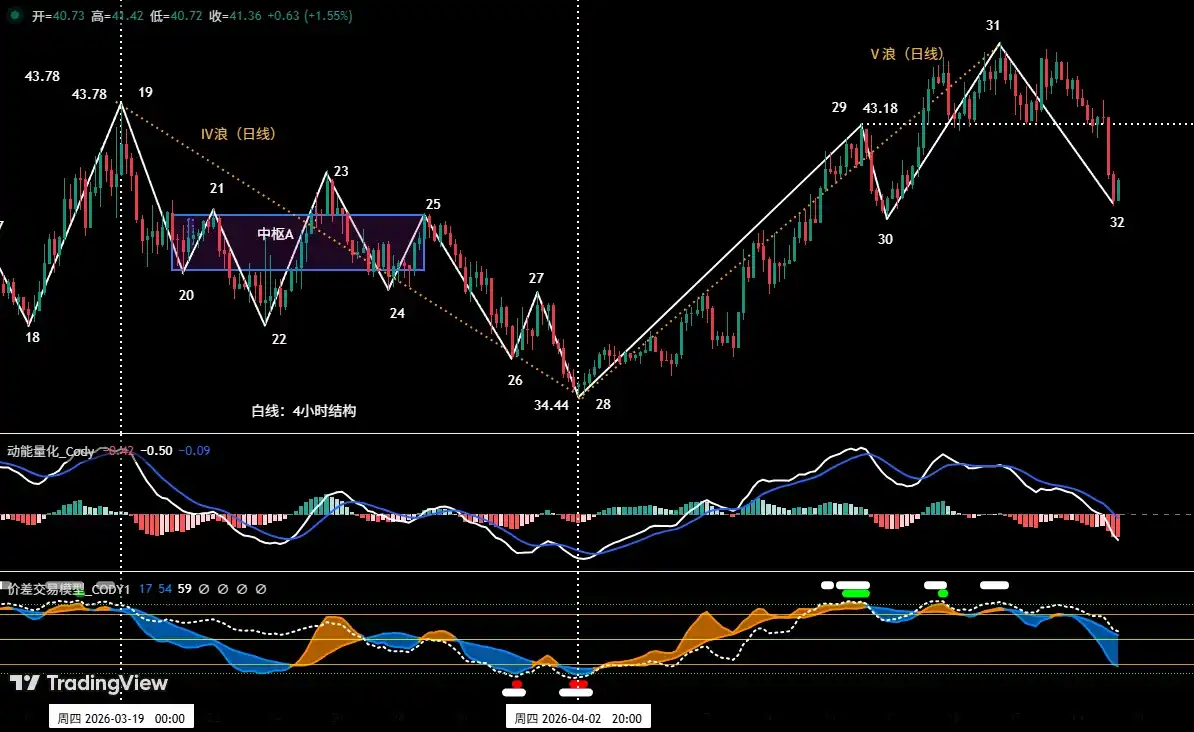
Figure 1

1. As shown in (Figure 1), HYPE reached a new high of $45.76 on April 16th, setting a new rebound high since the low of $20.46 on January 21st, and has broken through the previous high of $43.78 from March 18th (i.e., the Wave III high). Therefore, the upward movement starting from the low of $34.44 on April 2nd can be tentatively regarded as a daily Wave V rising structure, which is currently in progress.

2. As shown in (Figure 1), the aforementioned daily Wave V can be further subdivided in the 4-hour cycle into: an upward structure consisting of 4 segments: 28-29, 29-30, 30-31, and 31-32.

3. The market is currently running the 31-32 adjustment segment.

• In HYPE's 4-hour structure, our self-built momentum quantitative model detected that two momentum signal lines have simultaneously moved below the zero axis, indicating that this adjustment segment may be weak and the adjustment time may be extended.

• Currently, the potential adjustment endpoint (i.e., endpoint 32) is approaching the previous support level of $40.17 (i.e., endpoint 30).

II. HYPE's Market Forecast and Short-term Trading Strategy for This Week

1. HYPE's Market Trend Forecast for This Week:

As shown in (Figure 1), focus on whether endpoint 32 breaks below endpoint 30 (i.e., $40.17):

• If it holds above, it will maintain a box consolidation between $40.17 and $45.76;

• If it breaks below this support level, and the subsequent rebound high cannot exceed $45.76 (i.e., endpoint 31), it will form a classic technical pattern of "adjustment breaking the previous low, but subsequent rebound failing to make a new high." This would mean that the daily Wave V rising structure initiated from the low on April 2nd has a high probability of having completed its termination at $45.76.

2. HYPE's Short-term Trading Strategy for This Week:

• Based on the forecast of the overall upward trend, the strategy of "follow the trend, buy on dips" should be followed.

• According to the signals from our self-built quantitative model, use the 30-minute/60-minute cycle as the operation period, utilizing 30% of the position to capture long entry opportunities.

• Entry Strategy: HYPE faces adjustment demand at the beginning of the week. If the price pulls back near the key support of $40.17 and shows signals confirming it is holding above the support, combined with the bottom buy signals triggered by the two major models, consider entering a long position and strictly adhere to stop-loss discipline.

III. Bitcoin Multi-cycle Trend Structure Analysis

1. BTC Daily Level Wave Division: (Based on the market after the high on October 6, 2025)

Bitcoin _ Daily K-line Chart:
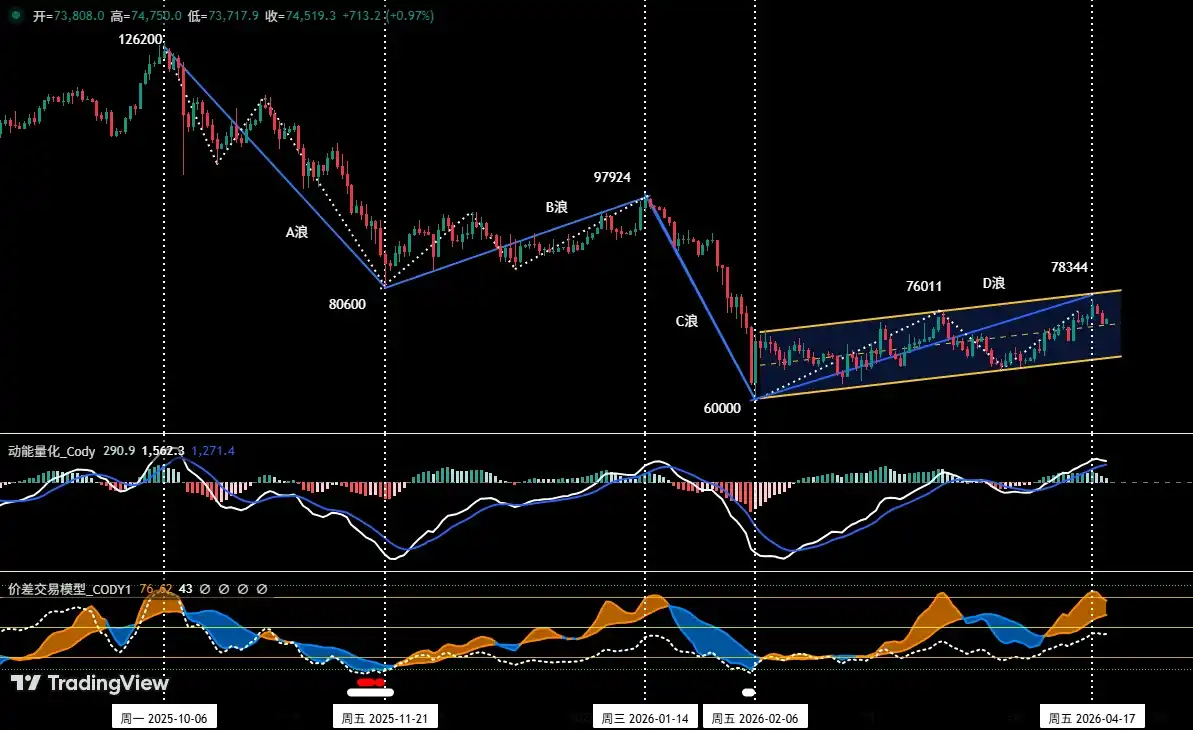
Figure 2

As shown in (Figure 2), since Bitcoin's rebound starting from the low of $60,000 on February 6th not only reached a new rebound high of $78,333 on April 17th but has also run for about 73 trading days as of April 19th, its time and space have significantly exceeded the previously forecasted "C-wave adjustment wave internal C-2 wave rebound" scope (e.g., its continuous rebound time has far exceeded the 54-day B-wave rebound). Therefore, from the principles of Elliott Wave Theory analysis, the original framework may need adjustment. We are more inclined to redefine this upward movement starting from $60,000 as a larger-level "D-wave rebound," which is more in line with the objective fact that the current market is exchanging time for space and the rebound cycle is prolonged.

The specific medium-term adjustment wave division can be optimized as follows:

• A-wave adjustment (driving decline): Started from the high of $126,200 on October 6, 2025, to the low of $80,600 on November 21, 2025, lasting about 46 days, with a maximum decline of about 36%. This wave established the medium-term adjustment pattern.

• B-wave rebound (complex adjustment): Started from the low of $80,600 on November 21, 2025, to the high of $97,924 on January 14, 2026, lasting about 54 days, with a maximum increase of about 21.5%. This is a correction against the A-wave decline.

• C-wave adjustment (main decline wave): Started from the high of $97,924 on January 14, 2026, and touched the low of $60,000 on February 6, 2026, with a rapid decline, lasting about 22 days, with a maximum decline of about 38.7%. This wave completed the main spatial part of the adjustment.

• D-wave rebound (currently in progress/possibly in the final stage): Started from the low of $60,000 on February 6, 2026. As of April 19, it has run for about 73 days, with a maximum increase of about 30.6% (from $60,000 to $78,333). The characteristics of this rebound are prolonged time, complex structure, and it is currently facing the test of key time windows and price resistance zones (such as $79,000-80,600). If the D-wave is established, after the coin price rebound ends, it may usher in a corresponding "E-wave" adjustment.

2. BTC: In-depth Analysis of Trend Structure

Bitcoin _4-hour K-line Chart
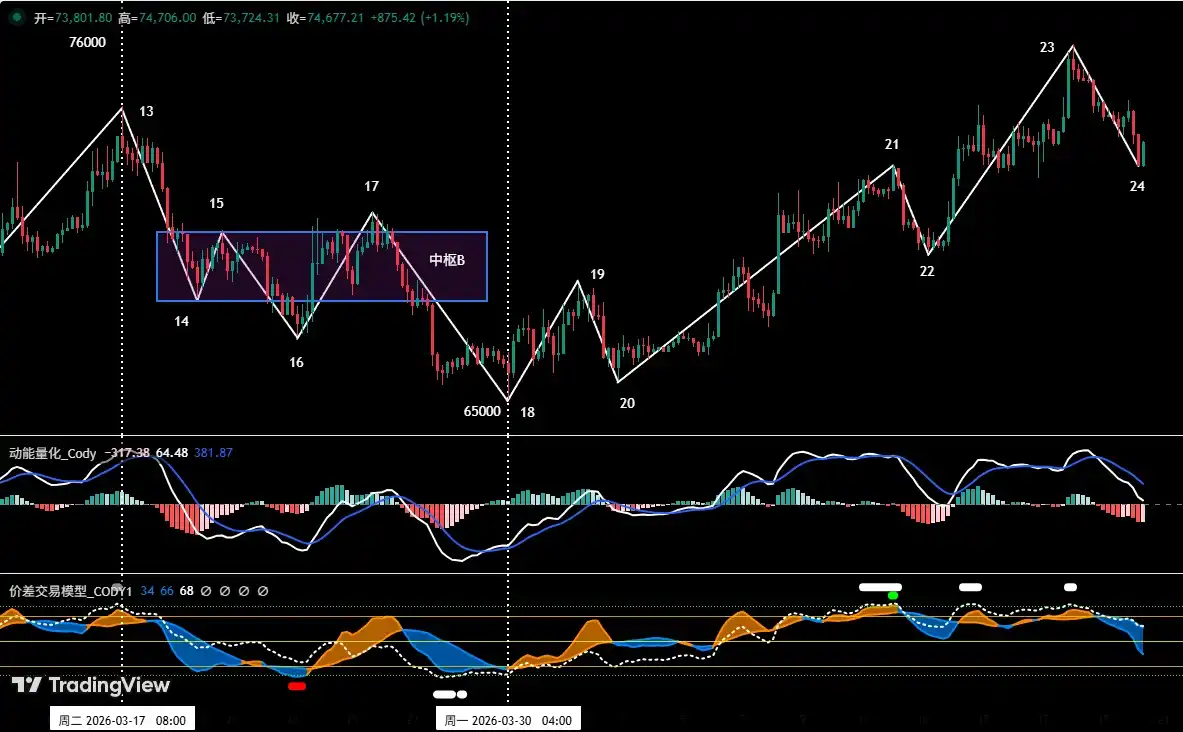
Figure 3

• Based on the market evolution after the low of $65,000 on March 30.

• As shown in (Figure 3), BTC started a fluctuating upward trend from the low on March 30. From endpoint 18 to endpoint 24, it consists of a 6-segment structure: 18-19, 19-20, 20-21, 21-22, 22-23, and 23-24.

• The figure shows: From endpoint 18 to endpoint 23, the market has run a relatively clear 5-wave rebound structure, and is currently running the 23-24 segment. From our self-built spread trading model, recent top warning signals have been continuously issued (green and white points in the figure), which means technical indicators are in a severe overbought state, and the market has short-term adjustment needs.

IV. Bitcoin's Market Forecast and Trading Strategy for This Week

1. BTC's Market Trend Forecast for This Week:

• Core View for This Week:

Currently maintaining consolidation in the $73,500~$79,000 range, focus on the battle between bulls and bears near the upper and lower bounds of the range. If the rebound breaks above the upper bound, the market will fluctuate and rebound, but the space is limited; if it effectively breaks below the lower bound, the coin price may further test the key support near $69,500.

2. Core Resistance Levels:

• First Resistance Zone: $79,000~$80,600 area (near the November 2025 low)

• Second Resistance Zone: $83,500~$84,500 area (previous multi-empty chip密集 transaction area)

3. Core Support Levels:

• First Support Level: Near $73,500 (previous important support level)

• Second Support Level: Near $69,500 (previous important support level)

• Third Support Level: $65,000~$66,000 area (near the lower rail of the consolidation range)

4. Trading Strategy for This Week (excluding sudden news impact): (04.20~04.26)

1. Medium-term Strategy:

Bitcoin _ Daily K-line Chart: (Position Monitoring Model)
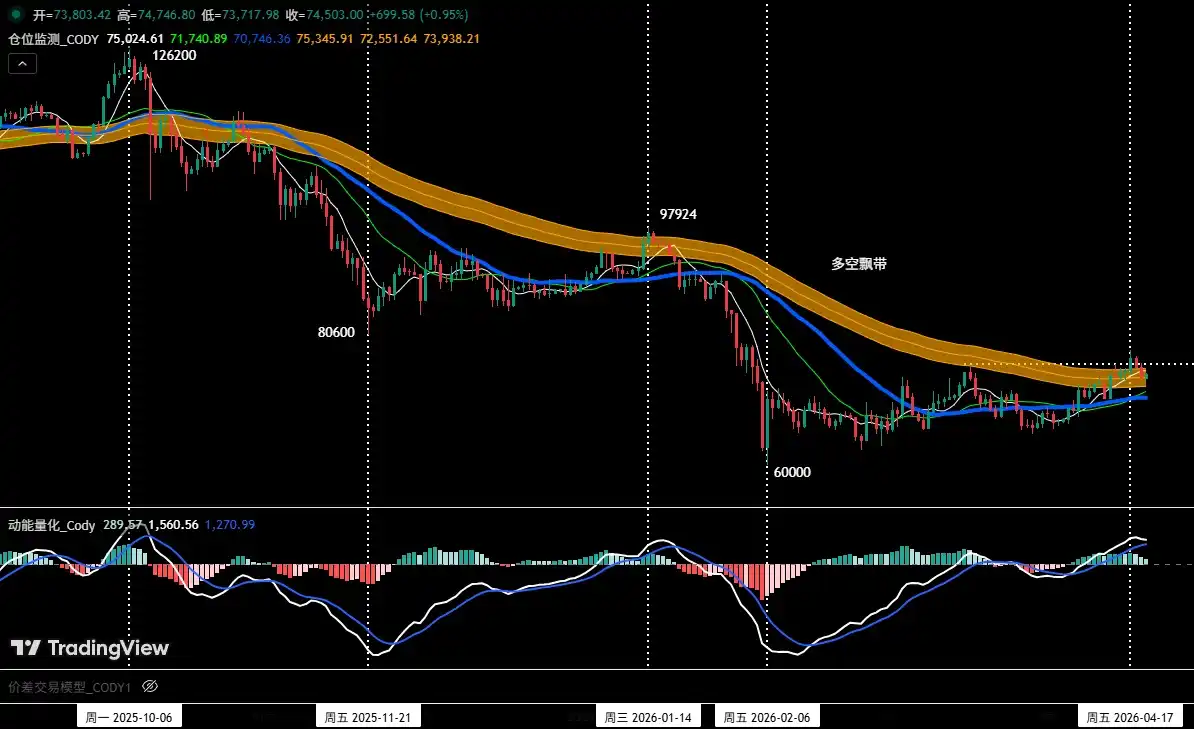
Figure 4

Position Monitoring Model: As shown in (Figure 4), currently, the coin price is fluctuating near the bull-bear ribbon. According to our strategy rules, we temporarily hold the 60% short position established at $89,000 (January 28).

• If the coin price rebound this week effectively stabilizes above the bull-bear ribbon, clear all medium-term positions.

2. Short-term Strategy: Use 30% of the position, set stop-loss points, and look for "spread" opportunities based on support and resistance levels. (Use the 30-minute/60-minute cycle as the operation period).

3. Based on the forecast of the medium-term bearish trend, the principle of "follow the trend to go short" should be adhered to. To dynamically respond to the complex evolution of the market and combine the signals from our self-built trading model, we will formulate two short-term operation plans: A/B:

Plan A: Rebound meets resistance, sell high on rallies.

• Entry: When the coin price rebounds to the $76,500~$79,000 area and triggers resistance signals combined with the model's top signals, a 30% short position can be established.

• Risk Control: Initial stop-loss set above $80,600.

• Close Position: When the coin price falls near important support levels and combines with model signals, gradually close positions to take profits.

Plan B: Follow the trend break short.

• Entry: The coin price continues to adjust. When the coin price effectively breaks below the support near $73,500 and combines with the model's top signals, follow the trend to establish a 30% short position.

• Risk Control: Initial stop-loss set above $74,500.

• Close Position: When falling to support levels and combining with model signals, gradually close positions to take profits.

V. HYPE: Operation Review

1. Short-term Operation Review: (See Table 1)

We strictly followed the operation plan and, based on the trading signals issued by our self-built spread trading model and momentum quantitative model, completed one short-term (long) operation last week, with a cumulative trading profit of 6.80%.

2. Summary of HYPE Short-term Trading Details: (Leverage*1x)
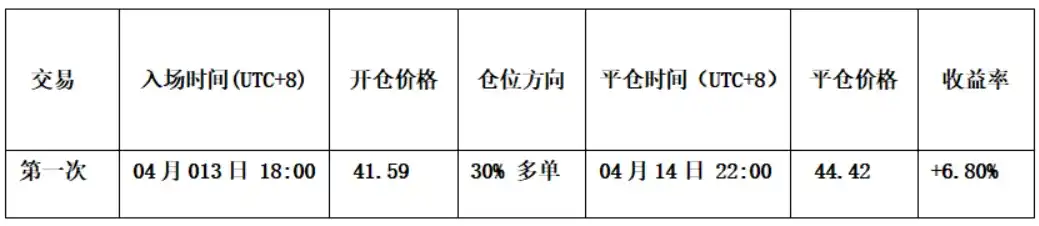
Table 1

3. Short-term Trading Review: (See Figure 5)

• Entry Strategy: First, based on the judgment of the market's V-wave upward trend; second, the spread trading model had already issued a bottom warning signal (good point in the figure); third, the two momentum lines in the momentum model simultaneously moved above the zero axis, and the two major models issued共振上涨 signals. We established a 30% long position at $41.59.

• Close Position Strategy: When the price rose to near $45 and encountered resistance, and the spread trading model triggered a strong top warning signal (green point + white point), we closed all positions near $44.42.

• Summary: This trade successfully profited about 6.80%.

HYPE_60-minute K-line Chart: (Momentum Quantitative Model + Spread Trading Model)
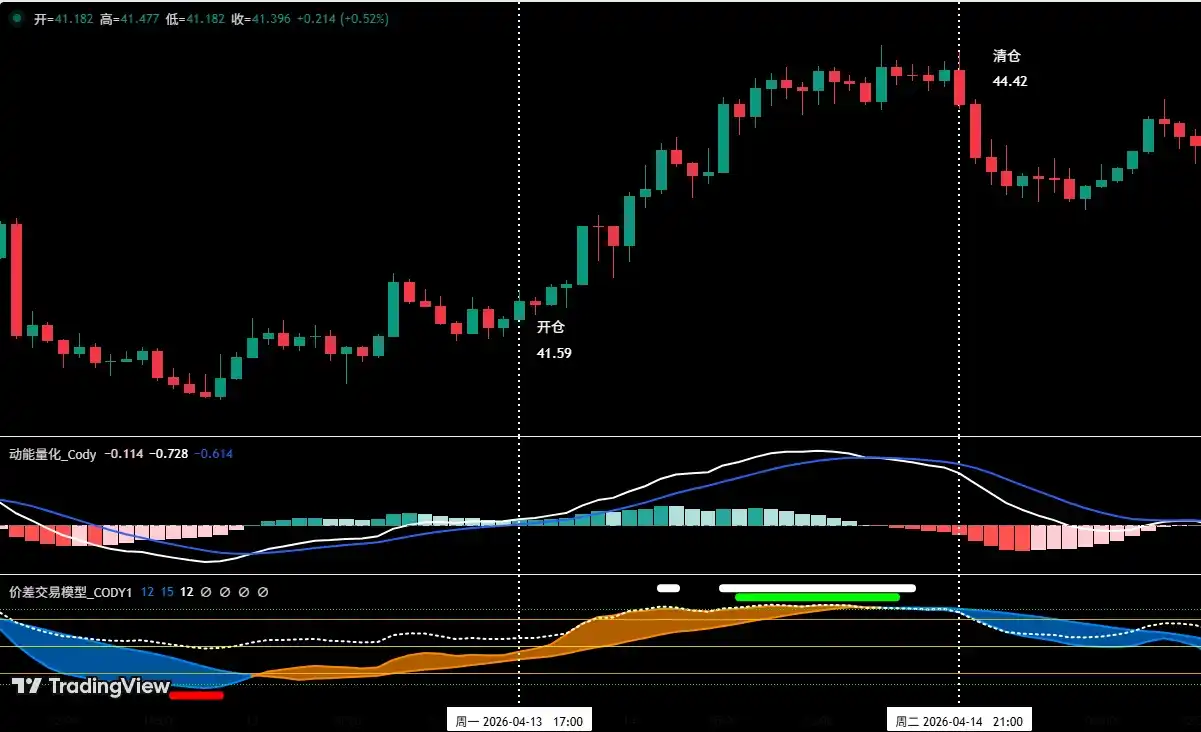
Figure 5 (Short-term Trading Illustration)

VI. Special Notes:

1. When opening a position: Immediately set the initial stop-loss level.

2. When profit reaches 1%: Move the stop-loss to the entry cost price (breakeven point) to ensure capital safety.

3. When profit reaches 2%: Move the stop-loss to the position of 1% profit.

4. Continuous tracking: Thereafter, for every additional 1% profit the coin price makes, move the stop-loss level up by 1% accordingly, dynamically protecting and locking in profits.

The financial market changes rapidly, all market analysis and trading strategies need to be adjusted dynamically. All views, analysis models, and operation strategies involved in this article are derived from personal technical analysis and are for personal trading log purposes only, not constituting any investment advice or operational basis. The market has risks, investment needs caution, please do not make decisions based on this.


Criptomoedas em alta

Perguntas relacionadas

QWhat is the key support level for HYPE that will determine its subsequent trend according to the article?

AThe key support level for HYPE is $40.17. If it holds above this level, it will maintain a boxed oscillation between $40.17 and $45.76; if it breaks below, the daily V-wave uptrend structure that started from the low of $34.44 on April 2 is likely complete.

QHow is the current Bitcoin (BTC) rebound from the $60,000 low on February 6 defined in the wave theory analysis presented?

AThe rebound is redefined as a larger 'D-wave rebound'. This is characterized by a prolonged and complex structure, lasting about 73 days with a maximum gain of approximately 30.6%, and it is currently testing key resistance areas.

QWhat are the two main short-term trading strategies proposed for Bitcoin in the article?

AThe two strategies are: A) Selling on rallies when the price rebounds to the $76,500~$79,000 area and meets resistance signals, and B) A breakout short strategy if the price effectively breaks below the $73,500 support level.

QWhat was the result of the short-term HYPE trade executed the previous week?

AA short-term long position (1x leverage) was executed, resulting in a cumulative realized profit of approximately 6.80%.

QWhat core principle should be followed for HYPE based on the overall uptrend prediction?

AThe core principle is to 'follow the trend and buy on dips', using a 30% position size and operating on 30-minute/60-minute cycles to capture long opportunities based on quantitative model signals.

Leituras Relacionadas

Must-Watch Events Next Week|CLARITY Act Could Face Senate Vote; SpaceX, Circle to Report Earnings (8.3-8.9)

**Summary: Key Events and Developments to Watch (August 3-9)** The upcoming week is marked by significant financial disclosures, key legislative deadlines, and notable product updates. **Major Financial Events:** Several companies are scheduled to release their Q2 2026 earnings. American Bitcoin (ABTC) will report on August 3, followed by SpaceX and Hut 8 Mining Corp. on August 4, and Circle on August 5. Notably, a significant portion of SpaceX shares (up to 12% of total shares) will be unlocked on August 6 following their earnings release. **Key Legislative Deadline:** The U.S. Senate faces an August 7 deadline to secure 60 votes for the CLARITY Act, a bipartisan bill aiming to establish a federal regulatory framework for cryptocurrencies. The Senate may hold a full vote on the bill during the week. **Economic Data:** The U.S. July Non-Farm Payrolls report will be released on August 7, providing crucial labor market data. **Technology & Product Updates:** * **Shutdowns:** DeFi portfolio tracker Zapper and wallet app Ctrl Wallet will cease operations on August 3. * **Upgrades:** LayerZero will deprecate its v1 relayers on August 3. XRP Ledger's new version 3.3.0, featuring five new functions, is expected next week. * **AI:** Elon Musk announced that the advanced Grok 4.6 AI model is set for release around August 7. * **Bitcoin:** The BIP-110 forced signaling for a potential Bitcoin network change is scheduled to begin around August 8. **Other Notable Events:** Chinese robotics firm Unitree Tech has set its preliminary price inquiry for its IPO for August 5. South Korean exchange Upbit will delist AQT and AERGO tokens on August 3.

marsbitHá 21m

Must-Watch Events Next Week|CLARITY Act Could Face Senate Vote; SpaceX, Circle to Report Earnings (8.3-8.9)

marsbitHá 21m

Stocks Are Plummeting More Sharply Than Cryptocurrencies. Where Has the Money Gone?

Stock Markets Plunge Deeper Than Cryptocurrencies: Where Did the Money Go? In late July, Seoul's Kospi index triggered circuit breakers for two consecutive days, plummeting over 40% from its June high. The collapse was led by heavyweight stocks like SK Hynix, whose record profits still disappointed investors, and devastating leveraged ETFs, with one major product losing over 83% of its value. This signaled a global, forced deleveraging targeting the most crowded trades. Interestingly, while stocks exhibited extreme volatility akin to crypto markets, Bitcoin rose nearly 15% in July after a prior steep drop. Analysis shows the money fleeing equities did not flow into Bitcoin. Instead, Bitcoin had already absorbed its sell-off in May-June, when U.S. spot Bitcoin ETFs saw historic outflows. The true safe-haven beneficiary was gold, whose price rose over 20% year-on-year, highlighting a decoupling between Bitcoin and gold as "digital gold." The sell-off was a targeted unwinding of leveraged positions in tech and semiconductors, accelerated by broker-dealer risk management and shifts in the AI narrative, including new competition from Chinese memory chipmakers. The retreat path was clear: from high-valuation tech stocks to cash and U.S. Treasuries, then to gold. For Bitcoin to attract sustained institutional inflows, conditions like eased global liquidity pressure, a "soft-landing" Fed rate cut, and U.S. regulatory clarity via legislation like the stalled CLARITY Act are needed. Currently, Bitcoin is not a safe haven but an already-cleared asset. Its low correlation with tech stocks, however, makes it a potential diversification play for institutional portfolios once the storm passes. The money isn't here yet, but the positioning is underway.

marsbitHá 21m

Stocks Are Plummeting More Sharply Than Cryptocurrencies. Where Has the Money Gone?

marsbitHá 21m

In Conversation with Ray Dalio: We Are Currently in an AI Bubble, with 1% of My Portfolio in Bitcoin

Ray Dalio, founder of Bridgewater Associates, warns in an interview that the current AI boom shows classic bubble characteristics, which could lead to significant economic downturns as seen in past cycles like 1929 or 2000. He explains that speculative enthusiasm, fueled by debt and overvaluation, often precedes a crash when rising rates or taxation force asset sales, causing widespread losses and recession. Dalio also outlines his "Big Cycle" theory, describing an approximate 80-year pattern where widening wealth gaps, massive government deficits, and shifting geopolitical power (like China's rise) create internal conflict and global instability. He emphasizes that we are in a late-cycle, transitional phase where traditional powers like the US and UK face decline. For personal wealth protection, Dalio advises diversification beyond cash into assets like stocks, bonds, real estate, and particularly gold, which he prefers over Bitcoin. While he holds about 1% of his portfolio in Bitcoin as a non-printable hard asset, he views gold as more secure from technological or governmental threats. Regarding AI's impact, Dalio believes it will disproportionately benefit capital owners, worsening inequality by replacing both physical and cognitive labor. He suggests that human intuition and emotional intelligence, combined with AI, will be key for future workers. On taxation, Dalio argues that wealth taxes are impractical and risk triggering asset sell-offs, reducing productive investment. He points to the UK as a cautionary example of debt, low productivity, and political strife. Geopolitically, Dalio foresees a more regionalized world, with the US showing weakness in prolonged conflicts like with Iran, akin to past imperial declines. The ideal outcome, he suggests, is coexisting powerful blocs (e.g., Americas, China-Asia Pacific) without major war.

marsbitHá 4h

In Conversation with Ray Dalio: We Are Currently in an AI Bubble, with 1% of My Portfolio in Bitcoin

marsbitHá 4h

Daily 7.2 Trillion KRW: Foreign Capital's Record Net Buying on Friday! Wall Street Says Headwinds for Korean Stock Fund Flows Have Subsided

South Korean stock market sees a dramatic shift in fund flows. On July 31, foreign investors made a record net purchase of approximately KRW 7.2 trillion in KOSPI stocks, marking a fundamental reversal from the persistent large-scale net outflows seen in previous months. This contributed to a significant narrowing of foreign net selling in July to KRW 9.8 trillion, down sharply from KRW 48.4 trillion in June and KRW 44.5 trillion in May. Simultaneously, domestic institutional pressure eased. South Korean pension funds and asset managers turned to a net buying position in July, purchasing KRW 1.0 trillion worth of KOSPI shares, contrasting with net sales in May and June. Market volatility is expected to be dampened by new financial regulations. Effective July 31, the Financial Services Commission tightened access for retail investors to single-stock leveraged ETFs by raising the minimum cash deposit requirement. Trading volumes for these products subsequently dropped to about 50% of their monthly average. Citigroup Research maintains its year-end KOSPI target of 10,000 points. The firm cites several supportive factors: the substantial easing of headwinds from capital outflows, a robust fundamental outlook for the semiconductor sector, historically low market valuations, strong economic fundamentals, and the potential for policy support from financial authorities if needed.

marsbitHá 4h

Daily 7.2 Trillion KRW: Foreign Capital's Record Net Buying on Friday! Wall Street Says Headwinds for Korean Stock Fund Flows Have Subsided

marsbitHá 4h

Trading

Spot

Artigos em Destaque

O que é BITCOIN

Compreender o HarryPotterObamaSonic10Inu (ERC-20) e a Sua Posição no Espaço Cripto Nos últimos anos, o mercado de criptomoedas assistiu a um aumento na popularidade das moedas meme, cativando não apenas os traders, mas também aqueles que procuram envolvimento comunitário e valor de entretenimento. Entre estes tokens únicos está o HarryPotterObamaSonic10Inu (ERC-20), um projeto intrigante que mistura referências culturais no tecido das criptomoedas. Este artigo explora os principais aspetos do HarryPotterObamaSonic10Inu, examinando os seus mecanismos, a sua ética orientada pela comunidade e o seu envolvimento com o vasto panorama cripto. O que é o HarryPotterObamaSonic10Inu (ERC-20)? Como o nome sugere, o HarryPotterObamaSonic10Inu é uma moeda meme construída na blockchain Ethereum, classificada sob o padrão ERC-20. Ao contrário das criptomoedas tradicionais, que podem enfatizar a utilidade prática ou o potencial de investimento, este token prospera no valor de entretenimento e na força da sua comunidade. O projeto visa promover um ambiente onde utilizadores envolvidos possam reunir-se, partilhar ideias e participar em atividades inspiradas por diversos fenómenos culturais. Uma característica notável do HarryPotterObamaSonic10Inu é a zero taxa sobre transações. Este elemento atraente visa encorajar a negociação e o envolvimento da comunidade, isento de encargos adicionais que podem desencorajar os traders de pequena escala. A oferta total da moeda está fixada em mil milhões de tokens, uma cifra que marca a sua intenção de manter uma circulação substancial dentro da comunidade. Criador do HarryPotterObamaSonic10Inu (ERC-20) As origens do HarryPotterObamaSonic10Inu estão um pouco envoltas em mistério; os detalhes sobre o criador permanecem desconhecidos. O desenvolvimento deste token carece de uma equipa identificável ou de um plano explícito, o que não é raro no setor das moedas meme. Em vez disso, o projeto surgiu de forma orgânica, com o seu progresso a depender fortemente do entusiasmo e da participação da sua comunidade. Investidores do HarryPotterObamaSonic10Inu (ERC-20) No que diz respeito a investimentos externos e apoios, o HarryPotterObamaSonic10Inu também permanece ambíguo. O token não lista quaisquer fundações de investimento conhecidas ou apoio organizacional significativo. Em vez disso, o “sangue vital” do projeto é a sua comunidade de base, que informa o seu crescimento e sustentabilidade através da ação coletiva e do envolvimento no espaço cripto. Como Funciona o HarryPotterObamaSonic10Inu (ERC-20)? Como uma moeda meme, o HarryPotterObamaSonic10Inu opera principalmente fora dos quadros tradicionais que muitas vezes governam o valor dos ativos. Existem vários aspetos distintivos que definem como o projeto funciona: Transações Sem Taxas: Sem taxas sobre transações, os utilizadores podem comprar e vender o token livremente, sem a preocupação de custos ocultos. Envolvimento da Comunidade: O projeto prospera na interação da comunidade, aproveitando plataformas de redes sociais para criar entusiasmo e facilitar a participação. Discussões, partilha de conteúdo e envolvimento são elementos cruciais que ajudam a expandir o seu alcance e a fomentar a lealdade entre os apoiantes. Sem Utilidade Prática: Deve ser notado que o HarryPotterObamaSonic10Inu não oferece utilidade concreta dentro do ecossistema financeiro. Em vez disso, é classificado como um token principalmente para entretenimento e atividades comunitárias. Referência Cultural: O token incorpora de forma inteligente elementos da cultura popular para atrair interesse, conectando-se tanto com entusiastas de memes como com seguidores de criptomoedas. HarryPotterObamaSonic10Inu exemplifica como as moedas meme operam de forma diferente de projetos de criptomoedas mais tradicionais, entrando no mercado como construções sociais inovadoras em vez de ativos utilitários. Linha do Tempo do HarryPotterObamaSonic10Inu (ERC-20) A história do HarryPotterObamaSonic10Inu é marcada por vários marcos notáveis: Criação: O token surgiu de um meme viral, capturando a imaginação de muitos entusiastas de criptomoedas. Datas específicas de criação não estão disponíveis, sublinhando a sua ascensão orgânica. Listagem em Exchanges: O HarryPotterObamaSonic10Inu conseguiu entrar em várias exchanges, permitindo um acesso e negociação mais fáceis pela comunidade. Iniciativas de Envolvimento da Comunidade: Atividades contínuas direcionadas a melhorar a interação comunitária, incluindo concursos, campanhas em redes sociais e geração de conteúdo por fãs e defensores. Planos de Expansão Futura: O roteiro do projeto inclui o lançamento de uma coleção de NFTs, mercadorias e um site de eCommerce relacionado aos seus temas culturais, envolvendo ainda mais a comunidade e tentando adicionar mais dimensões ao seu ecossistema. Pontos-Chave sobre o HarryPotterObamaSonic10Inu (ERC-20) Natureza Orientada pela Comunidade: O projeto prioriza a contribuição coletiva e a criatividade, assegurando que o envolvimento dos utilizadores está na vanguarda do seu desenvolvimento. Classificação como Moeda Meme: Representa o epítome da criptomoeda baseada em entretenimento, destacando-se dos veículos de investimento tradicionais. Sem Afiliação Direta com o Bitcoin: Apesar da semelhança no nome do ticker, o HarryPotterObamaSonic10Inu é distinto e não tem qualquer relação com o Bitcoin ou outras criptomoedas estabelecidas. Foco na Colaboração: O HarryPotterObamaSonic10Inu é projetado para criar um espaço de colaboração e partilha de histórias entre os seus detentores, proporcionando uma via para a criatividade e o fortalecimento da comunidade. Perspectivas Futuras: A ambição de expandir além da sua premissa inicial para NFTs e mercadorias delineia um caminho para o projeto potencialmente entrar em avenidas mais mainstream dentro da cultura digital. À medida que as moedas meme continuam a capturar a imaginação da comunidade cripto, HarryPotterObamaSonic10Inu (ERC-20) destaca-se devido aos seus laços culturais e abordagem centrada na comunidade. Embora possa não se encaixar no molde típico de um token orientado para utilidade, a sua essência reside na alegria e camaradagem fomentadas entre os seus apoiantes, destacando a natureza em evolução das criptomoedas em uma era cada vez mais digital. À medida que o projeto continua a desenvolver-se, será importante observar como as dinâmicas comunitárias influenciam a sua trajetória no panorama em constante mudança da tecnologia blockchain.

2.0k Visualizações TotaisPublicado em {updateTime}Atualizado em 2024.12.03

O que é BITCOIN

Como comprar BTC

Bem-vindo à HTX.com!Tornámos a compra de Bitcoin (BTC) simples e conveniente.Segue o nosso guia passo a passo para iniciar a tua jornada no mundo das criptos.Passo 1: cria a tua conta HTXUtiliza o teu e-mail ou número de telefone para te inscreveres numa conta gratuita na HTX.Desfruta de um processo de inscrição sem complicações e desbloqueia todas as funcionalidades.Obter a minha contaPasso 2: vai para Comprar Cripto e escolhe o teu método de pagamentoCartão de crédito/débito: usa o teu visa ou mastercard para comprar Bitcoin (BTC) instantaneamente.Saldo: usa os fundos da tua conta HTX para transacionar sem problemas.Terceiros: adicionamos métodos de pagamento populares, como Google Pay e Apple Pay, para aumentar a conveniência.P2P: transaciona diretamente com outros utilizadores na HTX.Mercado de balcão (OTC): oferecemos serviços personalizados e taxas de câmbio competitivas para os traders.Passo 3: armazena teu Bitcoin (BTC)Depois de comprar o teu Bitcoin (BTC), armazena-o na tua conta HTX.Alternativamente, podes enviá-lo para outro lugar através de transferência blockchain ou usá-lo para transacionar outras criptomoedas.Passo 4: transaciona Bitcoin (BTC)Transaciona facilmente Bitcoin (BTC) no mercado à vista da HTX.Acede simplesmente à tua conta, seleciona o teu par de trading, executa as tuas transações e monitoriza em tempo real.Oferecemos uma experiência de fácil utilização tanto para principiantes como para traders experientes.

4.5k Visualizações TotaisPublicado em {updateTime}Atualizado em 2026.06.02

Como comprar BTC

O que é $BITCOIN

OURO DIGITAL ($BITCOIN): Uma Análise Abrangente Introdução ao OURO DIGITAL ($BITCOIN) OURO DIGITAL ($BITCOIN) é um projeto baseado em blockchain que opera na rede Solana, com o objetivo de combinar as características dos metais preciosos tradicionais com a inovação das tecnologias descentralizadas. Embora partilhe um nome com o Bitcoin, frequentemente referido como “ouro digital” devido à sua percepção como uma reserva de valor, o OURO DIGITAL é um token separado projetado para criar um ecossistema único dentro da paisagem Web3. O seu objetivo é posicionar-se como um ativo digital alternativo viável, embora os detalhes sobre as suas aplicações e funcionalidades ainda estejam em desenvolvimento. O que é o OURO DIGITAL ($BITCOIN)? OURO DIGITAL ($BITCOIN) é um token de criptomoeda explicitamente projetado para uso na blockchain Solana. Em contraste com o Bitcoin, que fornece um papel amplamente reconhecido como armazenamento de valor, este token parece focar em aplicações e características mais amplas. Aspectos notáveis incluem: Infraestrutura Blockchain: O token é construído na blockchain Solana, conhecida pela sua capacidade de lidar com transações de alta velocidade e baixo custo. Dinâmicas de Oferta: O OURO DIGITAL tem um fornecimento máximo limitado a 100 quatrilhões de tokens (100P $BITCOIN), embora os detalhes sobre o seu fornecimento circulante ainda não tenham sido divulgados. Utilidade: Embora as funcionalidades precisas não estejam explicitamente delineadas, existem indicações de que o token poderia ser utilizado para várias aplicações, potencialmente envolvendo aplicações descentralizadas (dApps) ou estratégias de tokenização de ativos. Quem é o Criador do OURO DIGITAL ($BITCOIN)? Neste momento, a identidade dos criadores e da equipa de desenvolvimento por trás do OURO DIGITAL ($BITCOIN) permanece desconhecida. Esta situação é típica entre muitos projetos inovadores no espaço da blockchain, particularmente aqueles alinhados com finanças descentralizadas e fenómenos de moedas meme. Embora tal anonimato possa fomentar uma cultura orientada pela comunidade, intensifica as preocupações sobre governança e responsabilidade. Quem são os Investidores do OURO DIGITAL ($BITCOIN)? As informações disponíveis indicam que o OURO DIGITAL ($BITCOIN) não tem apoiantes institucionais conhecidos ou investimentos proeminentes de capital de risco. O projeto parece operar num modelo peer-to-peer focado no apoio e adoção da comunidade, em vez de rotas de financiamento tradicionais. A sua atividade e liquidez estão principalmente situadas em exchanges descentralizadas (DEXs), como a PumpSwap, em vez de plataformas de negociação centralizadas estabelecidas, destacando ainda mais a sua abordagem de base. Como Funciona o OURO DIGITAL ($BITCOIN) A mecânica operacional do OURO DIGITAL ($BITCOIN) pode ser elaborada com base no seu design de blockchain e nas características da rede: Mecanismo de Consenso: Ao aproveitar o exclusivo proof-of-history (PoH) da Solana combinado com um modelo de proof-of-stake (PoS), o projeto assegura uma validação eficiente das transações, contribuindo para o alto desempenho da rede. Tokenomics: Embora mecanismos deflacionários específicos não tenham sido extensivamente detalhados, o vasto fornecimento máximo de tokens implica que pode atender a microtransações ou casos de uso de nicho que ainda estão por definir. Interoperabilidade: Existe o potencial para integração com o ecossistema mais amplo da Solana, incluindo várias plataformas de finanças descentralizadas (DeFi). No entanto, os detalhes sobre integrações específicas permanecem não especificados. Cronologia de Eventos Chave Aqui está uma cronologia que destaca marcos significativos relacionados ao OURO DIGITAL ($BITCOIN): 2023: O lançamento inicial do token ocorre na blockchain Solana, marcado pelo seu endereço de contrato. 2024: O OURO DIGITAL ganha visibilidade ao tornar-se disponível para negociação em exchanges descentralizadas como a PumpSwap, permitindo que os utilizadores o negociem contra SOL. 2025: O projeto testemunha atividade de negociação esporádica e potencial interesse em envolvimentos liderados pela comunidade, embora não tenham sido documentadas parcerias ou avanços técnicos notáveis até ao momento. Análise Crítica Forças Escalabilidade: A infraestrutura subjacente da Solana suporta altos volumes de transações, o que pode aumentar a utilidade do $BITCOIN em vários cenários de transação. Acessibilidade: O potencial preço de negociação baixo por token pode atrair investidores de retalho, facilitando uma participação mais ampla devido a oportunidades de propriedade fracionada. Riscos Falta de Transparência: A ausência de apoiantes, desenvolvedores ou um processo de auditoria publicamente conhecidos pode gerar ceticismo em relação à sustentabilidade e confiabilidade do projeto. Volatilidade do Mercado: A atividade de negociação depende fortemente do comportamento especulativo, o que pode resultar em volatilidade significativa dos preços e incerteza para os investidores. Conclusão O OURO DIGITAL ($BITCOIN) surge como um projeto intrigante, mas ambíguo, dentro do ecossistema em rápida evolução da Solana. Embora tente aproveitar a narrativa do “ouro digital”, a sua divergência do papel estabelecido do Bitcoin como reserva de valor sublinha a necessidade de uma diferenciação mais clara da sua utilidade pretendida e estrutura de governança. A aceitação e adoção futuras dependerão provavelmente da abordagem da atual opacidade e da definição mais explícita das suas estratégias operacionais e económicas. Nota: Este relatório abrange informações sintetizadas disponíveis até outubro de 2023, e desenvolvimentos podem ter ocorrido além do período de pesquisa.

242 Visualizações TotaisPublicado em {updateTime}Atualizado em 2025.05.13

O que é $BITCOIN

Discussões

Bem-vindo à Comunidade HTX. Aqui, pode manter-se informado sobre os mais recentes desenvolvimentos da plataforma e obter acesso a análises profissionais de mercado. As opiniões dos utilizadores sobre o preço de BTC (BTC) são apresentadas abaixo.

活动图片













