Bitcoin"Rally Only for Selling": Three Core Arguments of BTC Market Bears
Multiple analysts believe that BTC's rally is actually a bull trap, warning that its price could fall to the $40,000 level in the coming months.

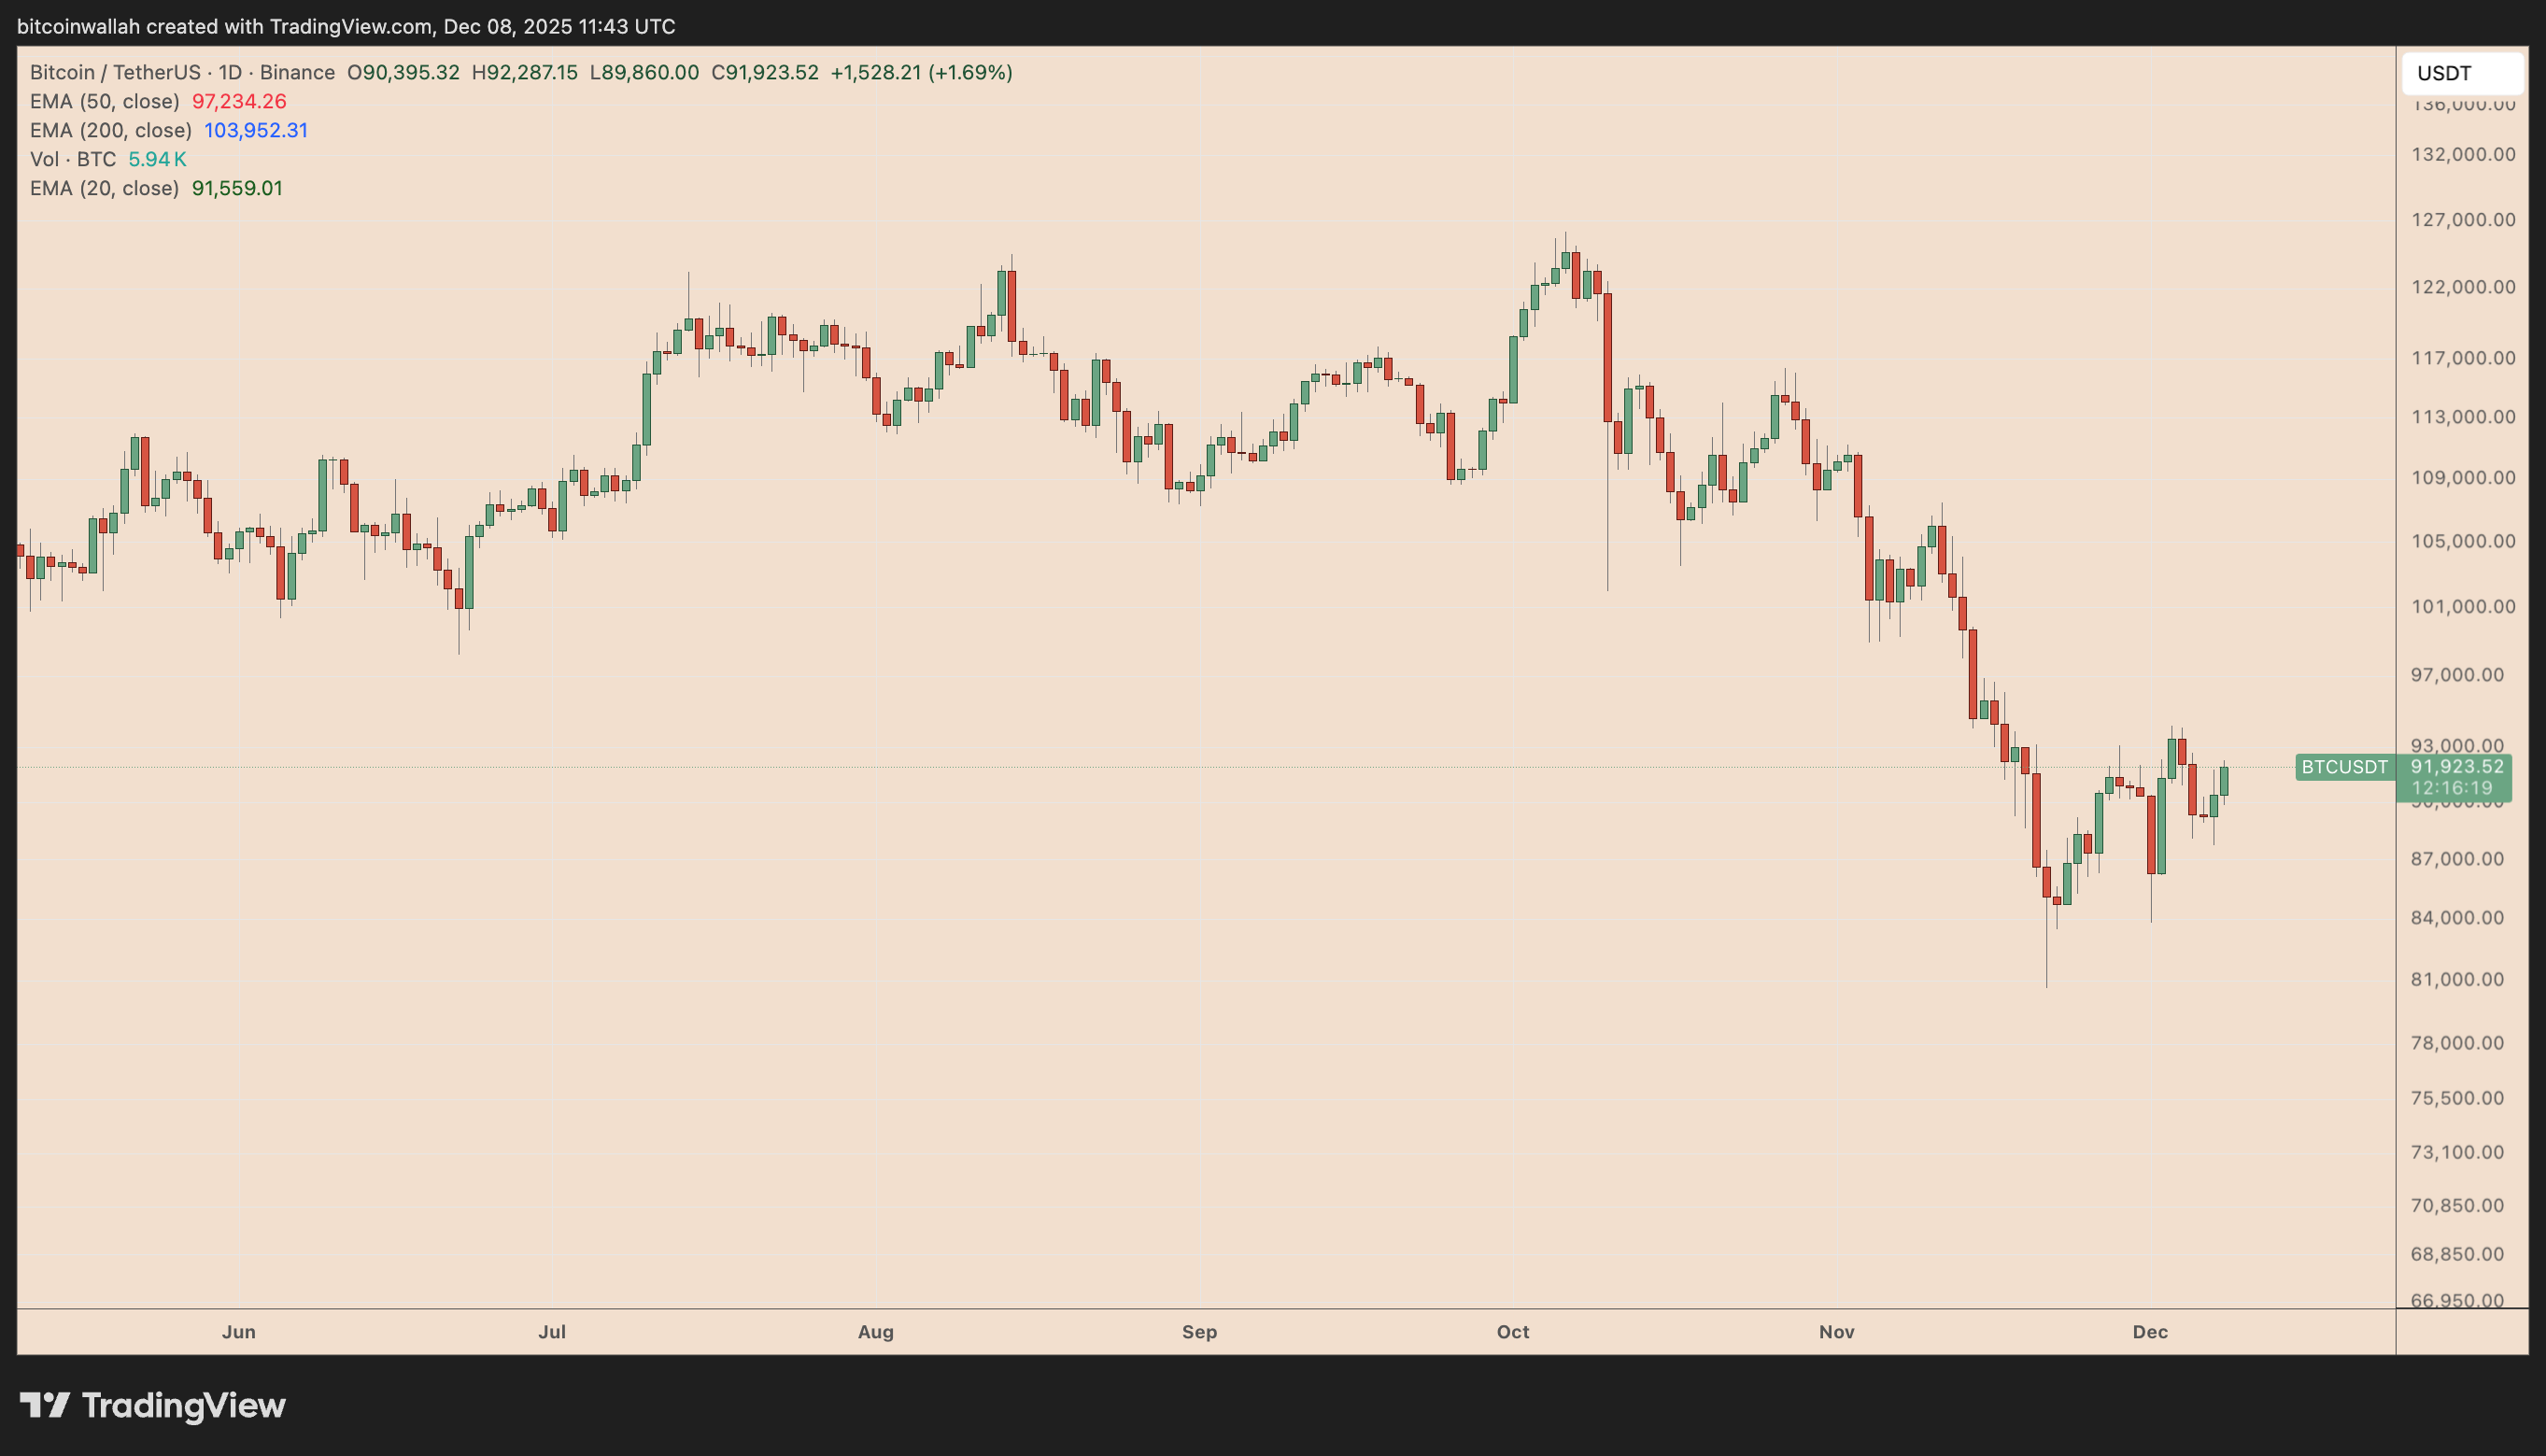
Bitcoin (BTC) has climbed 14.50% from its recent low of $86,000, returning to near $93,000, while traders are sharply divided on whether this is a bull "recovery" or a bear market rally.
Key Points:
Analysts point out that BTC's rally is actually a bull trap, with risks potentially expanding to as low as $40,000.
Google Trends data suggests the price may first rebound to $97,000 before continuing its adjustment.
Among the analysts holding a bearish stance, CryptoBirb maintains a firm position, believing that the current and future BTC price "rally is only for selling," rather than a signal to impact the widely expected year-end target of $150,000 and higher.
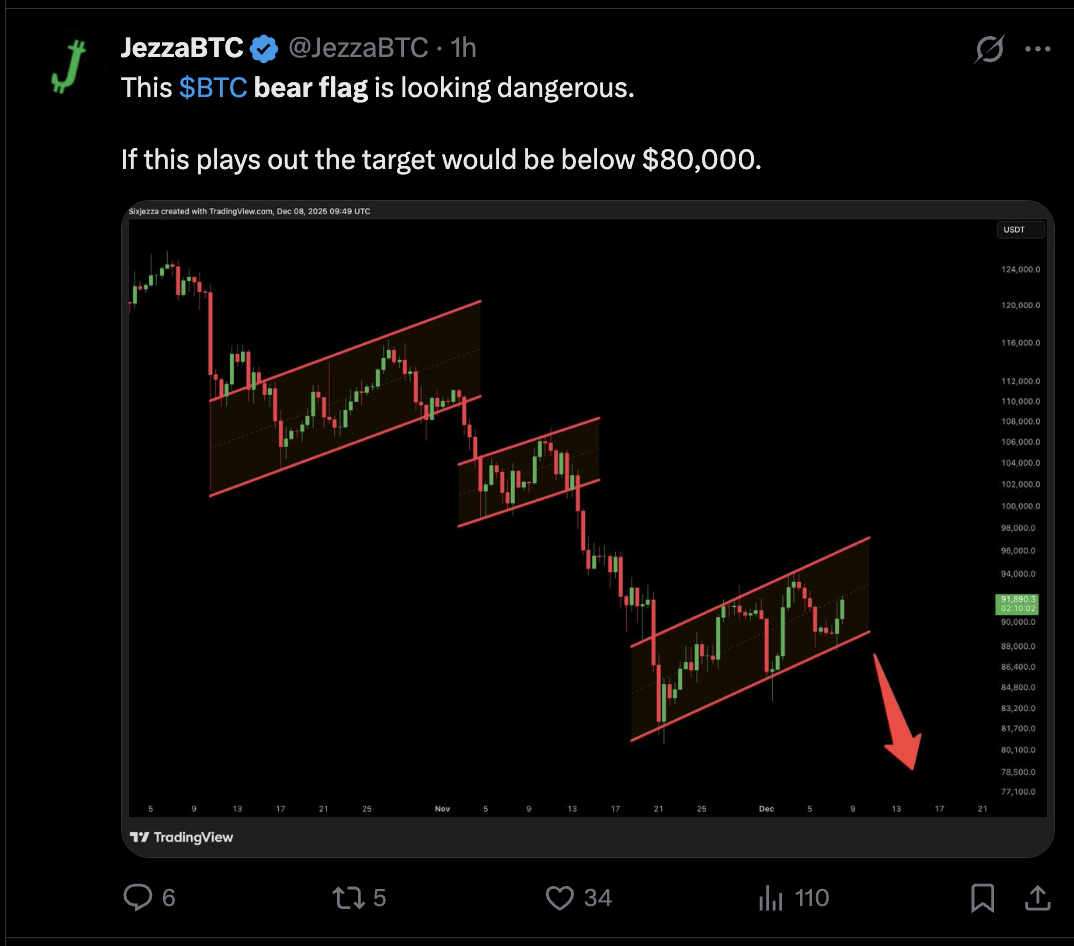
Bear Flag Pattern Suggests BTC Price May Fall 16%
The primary argument supporting the BTC bull trap theory mentions a classic technical pattern called the "bear flag," a structure that often evolves into further decline during a downtrend.
Mister Crypto, Celeb Franzen, and several other analysts pointed out this bearish continuation pattern during BTC's rebound, with some analysts indicating that the BTC price could likely fall to $80,000.
An in-depth analysis of the bear flag pattern reveals its December technical downside target is approximately $77,100, a value calculated by adding the height of the prior downtrend to the potential breakout point near the $88,000 support level.
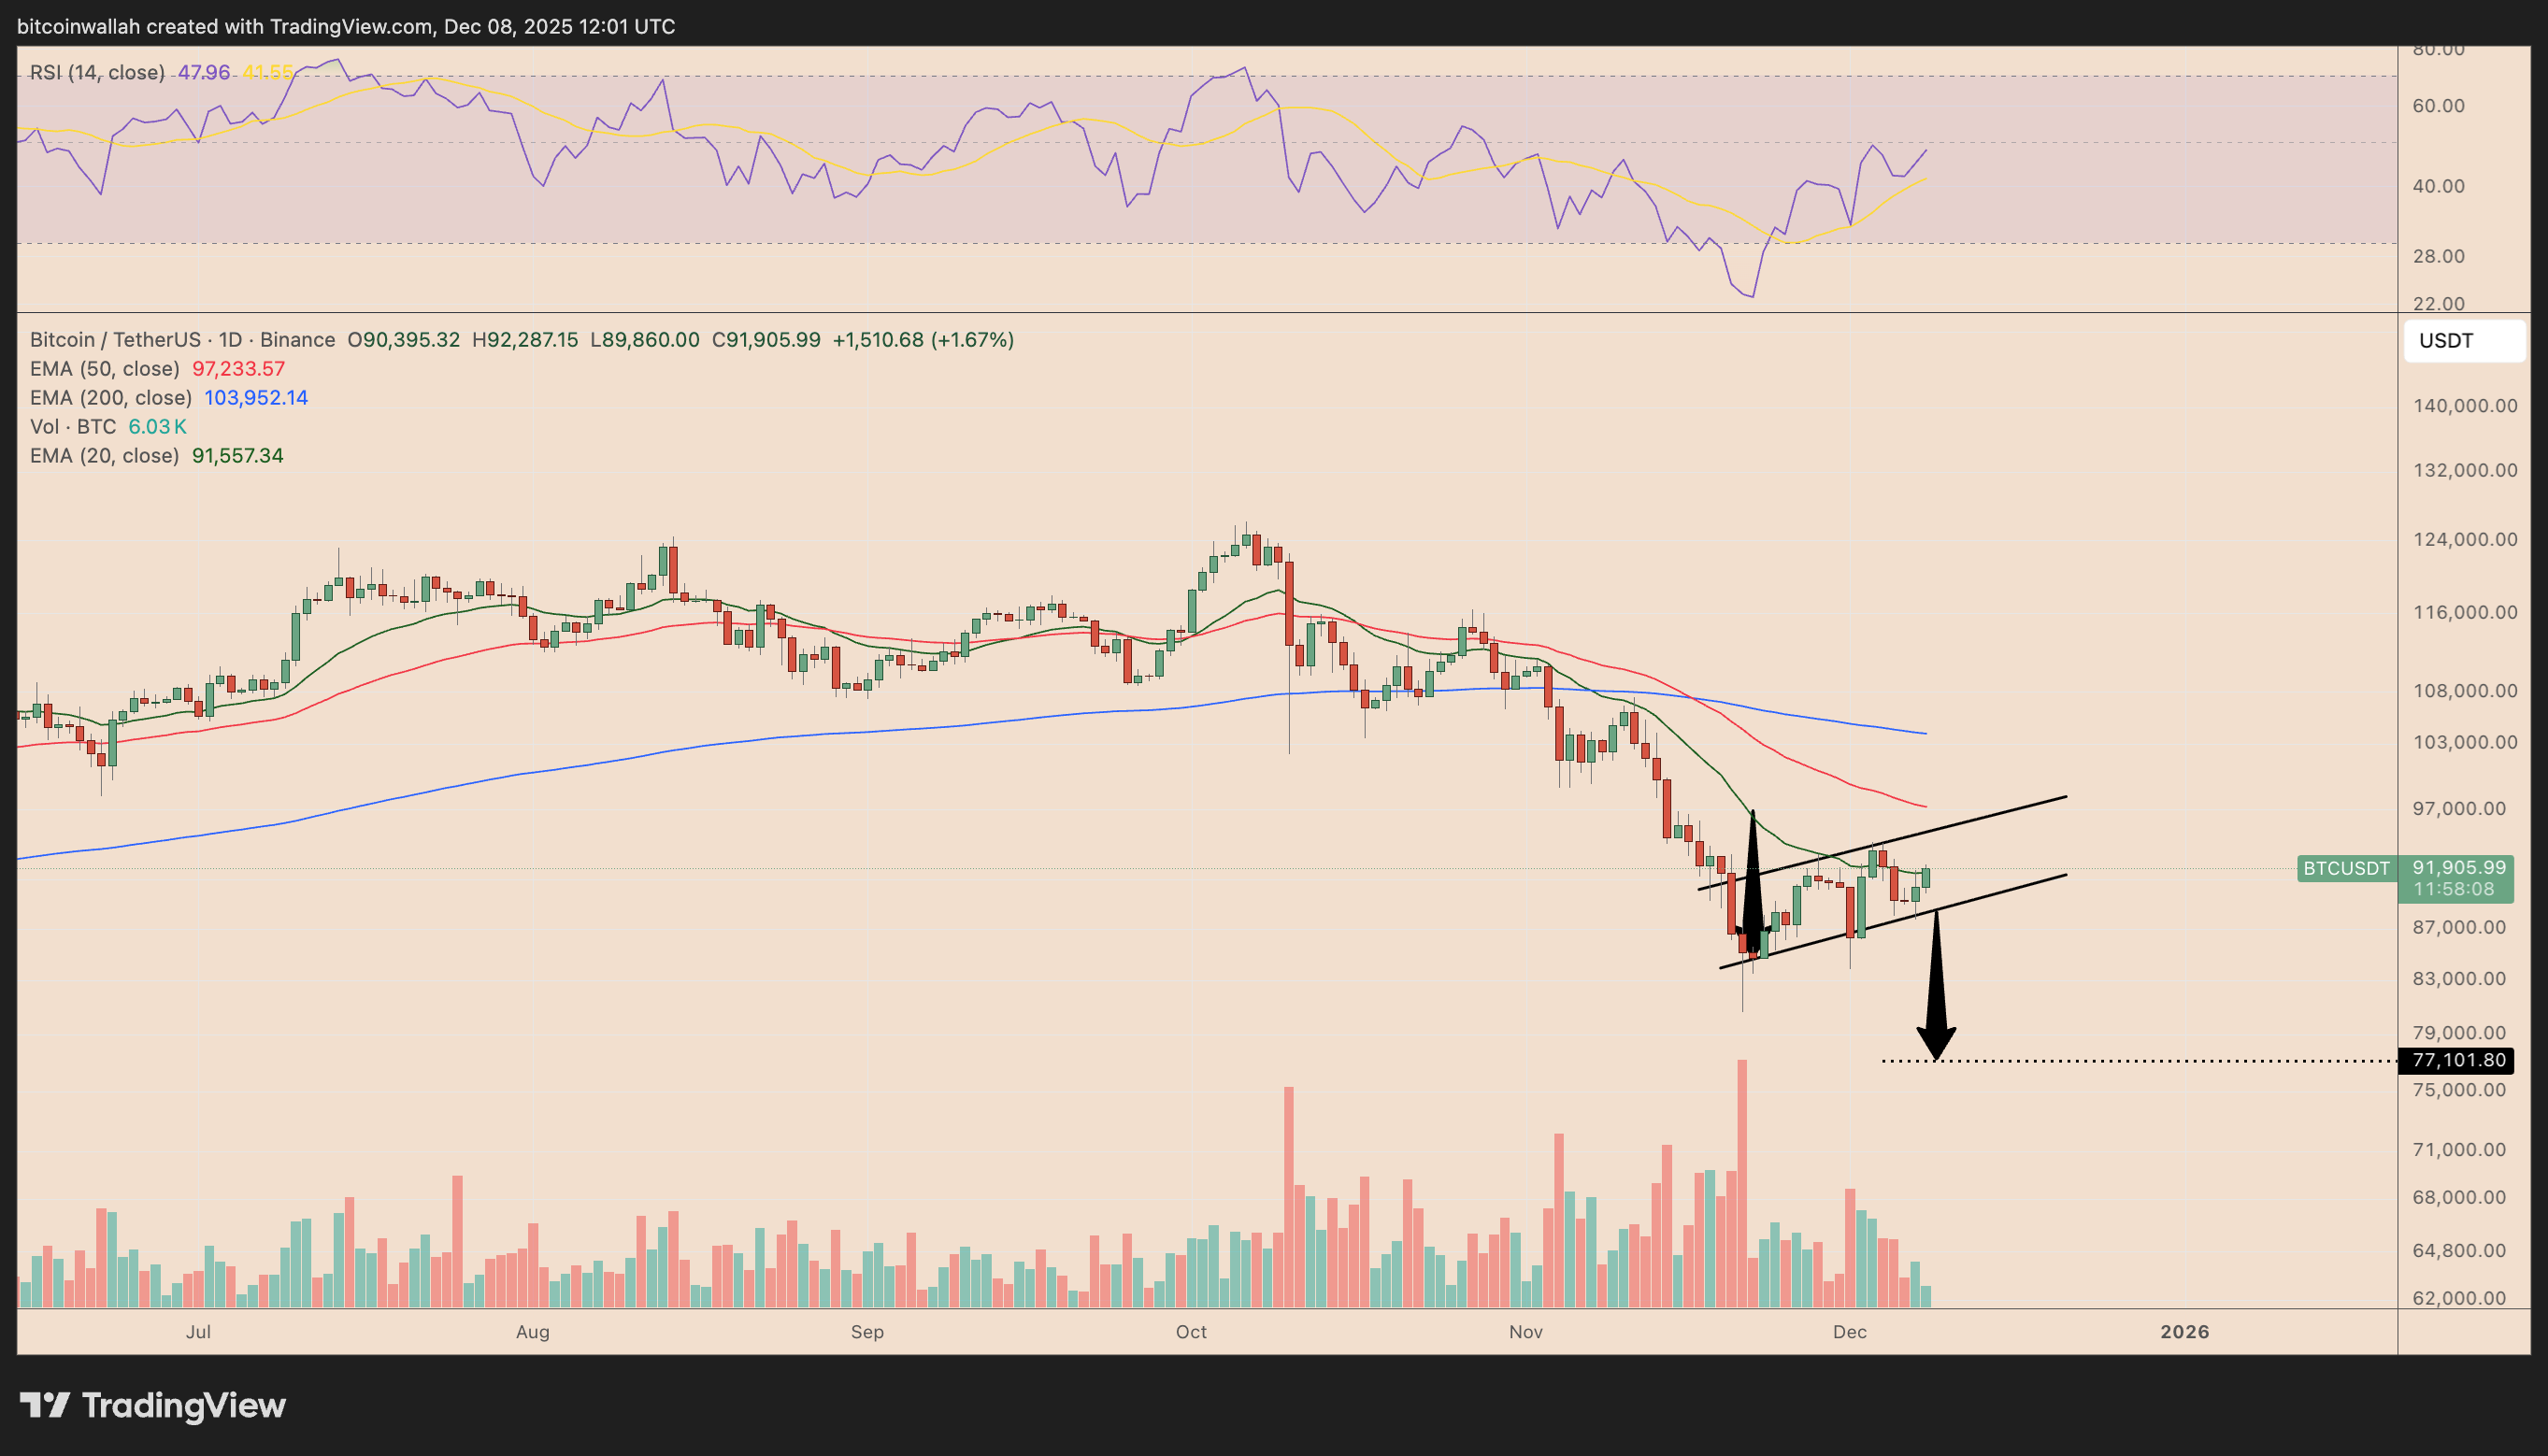
This would represent a drop of about 16% from the current price level.
If the 2021 Pattern Repeats, BTC Could Crash to $40,000
Analyst Leshka pointed out that BTC's current structure is "almost identical" to the 2021 cycle.
He shared a BTC pattern comparison chart, including the recurring double-top pattern, a sharp drop towards the cycle support level, and a deceptive rally, ultimately forming a bull trap, followed by a more violent crash.
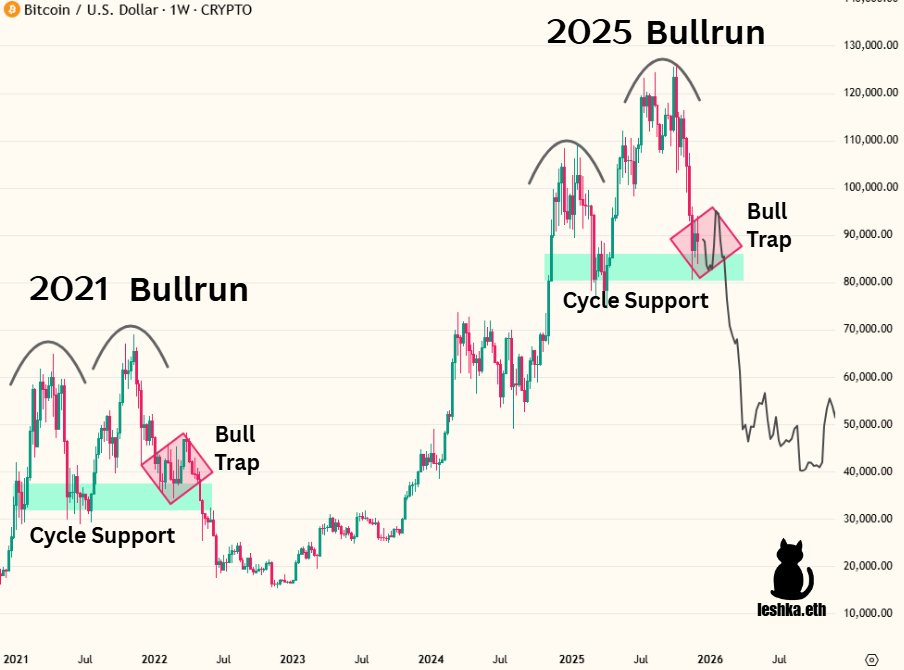
In the similar situation in 2021, this trap was followed by a long-term decline, halving BTC's value. The 2025 pattern shows an almost identical setup, with the price oscillating within the same support zone, expected to break downward subsequently.
Leshka warned that if this pattern repeats, BTC could return to the $40,000 area in early 2026, a drop of over 50% from current levels.
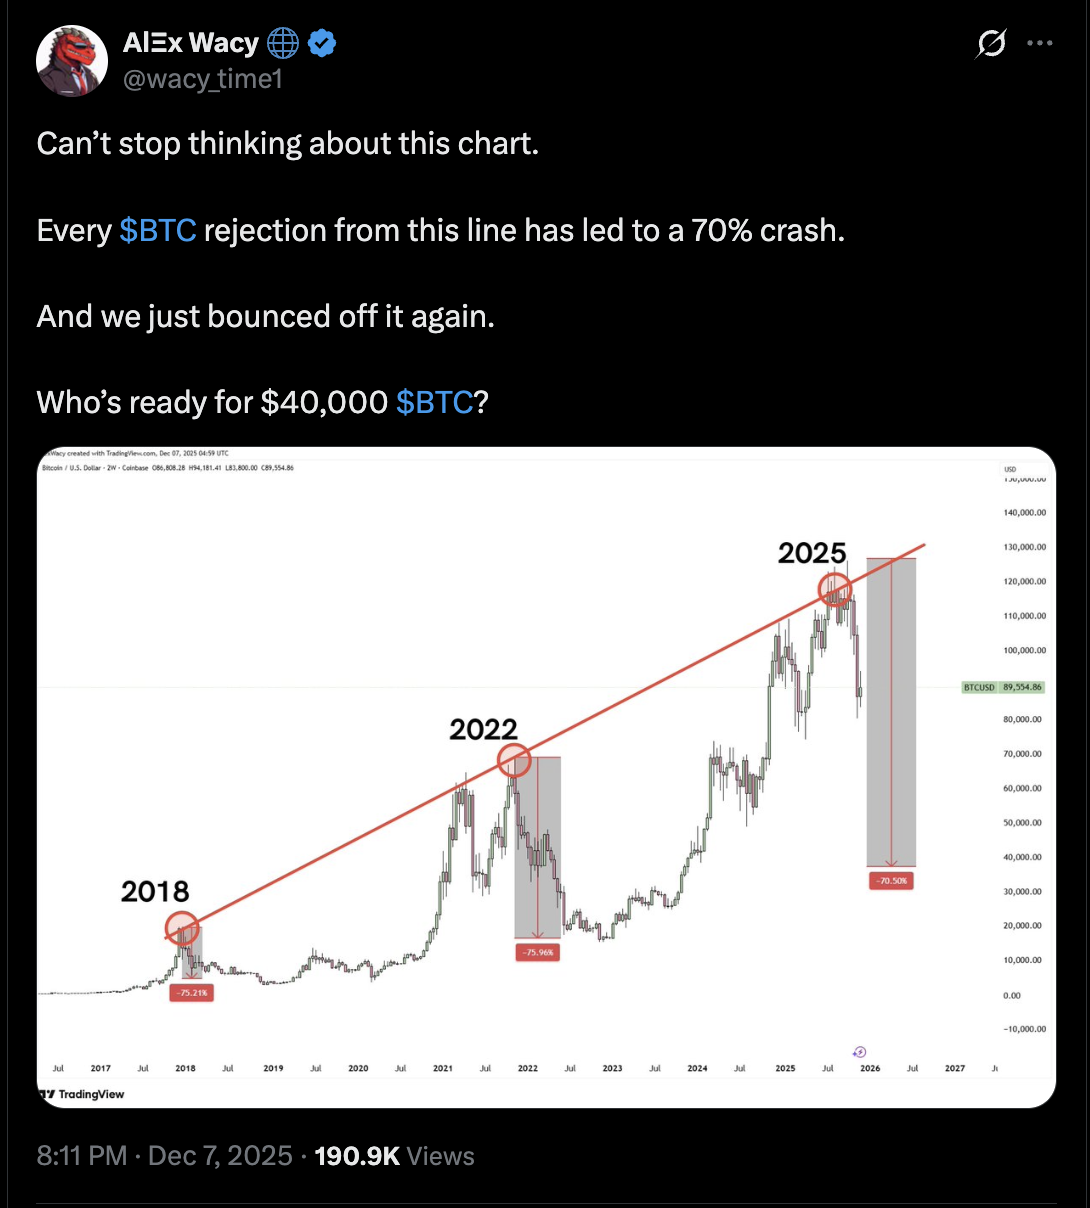
Analyst Alex Wacy also pointed to the same downside target, citing BTC's pullback from the multi-year uptrend resistance line, a situation that often leads to a 70% retracement.
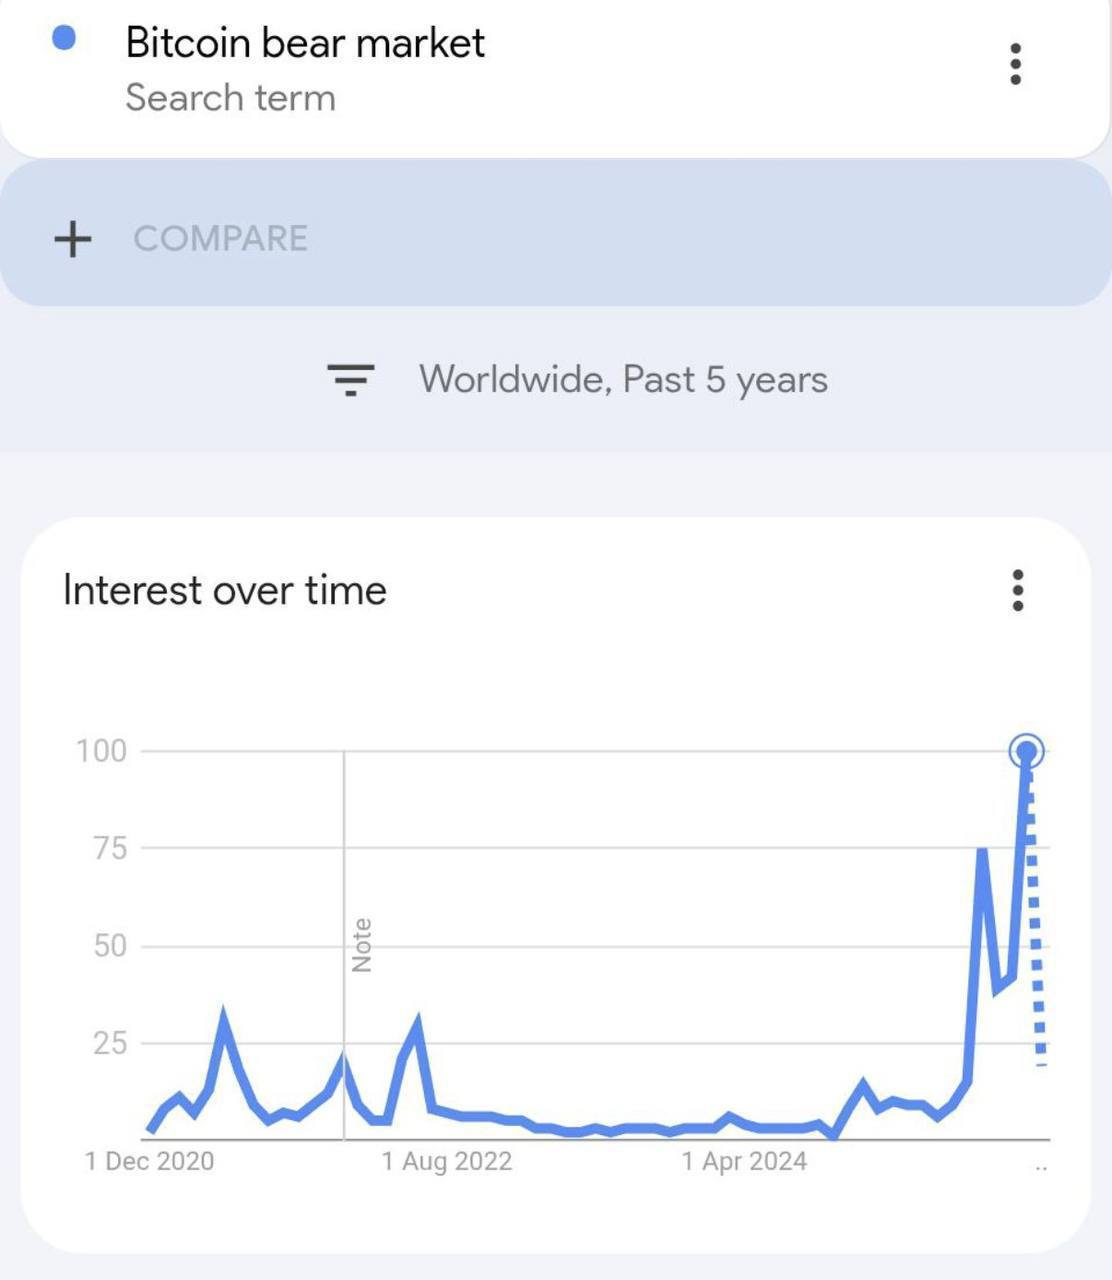
Google Trends Data Shows BTC Crowd Panicking Again
Analyst AndrewBTC pointed out in a post published on platform X on Monday that last week's Google search volume for "Bitcoin bear market" hit a new five-year high within the framework, indicating that the BTC "crowd is panicking again."
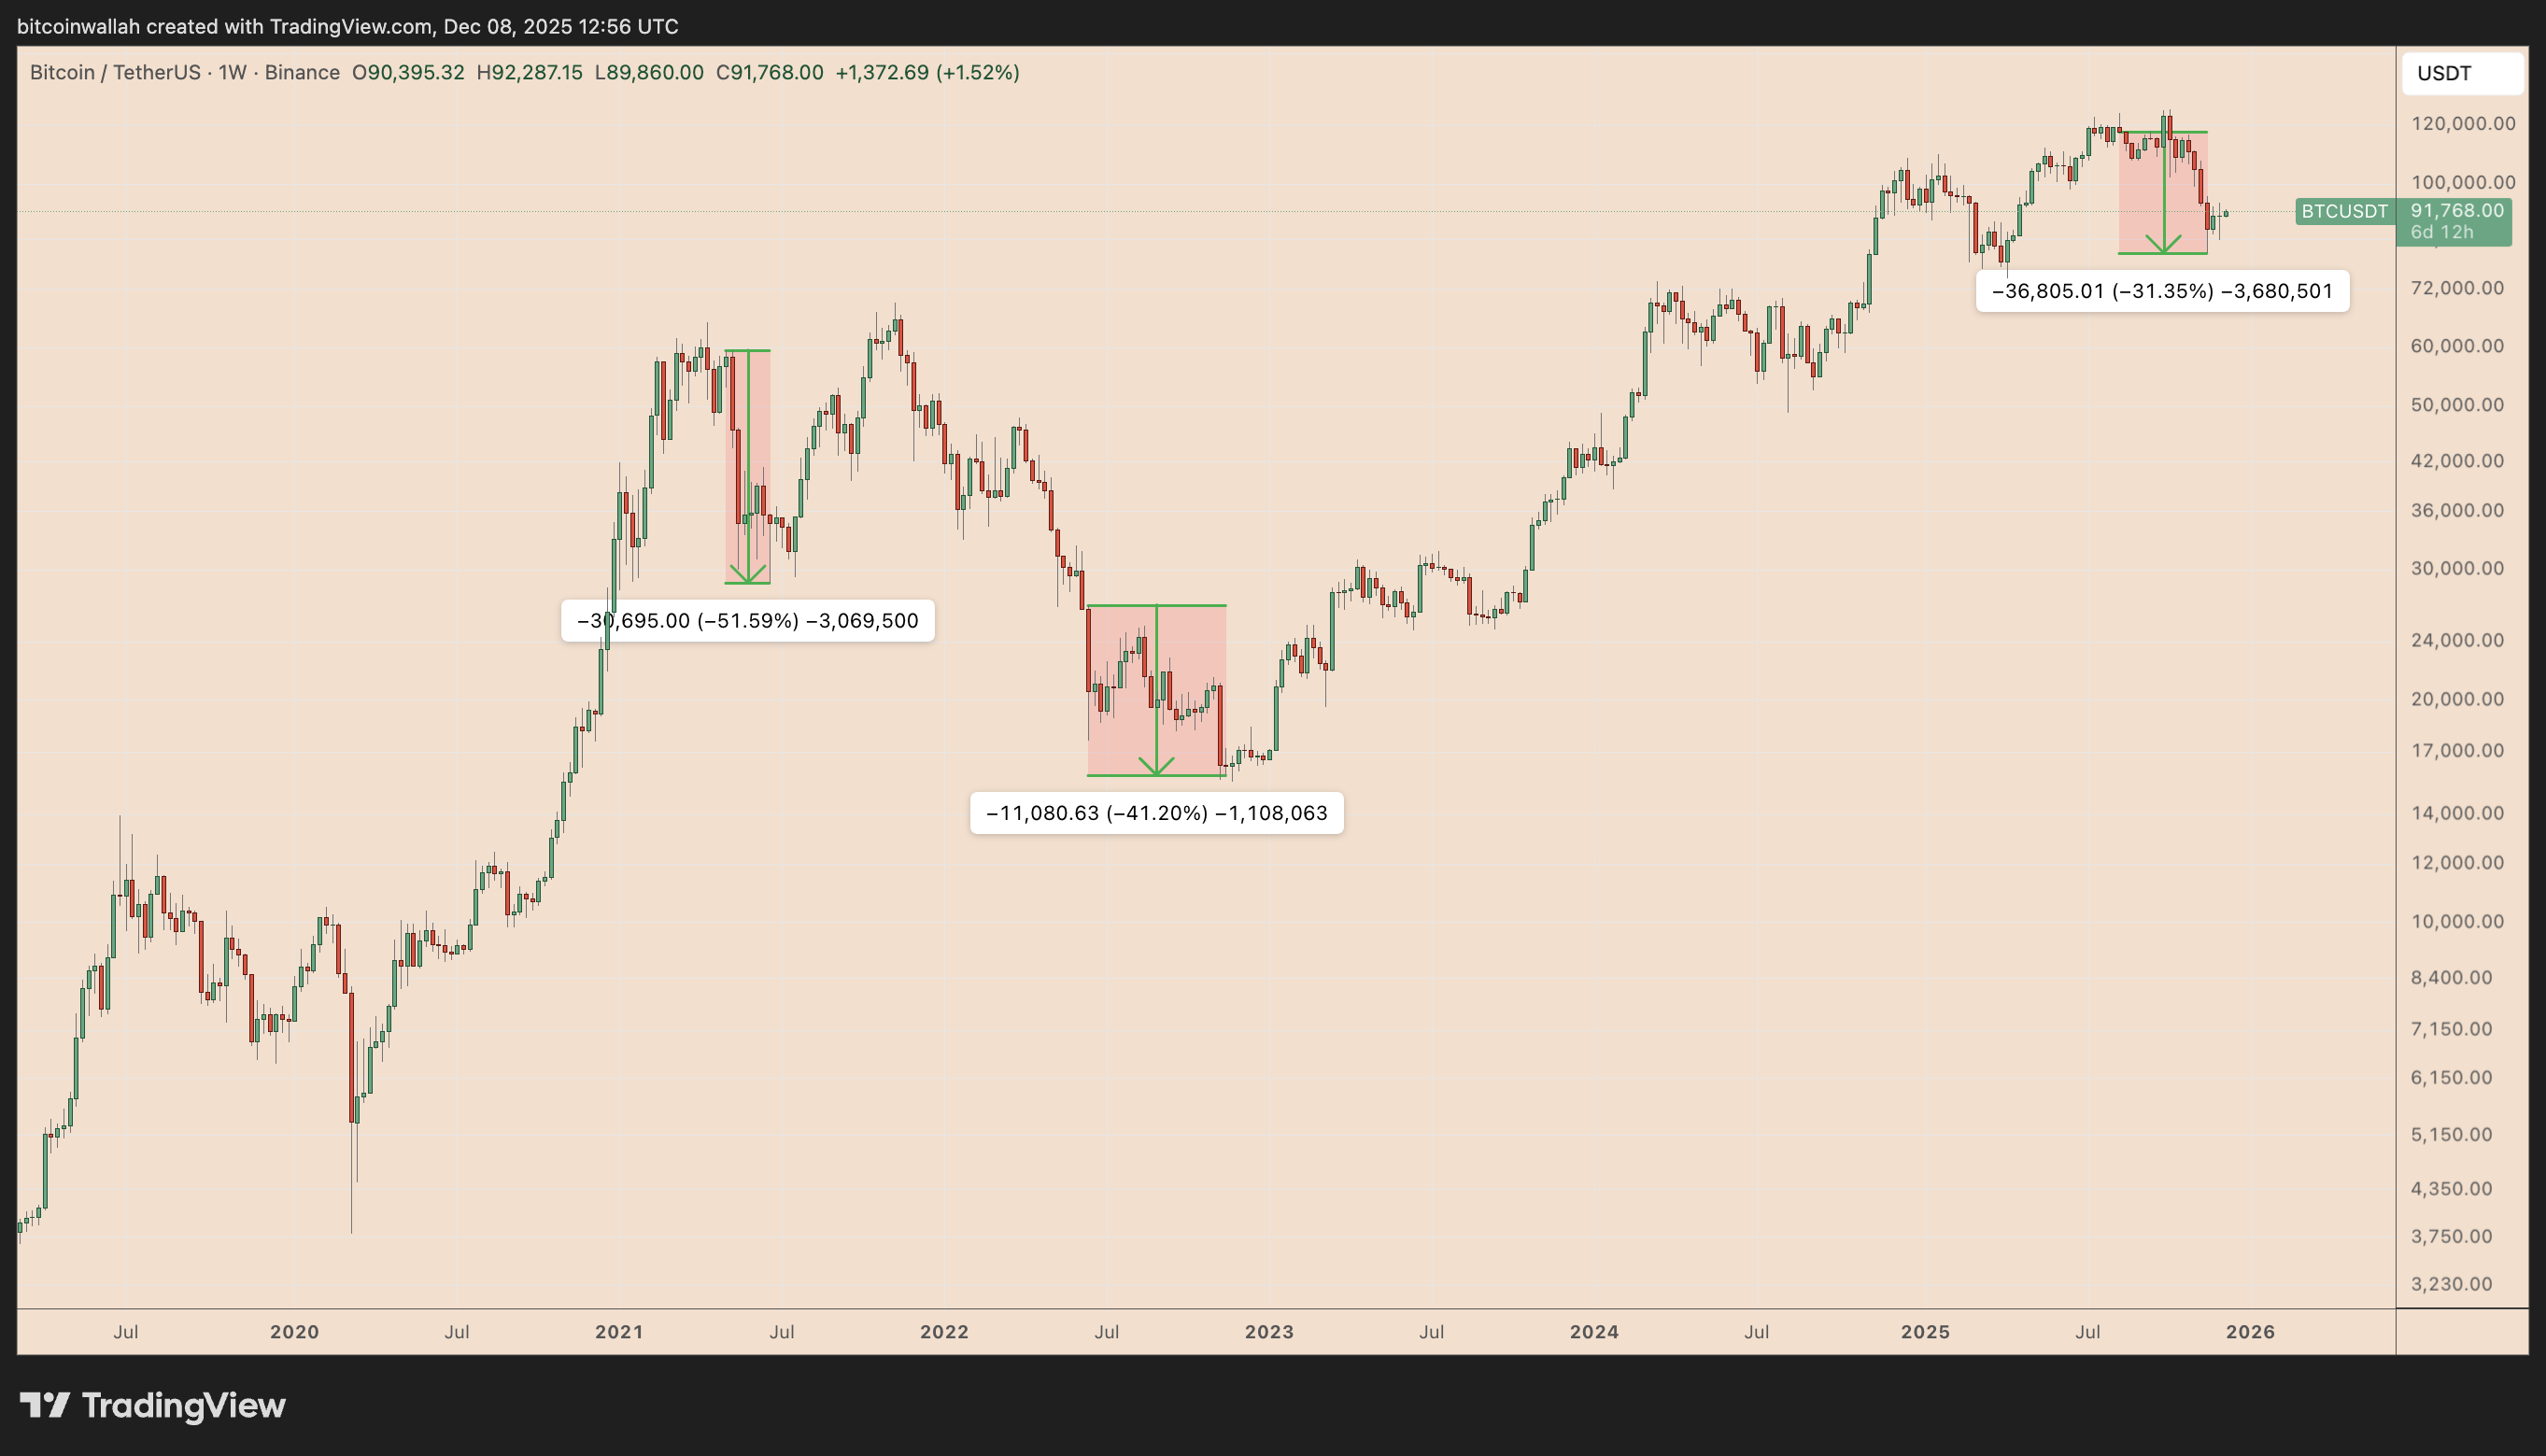
From a historical perspective, these panic emotions usually appear on the eve of large-scale sell-offs in the BTC market.
For example, in May 2021, when the BTC price experienced a retracement of over 50% before oscillating near $60,000, and in June 2022, when the price was around $26,000, BTC subsequently slid to the cycle bottom of about $15,450.
The surge in the "Bitcoin bear market" Google search trend in August also followed the drop in BTC price.
AndrewBTC warned that Bitcoin is likely to rebound to the $97,000 area in the next stage, but this is only to trap bullish investors, adding:
"Everyone will think the bull market is back, but that's not actually the case, the bear market has just begun."
Related recommendation: Analysts say Bitcoin (BTC) bulls must hold key positions to avoid falling to $76,000
This article does not contain investment advice or recommendations. Every investment and trading move involves risk, readers should conduct their own research when making a decision. Although we strive to provide accurate and timely information, Cointelegraph does not guarantee the accuracy, completeness, or reliability of any information in this article. This article may contain forward-looking statements subject to risks and uncertainties. Cointelegraph is not responsible for any losses or damages arising from your reliance on this information.