Bitcoin Long-Term Holder Holdings Hit Eight-Month Low: Bullish Precursor or Bearish Signal?

marsbitPublicado em 2025-12-16Última atualização em 2025-12-16

Resumo

Bitcoin's long-term holder (LTH) supply has reached an eight-month low, dropping to 14.3 million BTC, or 71.92% of the circulating supply—levels last seen in April. This decline suggests some LTHs are selling amid recent market pressure, with 761,000 BTC sold in the past 30 days. Historically, such reductions have occurred during retail-driven bull runs or near cycle tops when LTHs take profits. Technically, Bitcoin has broken below key supports, including the 50-week moving average and a bear flag pattern, with potential further downside toward the $80,000–$84,000 support area. A break below could see a test of the 200-week moving average near $68,500. While increased selling by whales ($2.78 billion in BTC sold recently) and weak technical indicators suggest short-term bearish momentum, the current LTH supply drop may also present an accumulation opportunity. If history repeats, as it did in April–July when LTH buying helped drive a 65% price surge, this could set the stage for a future rally. Market direction hinges on whether Bitcoin holds the $80k–$84k support zone.

The Bitcoin market has recently seen a key development: the amount of Bitcoin in long-term holder wallets has dropped to a cyclical low. This change has drawn widespread market attention—could it be enough to help bullish forces stabilize and prevent further declines toward $70,000?

Long-Term Holder Supply Falls to April Levels

So-called "Long-Term Holders" (LTHs) typically refer to entities holding Bitcoin for at least 155 days. According to the latest data from Glassnode, Bitcoin holdings by these investors have gradually decreased from 14.8 million in mid-July to approximately 14.3 million in December.

Correspondingly, the proportion of Bitcoin held by long-term holders relative to the total circulating supply has also fallen to 71.92%, a level comparable to that of April this year, as shown in the chart below.
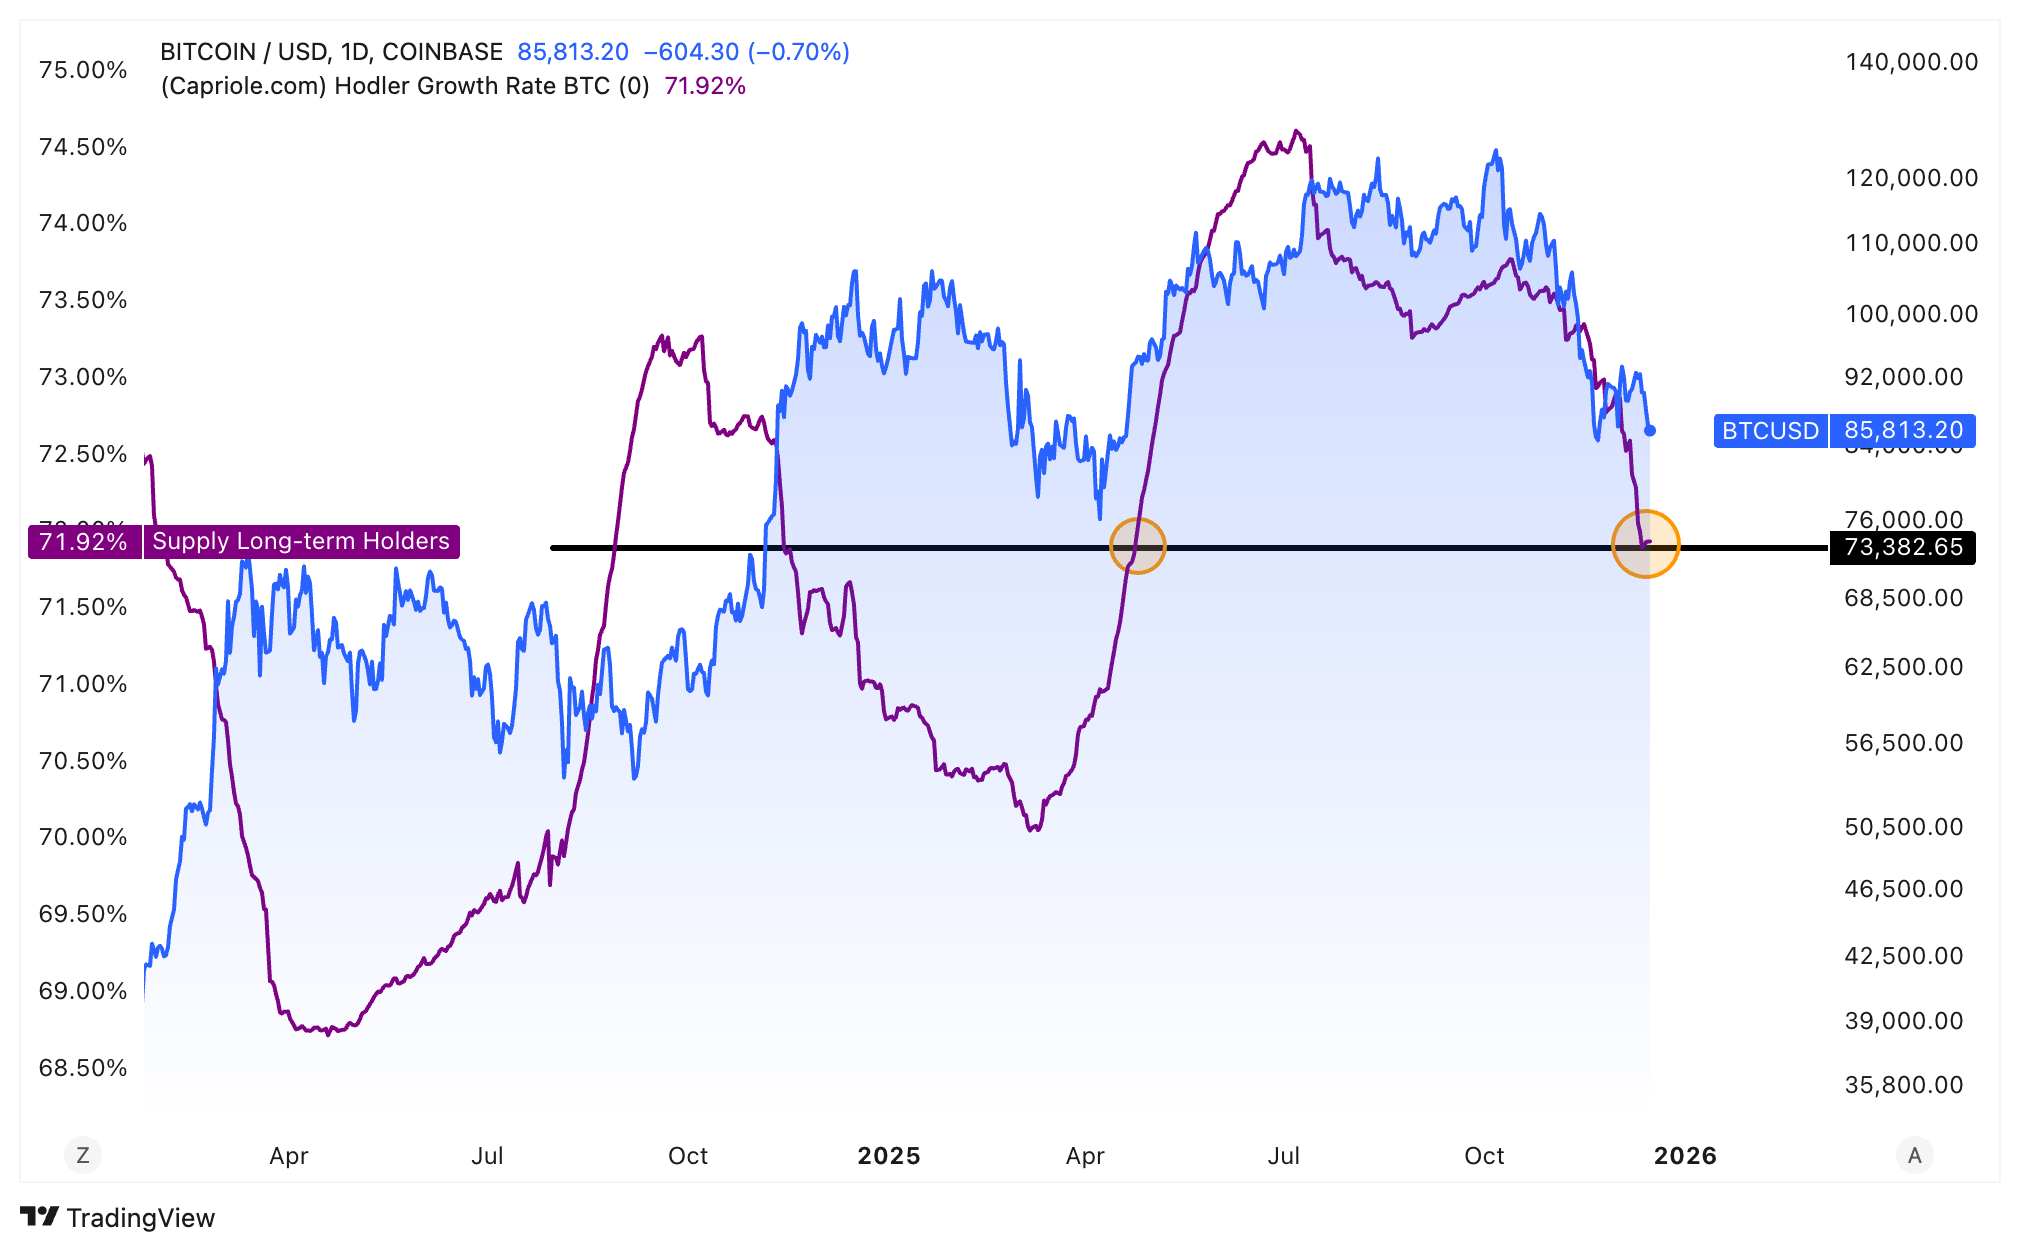
Chart of Bitcoin Long-Term Holder Supply Percentage Change, Source: Capriole Investments


Looking back at the market in April, Bitcoin's price was retreating from its all-time high of $109,000 on January 20, falling to around $74,000 at one point. At that time, long-term holders took the opportunity to buy at lower levels, pushing their holding ratio to around 76% by July. The market then saw a rebound, with Bitcoin's price reaching a new high of approximately $123,000 on July 14, marking a gain of about 65% during that period.


If history repeats itself, current long-term holders are likely to view the recent drop in Bitcoin's price to around $84,000 as another accumulation opportunity, potentially driving the price to challenge all-time highs again in the coming months.


Cyclical Perspective: Patterns in Long-Term Holder Supply Changes


From a broader cyclical perspective, long-term holder supply typically shows significant declines during two phases:


First, during periods of market euphoria dominated by retail investors;


Second, near cycle tops, when long-term holders begin to take profits. This was evident in the bull markets of 2017 and 2021.


Focusing on recent data, CryptoQuant's statistics show that in the 30 days leading up to November 26, long-term holder supply decreased by approximately 1.1 million Bitcoin, the second-largest decline in history. As of December 15, long-term holder holdings have decreased by about 761,000 Bitcoin over the past 30 days. This seems to indicate that, as prices continue to face pressure, some long-term holders are choosing to exit, reflecting increased market concern.
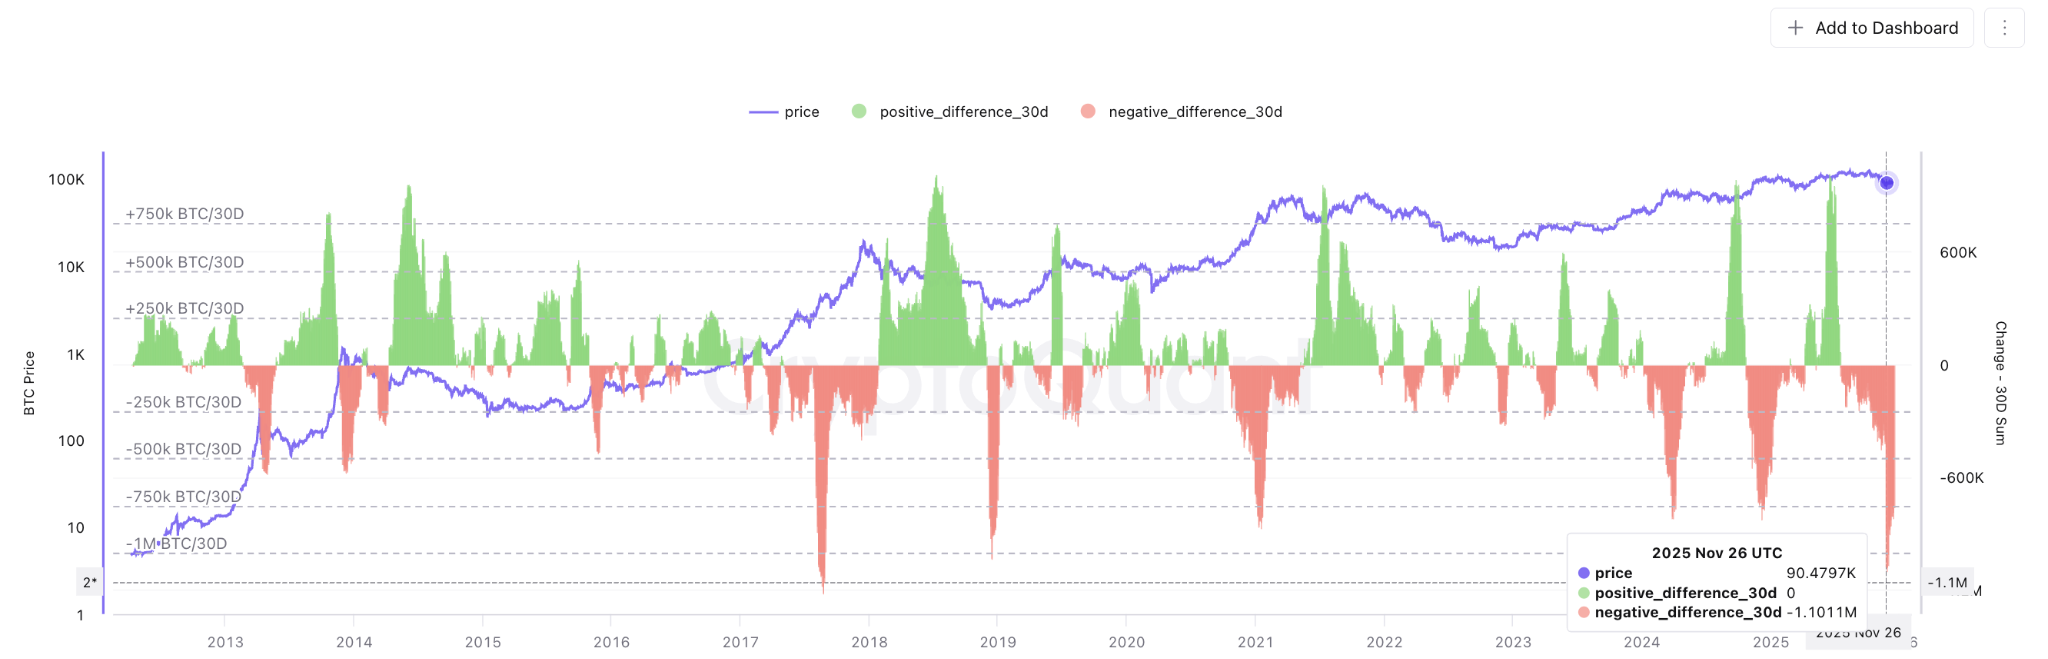
Bitcoin 30-Day Rolling Long-Term Holder Supply Change Chart, Source: CryptoQuant


According to a Marsbit report, over the past month, Bitcoin whale addresses (typically entities holding large amounts of Bitcoin) have collectively sold approximately $2.78 billion worth of Bitcoin, adding sustained downward pressure to the market.


Technical Analysis: Can Bitcoin Hold Key Support Levels?


From a technical structure perspective, Bitcoin's recent performance has weakened, having successively lost support at the 50-week moving average and the year's opening price level of around $93,300.


The chart below shows that the BTC/USD trading pair broke below the lower boundary of the flag consolidation pattern near $92,000 on December 12, confirming a bearish flag pattern. Currently, the first support area of focus lies between the local low of $83,800 on December 1 and the multi-month low of $80,500 on November 21. If this area is breached, Bitcoin could further test the 200-week moving average near $68,500. This potential decline implies a drop of approximately 20% from the current price.
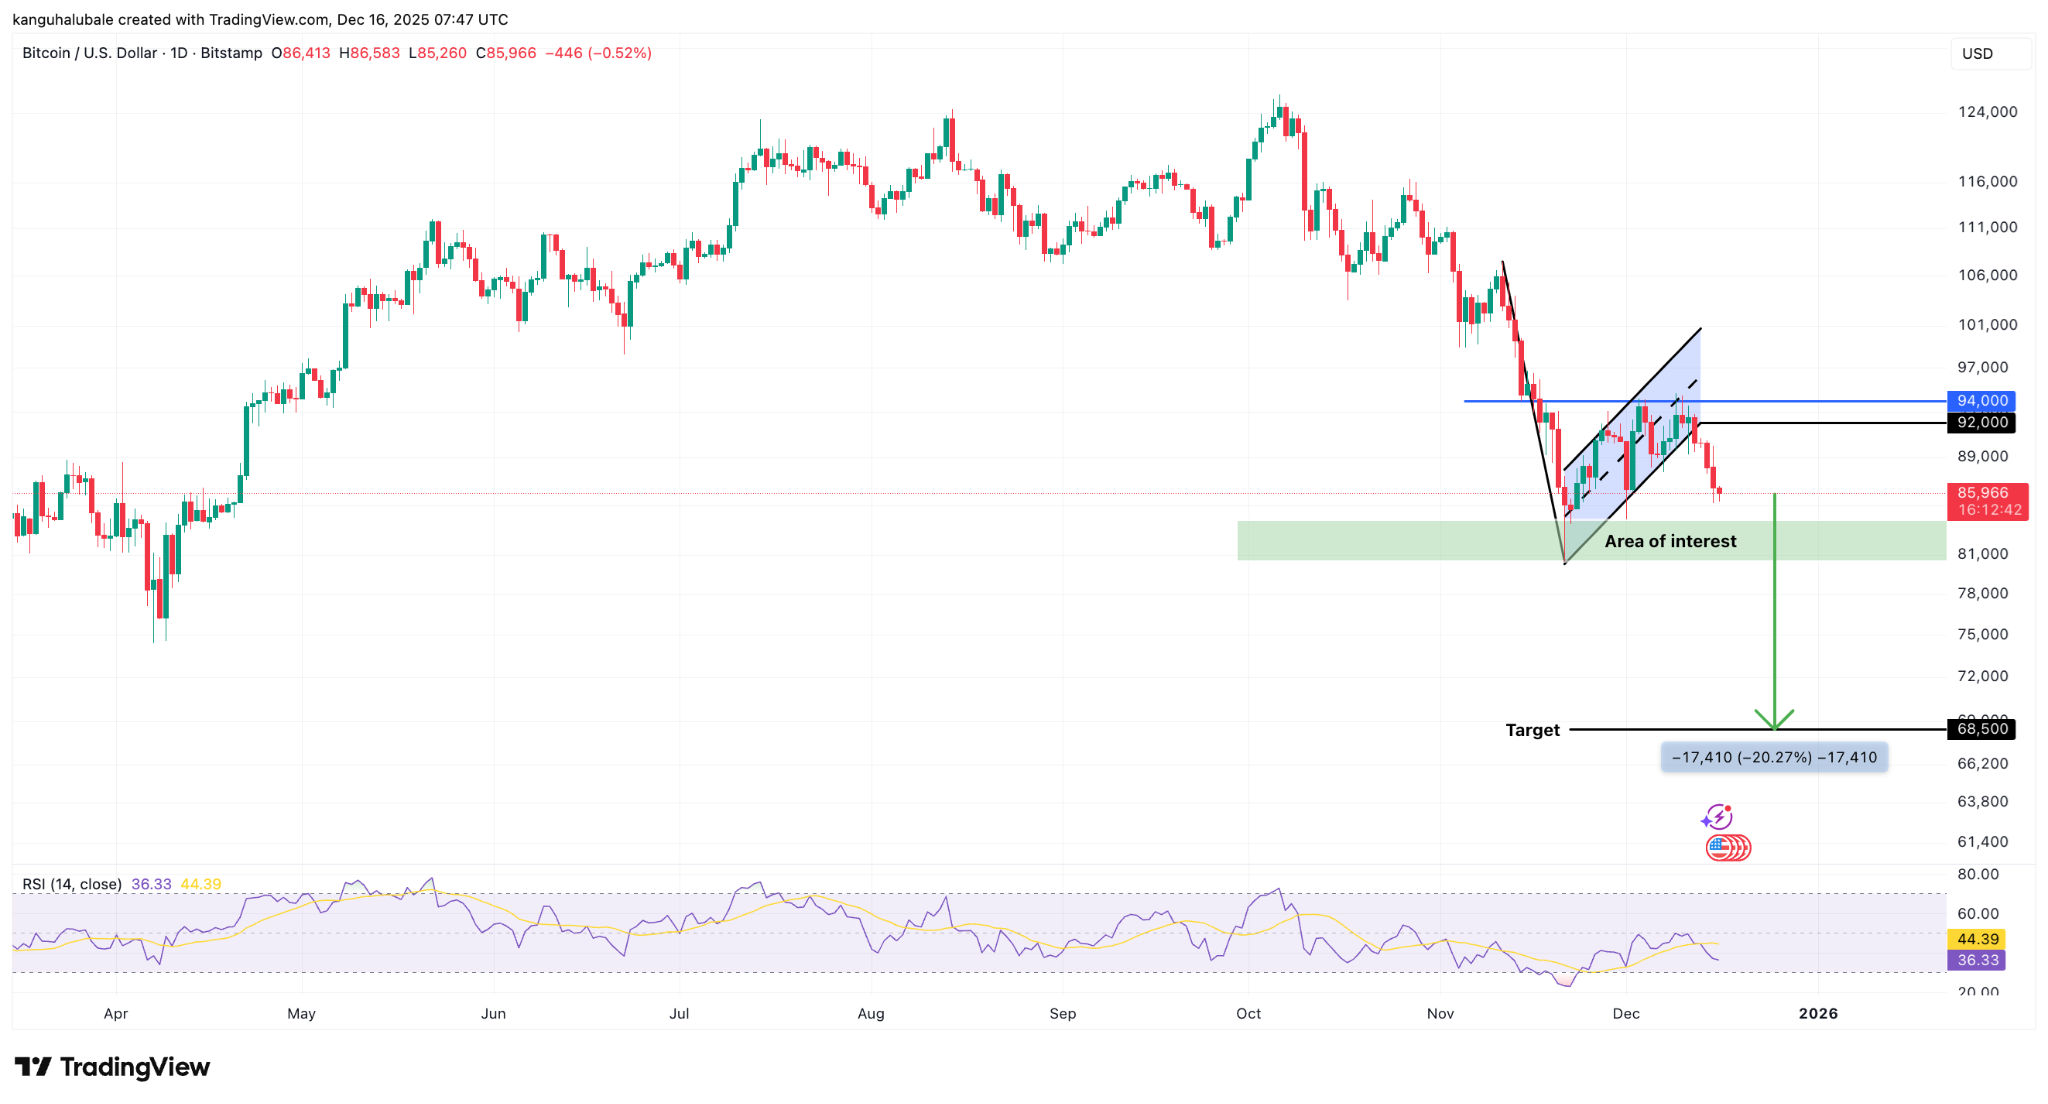
BTC/USD Daily Chart, Source: TradingView


Analyst Nic pointed out via social platform X on Tuesday: "Bitcoin has broken below key levels again, confirming a bearish signal." He added that the next "potential support" is the 100-week exponential moving average, around $85,500.


He further analyzed: "If this level is also broken, subsequent attention should turn to some important on-chain cost levels, such as $83,800 (ETF average cost basis) and $81,200 (realized market average cost), before potentially testing the psychological $80,000 level."


As previously analyzed by Marsbit, Bitcoin's 20-day exponential moving average has begun to turn downward, and the Relative Strength Index (RSI) is also in negative territory, both indicating that bears are dominant in the short term.


Summary and Outlook


The current Bitcoin market is in a delicate phase. The drop in the long-term holder supply ratio to an eight-month low can be interpreted from two angles:

On one hand, this may mean that some steadfast investors are choosing to sell during the price adjustment, perhaps due to concerns about further declines ahead or to take profits, which puts short-term pressure on the market.


On the other hand, historical patterns show that accumulation by long-term holders during price pullbacks often builds momentum for subsequent rallies.


The current decline in holding ratios might also create conditions for them to buy back at lower prices, thus forming new support. However, the market also faces clear short-term challenges: whale selling is adding pressure, technical charts show weakness, and key support levels are being tested one by one. Whether Bitcoin can find effective support in the $80,000 to $84,000 range will be crucial for determining the medium-term trend.



Criptomoedas em alta

Perguntas relacionadas

QWhat does the recent drop in Bitcoin long-term holder supply to an eight-month low indicate?

AThe recent decline in Bitcoin long-term holder (LTH) supply to an eight-month low, falling from 14.8 million BTC in mid-July to around 14.3 million BTC in December, can be interpreted in two ways. It may signal selling by steadfast investors due to concerns about further price declines or profit-taking, which adds short-term pressure. Alternatively, historically, such reductions have often preceded accumulation during price dips, potentially setting the stage for future rally, as seen in April when LTH buying helped drive a 65% price surge.

QHow does the current long-term holder supply percentage compare to April levels, and what was the market context then?

AThe current long-term holder supply percentage has decreased to 71.92%, which is comparable to the level seen in April. In April, Bitcoin's price had retreated from a high of $109,000 to around $74,000, and long-term holders seized the opportunity to accumulate at lower prices, boosting their holdings to about 76% by July. This accumulation phase preceded a significant price rebound, with Bitcoin reaching a new high of approximately $123,000 by mid-July.

QWhat are the key technical support levels for Bitcoin if the price continues to decline?

AKey technical support levels for Bitcoin include the region between the local low of $83,800 on December 1 and the multi-month low of $80,500 from November 21. If this area fails, the next major support is the 200-week moving average around $68,500. Additionally, the 100-week exponential moving average at approximately $85,500 and on-chain cost bases like the ETF average cost benchmark at $83,800 and the realized market average cost at $81,200 are critical levels to watch.

QWhat recent activity by Bitcoin whales has impacted the market, according to the article?

AAccording to the article, Bitcoin whale addresses have sold approximately $2.78 billion worth of Bitcoin over the past month. This substantial selling activity has contributed to ongoing downward pressure on the market, exacerbating the price decline and testing key support levels.

QHow do historical cycles show long-term holder supply changes typically behaving during market peaks?

AHistorically, long-term holder supply tends to decrease significantly during two phases: retail investor-driven market euphoria and near cycle tops when long-term holders begin profit-taking. This pattern was evident in the 2017 and 2021 bull markets, where LTHs reduced their holdings as prices peaked, indicating distribution to new buyers and often signaling a market top or correction.

Leituras Relacionadas

STAR 50 Soars 10.73%, Why Did A-Shares Stage a "V-Shaped Reversal"?

After a prolonged decline, the Chinese A-share market staged a strong rally on July 21. The STAR 50 index surged 10.73%, its largest single-day gain in nearly a year, leading a broad-based "V-shaped" reversal. The Shanghai Composite Index rose 1.79%, the Shenzhen Component Index gained 4.81%, and the ChiNext Index jumped 7.05%. Total market turnover reached 2.97 trillion yuan, an increase of 256.1 billion yuan from the previous session, with over 3,100 stocks advancing. The semiconductor sector spearheaded the rebound, with related ETFs posting significant gains. Analysts attribute the surge to three converging factors. First, coordinated capital inflows from "national team" institutions, insurance funds, listed company buybacks, and fund house self-purchases have bolstered market liquidity and confidence. Second, supportive policy signals, including commitments from regulators to ensure stable market operations, provided a favorable backdrop. Third, a stabilization and recovery in overseas markets, notably South Korea, created a positive external environment. Institutions suggest the most severe panic selling phase for the tech sector has likely passed, following a significant digestion of crowded positions and leveraged funds. While short-term volatility may persist, the medium to long-term outlook remains underpinned by enduring trends like AI computing demand expansion and semiconductor localization. The market's focus now shifts to the sustainability of supportive fund flows, earnings reports, and upcoming catalysts from the global AI industry chain.

marsbitHá 17m

STAR 50 Soars 10.73%, Why Did A-Shares Stage a "V-Shaped Reversal"?

marsbitHá 17m

U.S. Tech Momentum Stocks Post Largest Single-Day Gain Ever, But Is the Plunge Over?

US tech momentum stocks staged a sharp rebound on Tuesday (July 21st). Morgan Stanley's TMT Momentum Factor surged over 12%, marking its largest single-day gain on record, exceeding even peaks from the 2000 dot-com bubble. Key momentum indices from Goldman Sachs also posted their strongest daily performances in years. The rally was led by semiconductors, with the Philadelphia Semiconductor Index jumping 4.6%. This rebound followed three consecutive down days and a cumulative 33% plunge in momentum stocks, one of the steepest drawdowns since the dot-com era. Analysts attribute the surge largely to a short squeeze. Heavy selling had pushed high-beta momentum stocks into deeply oversold territory, forcing many short sellers, particularly in Asia, to cover their positions, creating a self-reinforcing buying spiral. However, the rebound's internals appear weak. Trading volume was notably low, and advancing stocks still lagged decliners on the S&P 500, indicating a narrow, concentrated rally rather than broad market participation. Diverging views emerge on the outlook. BTIG warns the bounce has hit key resistance and recommends selling into strength, citing extreme volatility and historical parallels to past market tops. Conversely, Goldman Sachs and UBS believe the momentum unwind is nearing its end, suggesting it may be time to gradually add exposure, as positioning has been significantly reduced. They caution, however, that high volatility warrants a measured approach, potentially using defined-risk strategies. The upcoming earnings season, particularly reports from major tech firms like Alphabet, is seen as a critical test for the rally's sustainability. Simultaneously, bond markets flashed a warning, with yields rising partly due to spiking oil prices. Analysts note that if long-term Treasury yields break decisively higher, it could pose a significant headwind for equities, especially growth stocks.

marsbitHá 24m

U.S. Tech Momentum Stocks Post Largest Single-Day Gain Ever, But Is the Plunge Over?

marsbitHá 24m

U.S. Tech Momentum Stocks Record Largest Single-Day Gain Ever, but Has the Rout Ended?

U.S. tech momentum stocks staged a dramatic rebound on Tuesday, July 21st. Key momentum indices like the Morgan Stanley TMT Momentum Factor and Goldman Sachs' High Beta Momentum Long Index posted historic or near-historic single-day gains, fueled largely by semiconductor stocks. This sharp rally followed a severe three-day sell-off that saw momentum stocks plunge 33%, marking one of the steepest pullbacks since the dot-com bubble. Analysts attribute the bounce primarily to a short squeeze, as forced covering from over-leveraged traders, particularly in Asia, created a buying spiral. However, the rally's health is questioned due to weak market breadth—overall trading volume was low, and decliners outnumbered advancers in the S&P 500 despite the index's gain—suggesting a narrow, concentrated surge rather than broad recovery. Opinions on the sustainability diverge. BTIG strategists warn the rebound has hit key resistance levels, citing extreme volatility and historic stock dispersion as signs of an ongoing broader correction, and recommend selling into strength. Conversely, Goldman Sachs and UBS view the aggressive momentum unwinding as nearing its end, noting reduced positioning and a lack of new fundamental catalysts. They suggest the sell-off presents a selective opportunity to add exposure, albeit cautiously and gradually using defined-risk strategies. The immediate trajectory hinges on the ongoing earnings season, with market focus on Alphabet's capital expenditure guidance for AI investment clarity. Meanwhile, bond markets present a risk, with rising Treasury yields—potentially heading toward 5.5%—and widening credit spreads for mega-cap tech companies posing a threat to equity valuations. The combination of technical factors, earnings results, and macro conditions leaves the durability of the rebound in doubt.

链捕手Há 27m

U.S. Tech Momentum Stocks Record Largest Single-Day Gain Ever, but Has the Rout Ended?

链捕手Há 27m

Long-Divided Must Unite, Long-United Must Divide: When L1 Becomes Its Own Rollup, What Is Ethereum's Endgame?

"The Inevitable Cycle: When L1 Becomes Its Own Rollup – What is Ethereum's Endgame?" For years, the Ethereum community grappled with concerns that L2s were fragmenting the ecosystem and eroding L1's value. While L2s provided cheaper execution, they also splintered liquidity and the unified user experience of a single chain. This has prompted a fundamental reassessment of the relationship between L1 and L2. Ethereum's roadmap is evolving. The "Scale" initiative merges L1 and L2 expansion into a holistic framework. L1 itself is advancing with higher gas limits, statelessness, and zkEVM verification, no longer content to be just a low-throughput settlement layer. Consequently, the primary value proposition of L2s is shifting from merely providing cheap blockspace to offering L1 cannot easily provide: application-specific optimizations, privacy features, and flexible governance models. L2s are becoming a spectrum of execution environments with varying degrees of security inheritance from Ethereum. A critical challenge in this multi-chain future is interoperability. The vision is to make Ethereum "feel like one chain again." This relies on advancements in native account abstraction (like EIP-7702) and intent-based architectures (Open Intents Framework), where users declare desired outcomes, and solvers handle the complex cross-chain execution. Furthermore, shortening Ethereum's finality time from minutes to seconds is crucial, as it underpins trust between chains for bridges, stablecoins, and cross-chain applications. Perhaps the most provocative idea is that Ethereum L1 itself could become a form of "its own Rollup." As zkEVM and proof systems mature, high-performance nodes could execute transactions and generate validity proofs. Regular validators would then verify these proofs instead of re-executing all transactions. This blurs the traditional L1/L2 hierarchy, making "Rollup" more of a general execution-verification architecture. Native Rollup aims to integrate L2 validation more directly into the Ethereum protocol, allowing L2s to inherit L1's security more fully and move away from reliance on security councils. In the end, L2s are not destined to replace L1 or be made obsolete by it. The likely future is a unified system where diverse execution environments—each optimized for specific use cases like DeFi, gaming, or privacy—coexist. They will share a common foundation of security, liquidity, and verifiable state, seamlessly connected to restore a cohesive user experience. The next phase for Ethereum is not just about scaling through separation, but about intelligently reintegrating what was separated back into a coherent whole.

链捕手Há 43m

Long-Divided Must Unite, Long-United Must Divide: When L1 Becomes Its Own Rollup, What Is Ethereum's Endgame?

链捕手Há 43m

Trading

Spot

Artigos em Destaque

O que é BITCOIN

Compreender o HarryPotterObamaSonic10Inu (ERC-20) e a Sua Posição no Espaço Cripto Nos últimos anos, o mercado de criptomoedas assistiu a um aumento na popularidade das moedas meme, cativando não apenas os traders, mas também aqueles que procuram envolvimento comunitário e valor de entretenimento. Entre estes tokens únicos está o HarryPotterObamaSonic10Inu (ERC-20), um projeto intrigante que mistura referências culturais no tecido das criptomoedas. Este artigo explora os principais aspetos do HarryPotterObamaSonic10Inu, examinando os seus mecanismos, a sua ética orientada pela comunidade e o seu envolvimento com o vasto panorama cripto. O que é o HarryPotterObamaSonic10Inu (ERC-20)? Como o nome sugere, o HarryPotterObamaSonic10Inu é uma moeda meme construída na blockchain Ethereum, classificada sob o padrão ERC-20. Ao contrário das criptomoedas tradicionais, que podem enfatizar a utilidade prática ou o potencial de investimento, este token prospera no valor de entretenimento e na força da sua comunidade. O projeto visa promover um ambiente onde utilizadores envolvidos possam reunir-se, partilhar ideias e participar em atividades inspiradas por diversos fenómenos culturais. Uma característica notável do HarryPotterObamaSonic10Inu é a zero taxa sobre transações. Este elemento atraente visa encorajar a negociação e o envolvimento da comunidade, isento de encargos adicionais que podem desencorajar os traders de pequena escala. A oferta total da moeda está fixada em mil milhões de tokens, uma cifra que marca a sua intenção de manter uma circulação substancial dentro da comunidade. Criador do HarryPotterObamaSonic10Inu (ERC-20) As origens do HarryPotterObamaSonic10Inu estão um pouco envoltas em mistério; os detalhes sobre o criador permanecem desconhecidos. O desenvolvimento deste token carece de uma equipa identificável ou de um plano explícito, o que não é raro no setor das moedas meme. Em vez disso, o projeto surgiu de forma orgânica, com o seu progresso a depender fortemente do entusiasmo e da participação da sua comunidade. Investidores do HarryPotterObamaSonic10Inu (ERC-20) No que diz respeito a investimentos externos e apoios, o HarryPotterObamaSonic10Inu também permanece ambíguo. O token não lista quaisquer fundações de investimento conhecidas ou apoio organizacional significativo. Em vez disso, o “sangue vital” do projeto é a sua comunidade de base, que informa o seu crescimento e sustentabilidade através da ação coletiva e do envolvimento no espaço cripto. Como Funciona o HarryPotterObamaSonic10Inu (ERC-20)? Como uma moeda meme, o HarryPotterObamaSonic10Inu opera principalmente fora dos quadros tradicionais que muitas vezes governam o valor dos ativos. Existem vários aspetos distintivos que definem como o projeto funciona: Transações Sem Taxas: Sem taxas sobre transações, os utilizadores podem comprar e vender o token livremente, sem a preocupação de custos ocultos. Envolvimento da Comunidade: O projeto prospera na interação da comunidade, aproveitando plataformas de redes sociais para criar entusiasmo e facilitar a participação. Discussões, partilha de conteúdo e envolvimento são elementos cruciais que ajudam a expandir o seu alcance e a fomentar a lealdade entre os apoiantes. Sem Utilidade Prática: Deve ser notado que o HarryPotterObamaSonic10Inu não oferece utilidade concreta dentro do ecossistema financeiro. Em vez disso, é classificado como um token principalmente para entretenimento e atividades comunitárias. Referência Cultural: O token incorpora de forma inteligente elementos da cultura popular para atrair interesse, conectando-se tanto com entusiastas de memes como com seguidores de criptomoedas. HarryPotterObamaSonic10Inu exemplifica como as moedas meme operam de forma diferente de projetos de criptomoedas mais tradicionais, entrando no mercado como construções sociais inovadoras em vez de ativos utilitários. Linha do Tempo do HarryPotterObamaSonic10Inu (ERC-20) A história do HarryPotterObamaSonic10Inu é marcada por vários marcos notáveis: Criação: O token surgiu de um meme viral, capturando a imaginação de muitos entusiastas de criptomoedas. Datas específicas de criação não estão disponíveis, sublinhando a sua ascensão orgânica. Listagem em Exchanges: O HarryPotterObamaSonic10Inu conseguiu entrar em várias exchanges, permitindo um acesso e negociação mais fáceis pela comunidade. Iniciativas de Envolvimento da Comunidade: Atividades contínuas direcionadas a melhorar a interação comunitária, incluindo concursos, campanhas em redes sociais e geração de conteúdo por fãs e defensores. Planos de Expansão Futura: O roteiro do projeto inclui o lançamento de uma coleção de NFTs, mercadorias e um site de eCommerce relacionado aos seus temas culturais, envolvendo ainda mais a comunidade e tentando adicionar mais dimensões ao seu ecossistema. Pontos-Chave sobre o HarryPotterObamaSonic10Inu (ERC-20) Natureza Orientada pela Comunidade: O projeto prioriza a contribuição coletiva e a criatividade, assegurando que o envolvimento dos utilizadores está na vanguarda do seu desenvolvimento. Classificação como Moeda Meme: Representa o epítome da criptomoeda baseada em entretenimento, destacando-se dos veículos de investimento tradicionais. Sem Afiliação Direta com o Bitcoin: Apesar da semelhança no nome do ticker, o HarryPotterObamaSonic10Inu é distinto e não tem qualquer relação com o Bitcoin ou outras criptomoedas estabelecidas. Foco na Colaboração: O HarryPotterObamaSonic10Inu é projetado para criar um espaço de colaboração e partilha de histórias entre os seus detentores, proporcionando uma via para a criatividade e o fortalecimento da comunidade. Perspectivas Futuras: A ambição de expandir além da sua premissa inicial para NFTs e mercadorias delineia um caminho para o projeto potencialmente entrar em avenidas mais mainstream dentro da cultura digital. À medida que as moedas meme continuam a capturar a imaginação da comunidade cripto, HarryPotterObamaSonic10Inu (ERC-20) destaca-se devido aos seus laços culturais e abordagem centrada na comunidade. Embora possa não se encaixar no molde típico de um token orientado para utilidade, a sua essência reside na alegria e camaradagem fomentadas entre os seus apoiantes, destacando a natureza em evolução das criptomoedas em uma era cada vez mais digital. À medida que o projeto continua a desenvolver-se, será importante observar como as dinâmicas comunitárias influenciam a sua trajetória no panorama em constante mudança da tecnologia blockchain.

1.7k Visualizações TotaisPublicado em {updateTime}Atualizado em 2024.12.03

O que é BITCOIN

Como comprar BTC

Bem-vindo à HTX.com!Tornámos a compra de Bitcoin (BTC) simples e conveniente.Segue o nosso guia passo a passo para iniciar a tua jornada no mundo das criptos.Passo 1: cria a tua conta HTXUtiliza o teu e-mail ou número de telefone para te inscreveres numa conta gratuita na HTX.Desfruta de um processo de inscrição sem complicações e desbloqueia todas as funcionalidades.Obter a minha contaPasso 2: vai para Comprar Cripto e escolhe o teu método de pagamentoCartão de crédito/débito: usa o teu visa ou mastercard para comprar Bitcoin (BTC) instantaneamente.Saldo: usa os fundos da tua conta HTX para transacionar sem problemas.Terceiros: adicionamos métodos de pagamento populares, como Google Pay e Apple Pay, para aumentar a conveniência.P2P: transaciona diretamente com outros utilizadores na HTX.Mercado de balcão (OTC): oferecemos serviços personalizados e taxas de câmbio competitivas para os traders.Passo 3: armazena teu Bitcoin (BTC)Depois de comprar o teu Bitcoin (BTC), armazena-o na tua conta HTX.Alternativamente, podes enviá-lo para outro lugar através de transferência blockchain ou usá-lo para transacionar outras criptomoedas.Passo 4: transaciona Bitcoin (BTC)Transaciona facilmente Bitcoin (BTC) no mercado à vista da HTX.Acede simplesmente à tua conta, seleciona o teu par de trading, executa as tuas transações e monitoriza em tempo real.Oferecemos uma experiência de fácil utilização tanto para principiantes como para traders experientes.

4.3k Visualizações TotaisPublicado em {updateTime}Atualizado em 2026.06.02

Como comprar BTC

O que é $BITCOIN

OURO DIGITAL ($BITCOIN): Uma Análise Abrangente Introdução ao OURO DIGITAL ($BITCOIN) OURO DIGITAL ($BITCOIN) é um projeto baseado em blockchain que opera na rede Solana, com o objetivo de combinar as características dos metais preciosos tradicionais com a inovação das tecnologias descentralizadas. Embora partilhe um nome com o Bitcoin, frequentemente referido como “ouro digital” devido à sua percepção como uma reserva de valor, o OURO DIGITAL é um token separado projetado para criar um ecossistema único dentro da paisagem Web3. O seu objetivo é posicionar-se como um ativo digital alternativo viável, embora os detalhes sobre as suas aplicações e funcionalidades ainda estejam em desenvolvimento. O que é o OURO DIGITAL ($BITCOIN)? OURO DIGITAL ($BITCOIN) é um token de criptomoeda explicitamente projetado para uso na blockchain Solana. Em contraste com o Bitcoin, que fornece um papel amplamente reconhecido como armazenamento de valor, este token parece focar em aplicações e características mais amplas. Aspectos notáveis incluem: Infraestrutura Blockchain: O token é construído na blockchain Solana, conhecida pela sua capacidade de lidar com transações de alta velocidade e baixo custo. Dinâmicas de Oferta: O OURO DIGITAL tem um fornecimento máximo limitado a 100 quatrilhões de tokens (100P $BITCOIN), embora os detalhes sobre o seu fornecimento circulante ainda não tenham sido divulgados. Utilidade: Embora as funcionalidades precisas não estejam explicitamente delineadas, existem indicações de que o token poderia ser utilizado para várias aplicações, potencialmente envolvendo aplicações descentralizadas (dApps) ou estratégias de tokenização de ativos. Quem é o Criador do OURO DIGITAL ($BITCOIN)? Neste momento, a identidade dos criadores e da equipa de desenvolvimento por trás do OURO DIGITAL ($BITCOIN) permanece desconhecida. Esta situação é típica entre muitos projetos inovadores no espaço da blockchain, particularmente aqueles alinhados com finanças descentralizadas e fenómenos de moedas meme. Embora tal anonimato possa fomentar uma cultura orientada pela comunidade, intensifica as preocupações sobre governança e responsabilidade. Quem são os Investidores do OURO DIGITAL ($BITCOIN)? As informações disponíveis indicam que o OURO DIGITAL ($BITCOIN) não tem apoiantes institucionais conhecidos ou investimentos proeminentes de capital de risco. O projeto parece operar num modelo peer-to-peer focado no apoio e adoção da comunidade, em vez de rotas de financiamento tradicionais. A sua atividade e liquidez estão principalmente situadas em exchanges descentralizadas (DEXs), como a PumpSwap, em vez de plataformas de negociação centralizadas estabelecidas, destacando ainda mais a sua abordagem de base. Como Funciona o OURO DIGITAL ($BITCOIN) A mecânica operacional do OURO DIGITAL ($BITCOIN) pode ser elaborada com base no seu design de blockchain e nas características da rede: Mecanismo de Consenso: Ao aproveitar o exclusivo proof-of-history (PoH) da Solana combinado com um modelo de proof-of-stake (PoS), o projeto assegura uma validação eficiente das transações, contribuindo para o alto desempenho da rede. Tokenomics: Embora mecanismos deflacionários específicos não tenham sido extensivamente detalhados, o vasto fornecimento máximo de tokens implica que pode atender a microtransações ou casos de uso de nicho que ainda estão por definir. Interoperabilidade: Existe o potencial para integração com o ecossistema mais amplo da Solana, incluindo várias plataformas de finanças descentralizadas (DeFi). No entanto, os detalhes sobre integrações específicas permanecem não especificados. Cronologia de Eventos Chave Aqui está uma cronologia que destaca marcos significativos relacionados ao OURO DIGITAL ($BITCOIN): 2023: O lançamento inicial do token ocorre na blockchain Solana, marcado pelo seu endereço de contrato. 2024: O OURO DIGITAL ganha visibilidade ao tornar-se disponível para negociação em exchanges descentralizadas como a PumpSwap, permitindo que os utilizadores o negociem contra SOL. 2025: O projeto testemunha atividade de negociação esporádica e potencial interesse em envolvimentos liderados pela comunidade, embora não tenham sido documentadas parcerias ou avanços técnicos notáveis até ao momento. Análise Crítica Forças Escalabilidade: A infraestrutura subjacente da Solana suporta altos volumes de transações, o que pode aumentar a utilidade do $BITCOIN em vários cenários de transação. Acessibilidade: O potencial preço de negociação baixo por token pode atrair investidores de retalho, facilitando uma participação mais ampla devido a oportunidades de propriedade fracionada. Riscos Falta de Transparência: A ausência de apoiantes, desenvolvedores ou um processo de auditoria publicamente conhecidos pode gerar ceticismo em relação à sustentabilidade e confiabilidade do projeto. Volatilidade do Mercado: A atividade de negociação depende fortemente do comportamento especulativo, o que pode resultar em volatilidade significativa dos preços e incerteza para os investidores. Conclusão O OURO DIGITAL ($BITCOIN) surge como um projeto intrigante, mas ambíguo, dentro do ecossistema em rápida evolução da Solana. Embora tente aproveitar a narrativa do “ouro digital”, a sua divergência do papel estabelecido do Bitcoin como reserva de valor sublinha a necessidade de uma diferenciação mais clara da sua utilidade pretendida e estrutura de governança. A aceitação e adoção futuras dependerão provavelmente da abordagem da atual opacidade e da definição mais explícita das suas estratégias operacionais e económicas. Nota: Este relatório abrange informações sintetizadas disponíveis até outubro de 2023, e desenvolvimentos podem ter ocorrido além do período de pesquisa.

142 Visualizações TotaisPublicado em {updateTime}Atualizado em 2025.05.13

O que é $BITCOIN

Discussões

Bem-vindo à Comunidade HTX. Aqui, pode manter-se informado sobre os mais recentes desenvolvimentos da plataforma e obter acesso a análises profissionais de mercado. As opiniões dos utilizadores sobre o preço de BTC (BTC) são apresentadas abaixo.

活动图片