Author: CryptoSlate
Compiled by: Deep Tide TechFlow
Deep Tide Guide: This article explains an important market mechanism: Before macroeconomic data was announced, the Bitcoin derivatives market had already clearly signaled risks through three dimensions—funding rates, open interest, and liquidations. Understanding this logic allows one to see the real market pressures earlier than chasing any narrative.
Full Text Below:
The Bitcoin derivatives market provides the best explanation for this week's macro pressures.
Funding rates turned sharply negative, open interest remained high, and then the U.S. jobs report landed. These three events together indicate that the market had heavily positioned for downside hedging before the actual macro catalyst arrived.
This sequence is worth understanding because it explains how macro volatility enters the crypto market.
It usually appears first in perpetual contracts—where hedging is fastest and leverage usage is highest.
Funding rates tell you which side is paying to maintain positions, open interest tells you how many positions remain in the system, and liquidation data tells you when these positions start to break.
On February 28, Bitcoin perpetual funding rates fell to approximately -6%, one of the most negative readings in nearly three months. BTC-denominated open interest rose from about 113,380 BTC at the beginning of the year to 120,260 BTC.
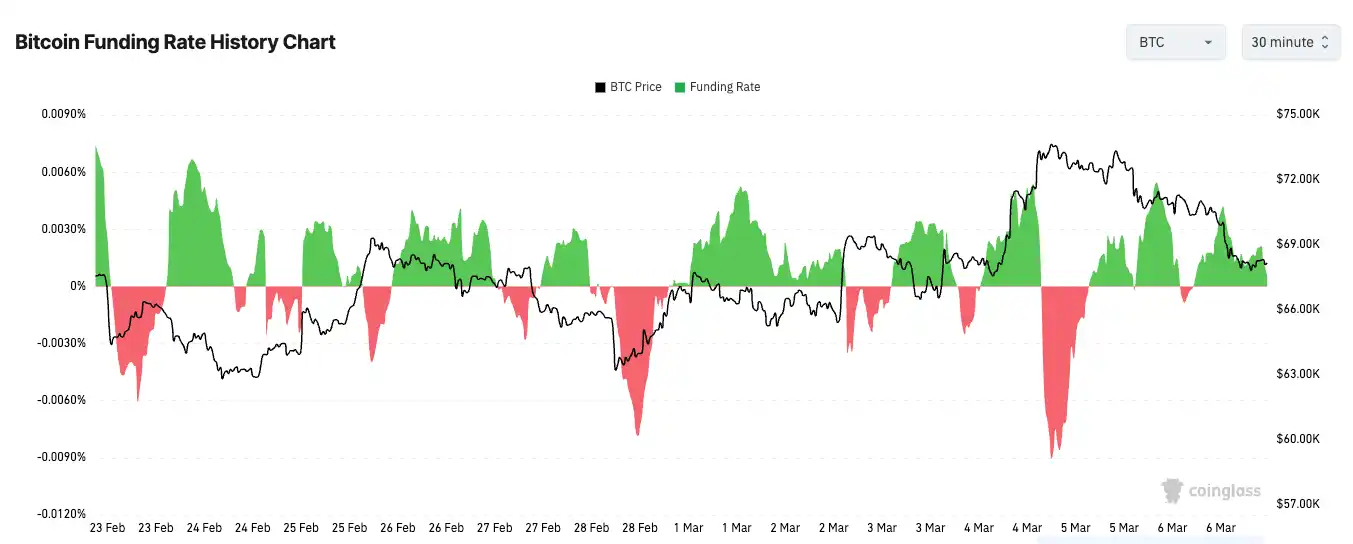
This combination is important because it points to two things simultaneously: Traders are aggressively betting on the downside, and they are doing so with more leverage entering the market. The market is both very tense and very crowded.
This is the simplest way to understand how macro pressure enters the crypto market.
It appears in the derivatives ledger, not as a neatly packaged X narrative or a tidy economist report. Traders act there first because perpetual contracts are liquid, low-cost, and always available.
When they worry about growth, interest rates, or broader risk-off sentiment, they short perpetual contracts; these contracts fall below spot, and funding rates turn negative because shorts must pay longs to maintain their positions.
Why Negative Funding Rates Persist
But negative funding rates alone are not a bottom signal; they only tell you which way the market is leaning.
This distinction is important because traders like to turn every extreme reading into a prediction.
Extremely negative funding rates can signal short covering, and last week's setup clearly created that possibility. But when hedging demand is real, it can also persist longer than expected.
Extreme spikes and drops in funding rates reflect one-sided positioning, which can persist during strong directional moves.
This persistence usually comes from two places.
Some traders are hedging real spot exposure, meaning they are not precisely predicting the next move but simply protecting their portfolios. Others are simple trend followers, willing to pay funding rates as long as the market continues moving in their direction. Both types can keep funding rates negative even after the initial panic has passed.
That's why the real signal isn't whether funding rates are negative. A more interesting pattern emerges when funding rates remain significantly negative while prices stop making new lows. Then, pressure begins to build beneath the surface. Shorts are still paying to maintain positions, but the market is no longer rewarding them in the same way. This is how short-covering conditions form.
The Jobs Report Brought Real Macro Input to the Market
This week's macro catalyst came from the U.S. labor market. On March 6, the Bureau of Labor Statistics reported a loss of 92,000 non-farm jobs in February, with an unemployment rate of 4.4%.
Such reports trigger broad repricing because they touch on multiple market themes. A weaker labor market could lower yields if traders believe the Fed may need a more dovish path. It could also hit risk appetite if traders interpret the data as a sign of real economic weakness.
The crypto market typically feels this debate more intensely because leverage turns macro issues into positioning events.
If traders are heavily short and macro data even briefly eases financial conditions, prices can surge rapidly as shorts are forced to cover.
If the data deepens risk-off sentiment, the same crowded positioning can continue to pressure downward as shorts remain comfortable and longs start to capitulate.
Funding rates are the pressure gauge, open interest is the fuel, and liquidations are the moment pressure starts to break through the system.
Liquidation Data Is the Scoreboard
Liquidation data tells you whether the move is orderly or forced.
Short liquidations usually confirm a covering event, while long liquidations usually confirm a washout to the downside. When both longs and shorts are liquidated in a short time, the market is telling you that volatility has taken over, and neither side has much room to hold positions.
That's why liquidation data is best used as a confirmation layer. Funding rates set the conditions, but liquidations tell you whether those conditions are actually forced into price.
Open interest is equally important here. If participation shrinks synchronously, falling prices and negative funding rates don't say much.
This may only mean traders are stepping back to wait and see. But when open interest rises alongside negative funding rates, it means new positions are being built with a bearish or defensive bias.
Tracking open interest in BTC terms removes some distortions from price fluctuations, so a rise in BTC-denominated open interest during price declines more clearly reflects market participation.
From this perspective, the past week wasn't really about Bitcoin's strength or weakness but about where pressure was building.
The derivatives market showed heavy shorting or hedging before the jobs data landed.
The jobs report then provided a real macro input for global markets to process.
When these two things met, the crypto market did what it usually does: It expressed the same macro uncertainty everyone was facing with larger candles, faster reversals, and more violent position liquidations.
Funding rates don't predict price; they only tell you where leverage is leaning. Open interest doesn't tell you who is right, only how many positions are still on the field. Liquidation data doesn't explain the entire move, only when the move becomes involuntary.
That's why derivatives ultimately became the best macro explainer this week. Before the narrative dust settled, the ledger had already painted the risks clearly. Traders were shorting, leverage was still in the system, and the jobs report gave the market a real object to react to.
What happened afterward was simply price discovering how crowded the room was.