Author: Rita
The S&P 500 and Nasdaq have held up despite surging bond yields, yet market breadth is at historically low levels. In a report dated October 6, 2026, Bank of America Securities pointed out that this rally is driven by mega-cap tech stocks and AI-related FOMO (fear of missing out). Low breadth is a classic feature of bubble formation, which typically continues until the bubble bursts.
Bank of America believes that technological optimism is currently outweighing macroeconomic and policy uncertainties. Investors unwilling to participate in the narrow AI-led rally risk underperforming. This report essentially bets that the frothy pricing of the AI trade can continue to overcome macroeconomic pressures.
Tech Stocks React Asymmetrically to Yields
Last Friday, soft non-farm payroll data pushed yields lower, and stocks rose. The Nasdaq still closed higher even after yields fully erased their earlier gains. Bank of America calculates that tech stocks react asymmetrically to moves in the 10-year yield, with gains during yield declines being roughly three times the size of losses during yield increases.
Over the past month, the Nasdaq has risen about 6% while the 10-year yield has increased about 50 basis points. Bank of America views this reaction pattern as indicative of the inherent bubble dynamics within the AI trade. Other sectors are more sensitive to interest rates, further widening the divergence and pushing up dispersion.
The realized volatility on up days for the S&P 500 and Nasdaq far exceeds that on down days. Bank of America believes that right-tail risk remains the primary risk for US stocks, especially for tech stocks.
Market Maker Hedging Nears Peak Strength
Structured product issuance continues to grow, with North American annualized Q3 issuance around $35 billion, potentially setting another record. Index-linked products remain the main driver, with Q3 SPX and RTY issuance around $6.5 billion and $5 billion, respectively. Among single stocks, Nvidia's year-to-date issuance exceeds $8 billion, far ahead of others.
Bank of America notes that SPX, NDX, RTY, and SX5E are all near the Vanna peak of outstanding structured products, meaning market maker hedging flows are approaching their strongest levels. This effect is most pronounced for semiconductors and individual US tech stocks.
The depth of the SPX market dilutes the impact, with structured product flows equivalent to only about 6% of average daily listed Vega volume. For NDX, this rises to about 36%, and for RTY, it exceeds a full day's volume, reaching 185%. Bank of America believes NDX and RTY are the major benchmarks most strongly affected by autocallable product effects.
Support for Volatility Calendar Strategies
Bank of America believes that long-term volatility is influenced by structural market maker supply, while short-term markets remain vulnerable to position-driven dislocation shocks. This combination supports using volatility calendar strategies, funding short-term gamma purchases by selling longer-term volatility.
Bank of America suggests buying the QQQ November 775/825 call spread at an indicative price of $11.63, with a maximum payout ratio of about 4.3x. This can be partially funded by selling out-of-the-money put options; selling a 15-delta put can reduce the cost by about 50%.
Another approach is buying NDX call options under the condition that interest rates are higher but range-bound. Bank of America views such 'higher stocks, higher rates' structures as providing cheaper upside exposure with limited risk.
Bubble Risk Indicator Signals Caution
Bank of America's Bubble Risk Indicator (BRI) shows US tech stocks have the highest BRI readings. Semiconductors have rebounded from the pullback in healthcare, keeping the tech sector BRI elevated.
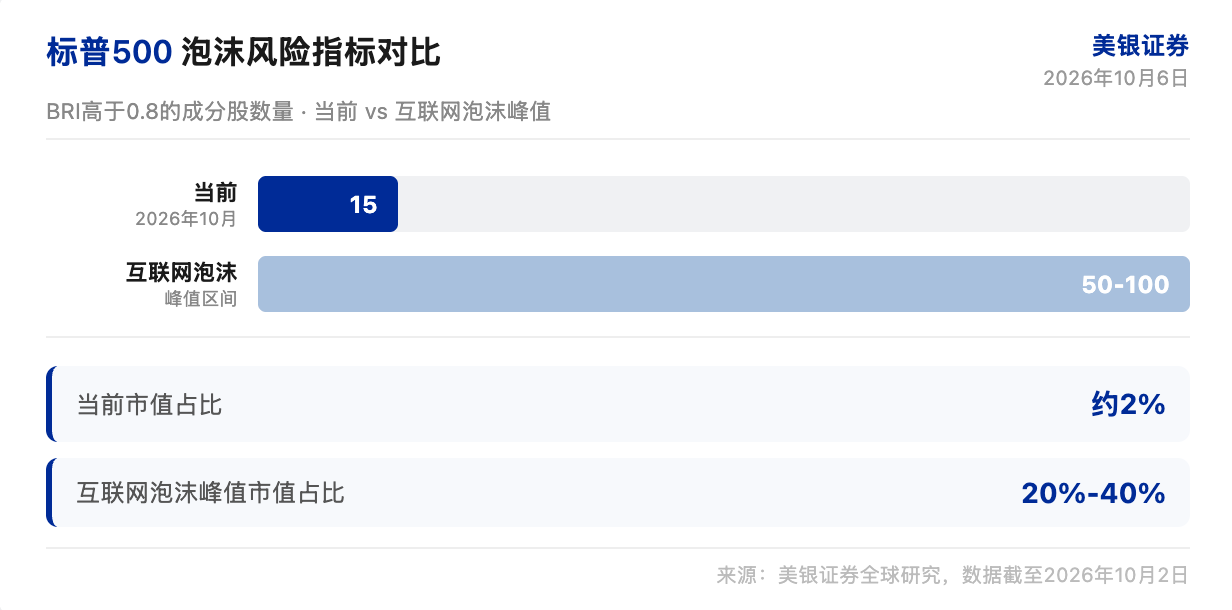
Among individual stocks, MRNA, HPE, CRWD, ZBRA, and RVTY have the highest BRI readings within the S&P 500. Compared to the late-1990s internet bubble, the current froth remains localized. Back then, 50 to 100 S&P constituents had a BRI above 0.8, representing 20% to 40% of market cap. Currently, only about 15 stocks are above 0.8, representing about 2% of market cap.
In historical bubbles, the median maximum drawdown 3 months after a BRI reading exceeds 0.8 has been worse than when it is below 0.8. Bank of America notes that a BRI above 0.8 typically signals asymmetric near-term downside risk. However, fully exiting before a bubble bursts may lead to underperformance. The BRI is better suited as a tool for adding protection or rotating stock exposure.
Bank of America's Specific Recommendations
Bank of America maintains a stance of being long tech upside while expressing it with limited-risk structures. It recommends buying the QQQ November 775/825 call spread, which can be funded with put options. Buying NDX call options is suggested under the condition of higher but range-bound interest rates.
NDX and RTY, which have the strongest autocallable effects, are suitable for funding short-term gamma purchases by selling longer-term volatility. Right-tail risk remains for US stocks, especially tech.
Narrow market breadth is a feature of bubble formation. Bank of America believes this characteristic will persist until the bubble bursts.

Disclaimer
This article is a compilation and interpretation by Chaoxiang Research of a third-party brokerage research report (Bank of America Securities, October 6, 2026), combined with publicly available market information. The ratings, target prices, earnings forecasts, and related judgments cited in the article are the views of the brokerage's analysts, representing only the position of their affiliated institution. They do not represent the views of Chaoxiang Research and do not constitute any investment advice.
The market carries risks, and investment decisions should be made independently. This article should not be used as a basis for trading any securities.