As the Strait of Hormuz Reopens, What Trades Is the Market Betting On?

marsbitPublicado em 2026-06-15Última atualização em 2026-06-15

Resumo

As the possibility of a US-Iran agreement and the reopening of the Strait of Hormuz emerges, financial markets are rapidly pricing out the geopolitical risk premium built over the past three months. Following announcements from US and Iranian officials, Asian markets rallied and oil prices (Brent crude fell to around $84) dropped significantly. Analysts highlight several potential trades: shorting crude oil's risk premium (with Brent potentially falling to $80), buying airline and cruise stocks (like DAL, UAL, CCL) due to lower fuel costs, favoring Asian energy-importing economies (Japan, South Korea), and extending bond duration while selling inflation expectations as energy-driven price pressures ease. Other beneficiaries include LNG, fertilizer, and chemical chains. However, risks remain as the formal signing is set for June 19th, with implementation and shipping logistics taking time. Key signals to watch are oil prices sustaining below key levels, the performance of transportation stocks, and prediction market probabilities for the deal. The market is betting on de-escalation but remains cautious of execution risks.

This is the 40th time Trump has said a U.S.-Iran deal is about to happen.

While we've largely become immune to Trump's statements, this time the progress is more concrete than ever before.

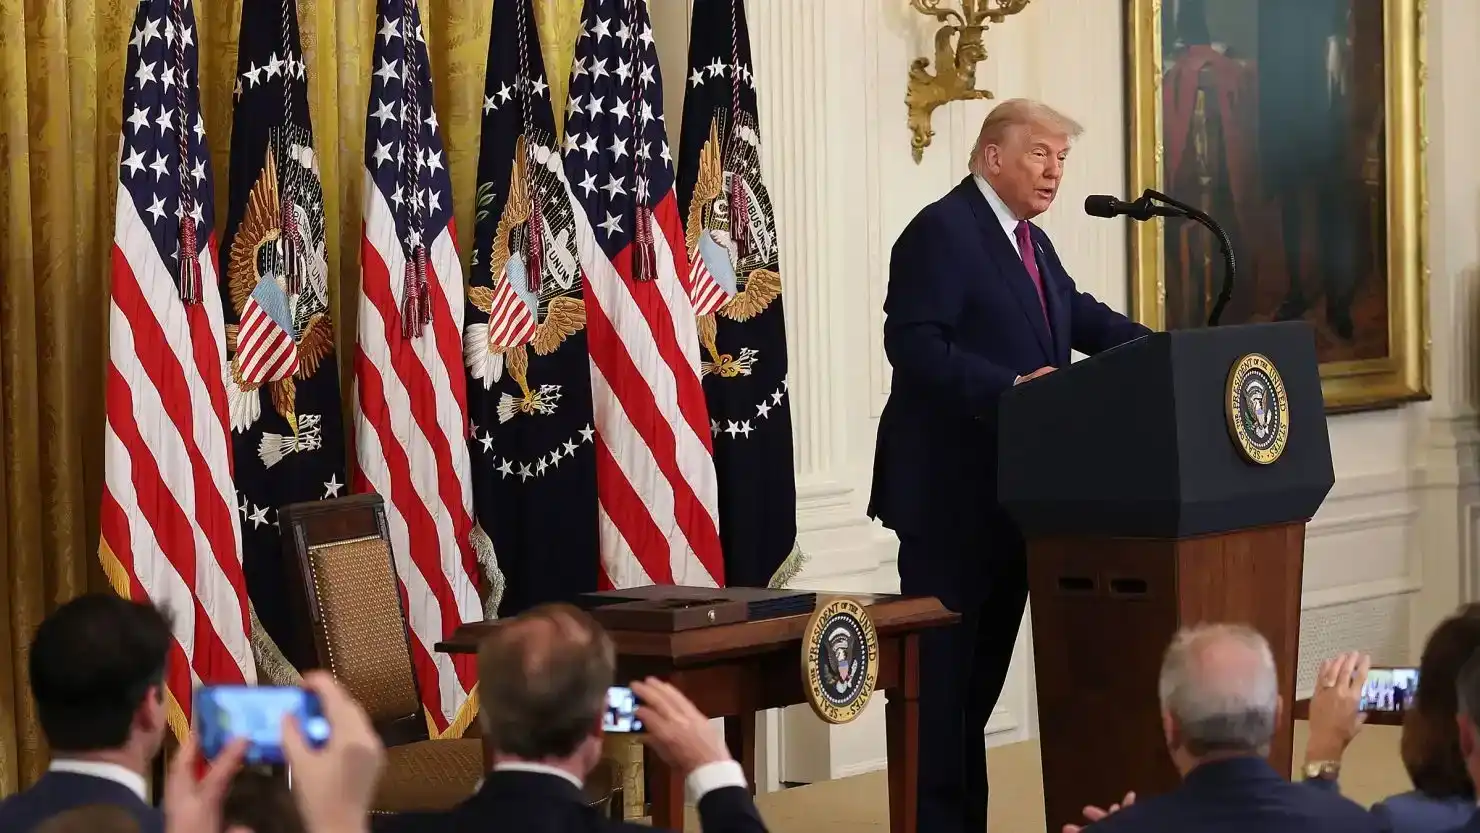
On June 14th, Pakistani Prime Minister Shehbaz Sharif announced a U.S.-Iran peace agreement. Trump subsequently confirmed, stating the maritime blockade would be lifted, allowing "free passage" through the Strait of Hormuz. Iran's Deputy Foreign Minister also said the text of the agreement is complete, with an immediate end to war and military operations, including actions towards Lebanon.
Asian markets gave the answer directly at Monday's open. Major indices in Tokyo and Seoul surged over 5% at one point, oil prices fell $3 per barrel, with Brent dropping to around $84. The logic is straightforward: the geopolitical risk premium that has been weighing on energy prices for the past three and a half months is being squeezed out by the market in a rush.

Although this is not yet a finalized peace agreement. The crucial signing is scheduled for June 19th in Switzerland, and the American and Iranian understandings of the deal differ. The U.S. speaks of a free and open strait, while Iranian media reports say maritime traffic will be coordinated and managed by Iran and Oman, resuming within 30 days according to "Iranian arrangements." Israel was still striking Beirut around the time of the announcement. The tough issues—nuclear matters, uranium enrichment, sanctions relief—have all been pushed into a 60-day negotiation window.

But we can more accurately say that the war and conflict have essentially shifted completely from the military level to the bargaining table.

The importance of the Strait of Hormuz needs little explanation. Before the war, about one-fifth of the world's oil and significant volumes of LNG passed through this waterway. Following U.S.-Israeli strikes on Iran on February 28th, Iran retaliated with missiles, drones, and maritime restrictions, gradually turning the strait from a "risk corridor" to a "de facto impeded corridor." Over the past three-plus months, the market feared a triple lock: Iran using the strait as a bargaining chip, the U.S. blockading Iranian ports, and the Israeli-Hezbollah front making it politically difficult for Iran to concede domestically. These three lines were twisted together, leaving no room for movement.
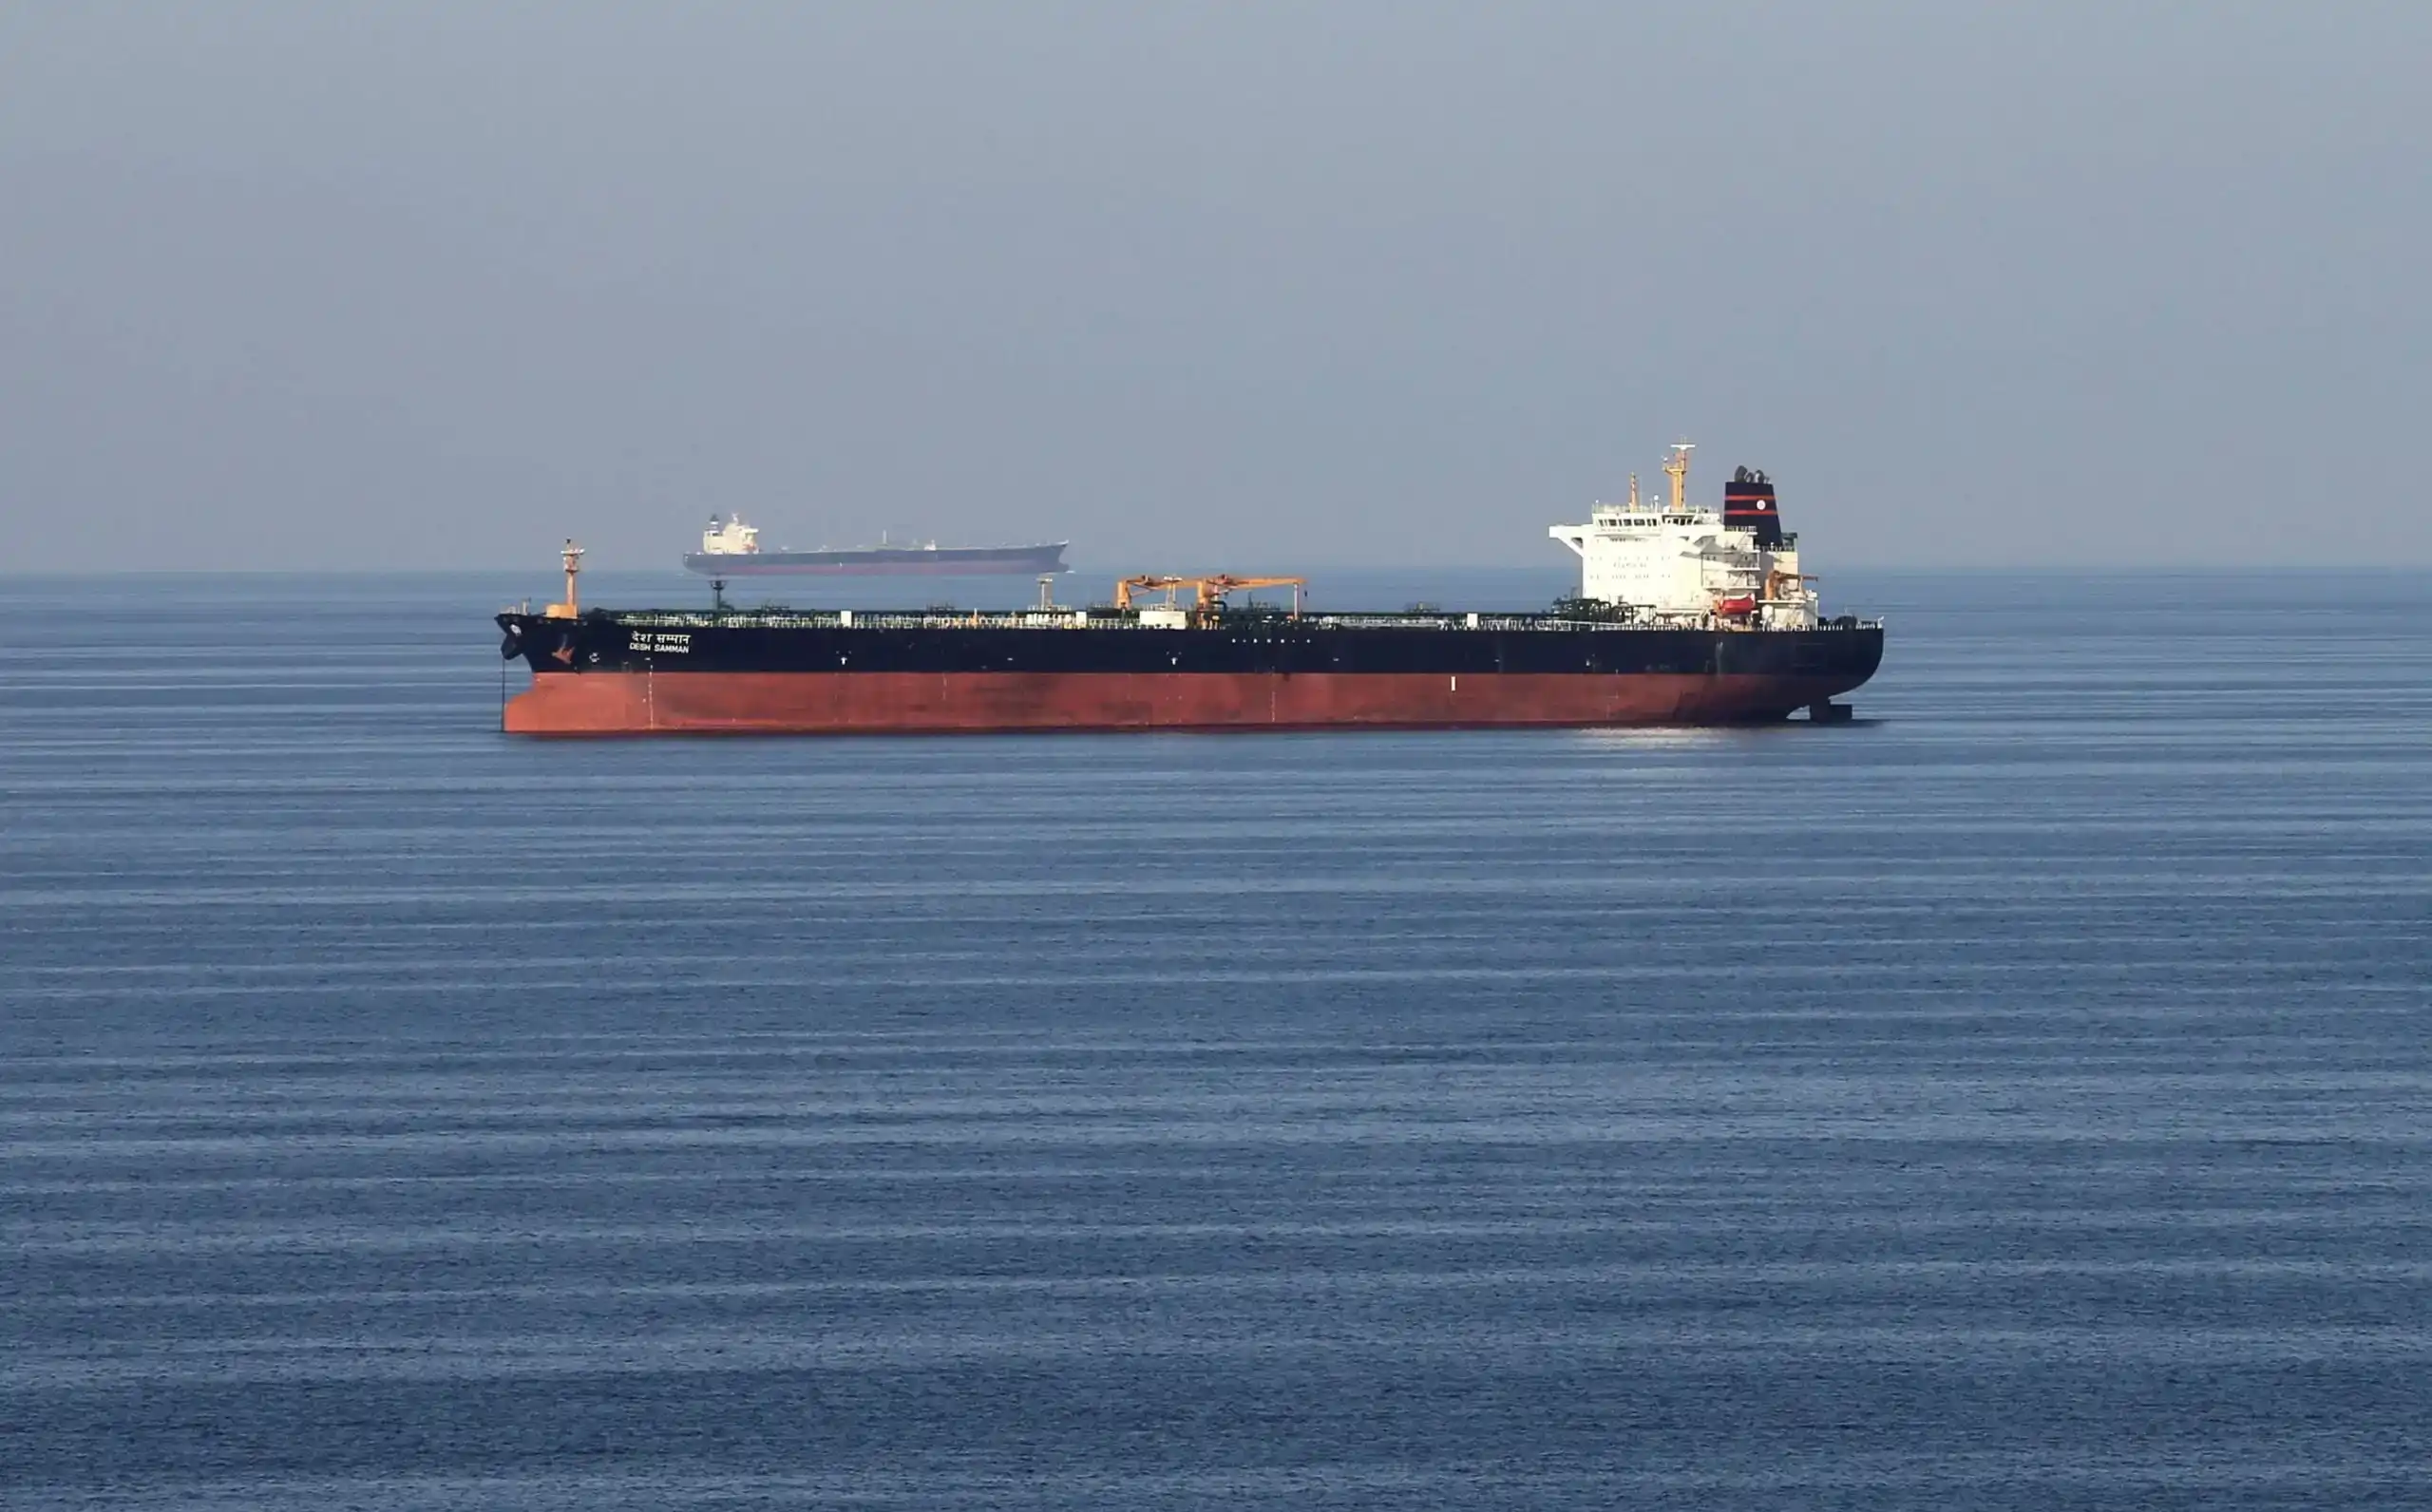
Now the strait has officially entered the reopening process. AP, citing energy experts, assesses that even if the agreement takes effect, it could take months for oil and gas supplies to normalize, as time is needed for vessels, insurance, refineries, mine clearance, and security arrangements. Tankers stranded in the Persian Gulf won't set sail based on a statement alone, and insurers and shipowners won't reset their risk assumptions to pre-war levels overnight.

For us investors, the most important question is: which financial products can we trade now?

What Is the Market Trading After the Strait Reopens?

Over the past few months, crude oil, natural gas, shipping insurance, jet fuel, fertilizers, and inflation expectations have all been layered with a Middle East risk premium. Now, if the agreement is signed as planned on June 19th and ship passage gradually resumes, these assets will be the first affected.

Some price reactions have been extremely swift. MarketWatch reported that following the deal news, Dow futures rose over 350 points, S&P 500 futures gained about 1%, and Nasdaq 100 futures increased roughly 1.6%. WTI fell below $81, with Brent dropping to around $83.5. Axios reported Brent at about $84.21, and U.S. gasoline prices also retreated from around $4.56/gallon in May to about $4.07.

To discuss more specifically, what other assets can we trade?

First, shorting the crude oil risk premium. CBA commodity analyst Vivek Dhar, in a report cited by WSJ, offered a judgment: if the Strait of Hormuz remains open, Brent could fall back to around $80 by year-end. His key assumption is that as long as oil product flows through the strait recover to 60-70% of pre-war levels, combined with non-OPEC+ supply growth and the existence of some alternative pipelines, the market could return to pricing that is relatively supply-loose. What does $80 Brent signify? It means the $15 to $20 premium added over the past three months due to the war will be systematically squeezed out.

Second, going long on airlines, cruise lines, and the travel chain. Lower fuel costs directly improve profit margins; this line is the most straightforward. IATA recently slashed its 2026 global airline industry net profit forecast from $41 billion to $23 billion, citing soaring jet fuel prices. Barron's reported IATA expects total aviation fuel costs to reach $350 billion this year. With oil dropping from the $90-$100 range to the low $80s, airline stocks have the greatest elasticity. Key names to watch include the airline ETF JETS, as well as DAL (Delta Air Lines), UAL (United Airlines), AAL (American Airlines), and LUV (Southwest Airlines). For cruise lines: CCL (Carnival Corporation), RCL (Royal Caribbean Group), NCLH (Norwegian Cruise Line Holdings). As of the close on June 12th, DAL was at $83.06, UAL at $115.52, AAL at $14.98, LUV at $45.47, CCL at $29.18, and NCLH at $19.43. If oil prices remain low ahead of the U.S. market open, airlines and cruise lines are likely the first place pre-market funds will flow.

Third, going long on Asian energy-importing countries. Japan, South Korea, India, China are direct beneficiaries of lower Middle Eastern oil and gas prices. Commerzbank Research, mentioned in a WSJ report, noted Asian currencies generally strengthened in early trading, with USD/JPY falling to about 159.93, USD/KRW to about 1505.60, and AUD rising to about 0.7079. NAB chief economist Sally Auld's view is that falling oil prices ease inflationary pressures for energy importers like Japan, leading to a rise in Japanese 10-year government bond futures. Trades could include going long on Japanese, Korean, or Indian stock indices, or going long on the currencies and bonds of Asian importing nations.

Fourth, going long on bond duration, shorting inflation expectations. Falling oil prices directly lower costs for gasoline, aviation, logistics, and some food items, also reducing market worries about central banks maintaining high interest rates. Watch TLT, the U.S. 10-year Treasury yield, TIPS breakevens, and gold. Gold is special here: if the market believes the strait reopening is real, both gold and oil's safe-haven premiums will recede; if the June 19th signing fails, both will rebound simultaneously. Gold acts as a hedge indicator in this trade, not a directional one.

Fifth, the repricing of the LNG, fertilizer, and chemical chains. Qatari LNG transits the Strait of Hormuz; its reopening will lower the risk premium for LNG in Asia and Europe, benefiting gas-consuming companies, chemical firms, and some power-cost-sensitive industries. The Middle East is also a major supplier of fertilizers like urea and ammonia; resumed navigation means reduced price pressure on agricultural inputs. This line is more macro-chain oriented, favorable for downstream chemical and agricultural cost sides, not necessarily specific stocks.

Polymarket's prediction markets can serve as a "probability thermometer." The "Yes" price for "US-Iran nuclear deal by June 30" is around 0.84, implying an 84% market-assigned probability. "US-Iran nuclear deal before 2027" Yes is about 0.945. "Will the U.S. invade Iran before 2027" Yes is only about 0.115. "Iran Nuke before 2027" is about 0.0735. "Will the Iranian regime fall by June 30" is about 0.0065. These numbers mean: the probability of a near-term deal is high, but longer-term tail risks remain. The market is betting on de-escalation, but not going all-in.

For a U.S. pre-market watchlist, the editor has compiled some:

Tier 1, most direct beneficiaries of lower fuel costs: JETS, DAL, UAL, AAL, LUV, CCL, RCL, NCLH.

Tier 2, beneficiaries of recovering risk appetite, especially small-caps and cyclicals: SPY (S&P 500 ETF), QQQ (Nasdaq-100 ETF), IWM (Russell 2000 small-cap ETF).

Tier 3, companies benefiting from lower costs but with slower elasticity: FDX (FedEx), UPS (United Parcel Service), DOW (Dow Inc.), LYB (LyondellBasell).

Conversely, XOM (Exxon Mobil), CVX (Chevron), SLB, HAL (Halliburton), XLE (Energy Select Sector SPDR Fund)—these upstream energy and oil services stocks are more likely to face near-term pressure. They were beneficiaries of high oil prices and the war premium; as that premium is squeezed out, their investment thesis needs recalculation.

Finally, risks. The biggest fear in this trade isn't "oil prices have already fallen," but "the agreement hasn't truly been implemented." The June 19th signing, maritime mine clearance, falling insurance rates, shipowners resuming passage, the implementation of the Iran-Oman coordination mechanism—these steps need verification one by one. Key signals to track: whether Brent can break below $80, WTI below $78, whether airline and cruise stocks can hold their gains after opening higher, and whether Polymarket's Iran deal contracts stay above 80%.

If these conditions hold simultaneously, it indicates the market is switching from "war shock" to "supply recovery."

If oil prices rebound to $88-$90, or if Polymarket deal probabilities drop rapidly, it's time to reduce exposure on this reopening trade.


Perguntas relacionadas

QAccording to the article, what are the three types of assets most directly impacted by the removal of Middle East risk premiums after the announcement of the Strait of Hormuz reopening?

AThe three most directly impacted asset types are: 1) Crude oil and natural gas (specifically their risk premiums), 2) Aviation fuel, shipping insurance, and related sectors like airlines and cruise lines, and 3) Inflation expectations, which influence bond markets (like US Treasuries and TIPS).

QWhat are the two primary trade ideas suggested for benefiting from falling oil prices due to the Hormuz reopening?

AThe two primary trade ideas are: 1) Shorting the crude oil risk premium, anticipating a systematic squeeze of the $15-$20 per barrel premium added during the conflict. 2) Going long on airline, cruise line, and tourism-related stocks (e.g., via ETF JETS, or stocks like DAL, UAL, CCL, RCL) as their fuel costs decline and profit margins improve.

QWhich Asian economies are highlighted as direct beneficiaries of cheaper Middle Eastern oil and gas imports?

AThe article highlights Japan, South Korea, India, and China as the primary Asian beneficiaries of cheaper oil and gas imports. It notes their currencies strengthened and their bond markets reacted positively to reduced inflationary pressures.

QWhat role does Polymarket's prediction market data play in the analysis, and what probability does it assign to a US-Iran nuclear deal by June 30?

APolymarket's data serves as a 'probability thermometer' for market sentiment on geopolitical risks. It assigns an 84% probability (Yes price ~0.84) to a US-Iran nuclear deal being reached by June 30, indicating high short-term confidence in the deal but not a complete elimination of long-term tail risks.

QAccording to the article, what are the key signals to watch to confirm the market is transitioning from 'war shock' to 'supply recovery' mode?

AThe key confirming signals are: 1) Brent crude oil price breaking below $80 per barrel and WTI below $78. 2) Airline and cruise stocks maintaining their gains after an initial rally. 3) Polymarket's probability for the Iran deal remaining above 80%. If these occur simultaneously, it signals the transition.

Leituras Relacionadas

After Three Consecutive Quarters of Decline, Can the Crypto Market Find a Window for Stabilization in Q3?

The cryptocurrency market has just concluded its worst-performing quarter since 2022, with total capitalization dropping 12.6% to $2.1 trillion. All core metrics indicate capital is leaving the sector, not just rotating within it. Bitcoin fell 14.2% and Ethereum dropped 25.4% in Q2, breaking their previous correlation with US tech stocks. A key driver is the reversal in US spot Bitcoin ETF flows, which saw a net outflow of approximately $4.67 billion in Q2, including a record monthly outflow near $4.5 billion in June. While recent data suggests long-term holders are accumulating again, sustained ETF outflows mean continued selling pressure. Market focus is now singularly on the Federal Reserve. The upcoming July FOMC meeting is seen as the most critical event for Q3. A dovish signal could support Bitcoin reclaiming a $68,000-$84,000 range, while a hawkish stance might establish a new trading band around $50,000-$56,000. Additionally, regulatory uncertainty persists, with the progress of the crucial *CLARITY Act* stalling in the Senate, reducing its perceived 2026 passage probability to 40-45%. Despite the broad downturn, a few sectors showed growth. Prediction markets saw nominal volume surge 48.7% year-over-year to $113.8 billion, and tokenized collectibles transaction volume rose 143% quarterly to $1.4 billion. The Real-World Asset (RWA) tokenization sector also continued steady growth, now representing ~$28.1 billion in on-chain value. The market's foundation for an extreme crash appears limited, with Bitcoin price hovering near its 200-week moving average. However, the trading paradigm has shifted from narrative-driven speculation to decisions based on price action, policy developments, and interest rate expectations, making a broad sentiment-driven rally unlikely in the near term.

marsbitHá 48m

After Three Consecutive Quarters of Decline, Can the Crypto Market Find a Window for Stabilization in Q3?

marsbitHá 48m

BIT Trading Moment: BTC Still Suppressed by Weekly 200 EMA, Rejection May Restart Decline; Storage and Semiconductors that Surged Last Night Begin Falling in Evening Trading

**Crypto & Stock Market Wrap: Bitcoin Tests Resistance, Stocks Retreat After AI Surge** Bitcoin consolidates around $66,000, facing key resistance near $68,000—an area seen as a major psychological and technical hurdle where previous rallies have failed. Analysts note the cryptocurrency is caught between its 200-week moving average (~$63,333) and 200-week EMA (~$68,328). A clear break above $68k is needed to signal a stronger bullish trend, while a rejection could lead to a retest of $63k support. Market sentiment remains cautious, with low futures open interest pointing to a low-liquidity rebound rather than a full bull market. Bitcoin spot ETFs saw another $203 million inflow. US stock futures pointed lower after a strong Tuesday session led by a massive rebound in semiconductors and memory stocks. The rally was fueled by renewed optimism about AI-driven hardware demand, with Micron, SanDisk, and SK Hynix surging. However, those gains reversed in pre-market trading. Super Micro Computer (SMCI) soared over 20% after hours on strong guidance and a record backlog. Other standouts included Rocket Lab and nuclear energy plays Oklo and X-Energy. Rising oil prices (Brent above $91) and climbing Treasury yields (10-year near 4.64%), however, are reigniting inflation concerns and acting as a headwind for equities. In Asia, markets were mixed. South Korea's KOSPI pared early gains to close slightly higher as semiconductor stocks like SK Hynix gave back initial surges. Japan's Nikkei edged lower as the yen hit a fresh 38-year low against the dollar, raising fears of potential market intervention. Key events to watch include the Samsung Galaxy launch, AMD's AI event, and a slew of major tech earnings from Alphabet, Tesla, and IBM after the close on Wednesday, followed by the ECB meeting and Intel's earnings on Thursday.

marsbitHá 56m

BIT Trading Moment: BTC Still Suppressed by Weekly 200 EMA, Rejection May Restart Decline; Storage and Semiconductors that Surged Last Night Begin Falling in Evening Trading

marsbitHá 56m

Former CFTC Chairman, Circle President Tarbert: Preaching Long-Termism While Cashing Out $30 Million Himself

Former CFTC Chairman and Circle President Heath Tarbert has consistently advocated for a long-term vision in public, urging patience from investors as Circle’s stock price has fallen significantly from its peak. However, it has been revealed that since Circle’s IPO, Tarbert has continuously sold his CRCL shares through pre-arranged trading plans, cashing out approximately $30 million, without making any public market purchases. This contrast between his public messaging and personal actions has drawn criticism. Tarbert joined Circle in July 2023 as Chief Legal Officer, leveraging his regulatory experience to help guide the company through its IPO and expansion. Despite promoting stablecoins as long-term infrastructure, he established a 10b5-1 trading plan just before Circle went public, leading to substantial stock sales over the following year. In March 2026, he initiated another plan to sell more shares. His career trajectory highlights a pattern of moving between high-level regulatory roles and influential positions in the financial sector. After resigning as CFTC Chairman in early 2021, he joined Citadel Securities as Chief Legal Officer just 27 days later, during a period of intense regulatory scrutiny for the firm. He later joined Circle, aiding its efforts to navigate regulatory challenges for its public listing. While Tarbert's expertise in policy and compliance is valuable to companies like Circle, his actions—advocating long-term confidence while personally divesting—raise questions about the alignment between his public statements and his private financial decisions, leaving investors who followed his advice to bear the market risks.

marsbitHá 1h

Former CFTC Chairman, Circle President Tarbert: Preaching Long-Termism While Cashing Out $30 Million Himself

marsbitHá 1h

Gate Research Institute: The 'Wall Street-ization' Wave of Crypto Financial Products – Competition or Integration?

The article titled "Gate Research Institute: Are Crypto Financial Products Sparking a 'Wall Street' Wave—Competition or Convergence?" explores the evolving relationship between the crypto ecosystem and traditional finance (TradFi). The piece begins by reflecting on Bitcoin's original 2009 vision of decentralization, disintermediation, and moving away from banks. It then contrasts this with the 2024 landscape, where key crypto assets like Bitcoin are increasingly held through Wall Street products like ETFs issued by giants like BlackRock. The article questions whether this signifies that TradFi is systematically taking over the rights to issue, price, custody, and distribute crypto financial assets. The core argument is that this is not a zero-sum takeover but rather a bidirectional convergence where each side addresses the other's weaknesses. Crypto offers 24/7 global markets, programmable settlement, and open access but lacks compliant channels, institutional-grade custody, deep fiat liquidity, and mainstream distribution. TradFi possesses these but is constrained by legacy systems, limited operating hours, and slow settlement. Two primary convergence paths are highlighted: * **Path A (CEX to TradFi):** Exemplified by Gate, which has progressed from offering tokenized stocks and CFDs to providing direct, real stock trading (US, Hong Kong, South Korea) within its platform, using USDT. * **Path B (TradFi to Crypto):** Exemplified by Robinhood, which has integrated crypto trading, acquired exchanges like Bitstamp, and is moving traditional assets like stocks onto the blockchain via tokenization and its own Layer 2. Both paths are ultimately competing to become the next-generation, unified financial account—a "super account" where users can seamlessly trade cryptocurrencies, stocks, ETFs, RWA (Real World Assets), and tokenized treasury products in one interface. The growth of RWA and tokenized treasuries (e.g., BlackRock's BUIDL) is presented as the asset-layer fusion, providing stable, yield-bearing assets on-chain and acting as a bridge between the two worlds. In conclusion, the "Wall Street-ization" of crypto is framed as a mutual transformation. Decentralized ideals persist in the protocol layer, while at the application layer, a more efficient, global, and accessible unified capital market is emerging from this convergence. The future competition lies not between crypto exchanges and stockbrokers, but between platforms vying to offer the most comprehensive asset coverage, liquidity, and user experience within a single account.

marsbitHá 1h

Gate Research Institute: The 'Wall Street-ization' Wave of Crypto Financial Products – Competition or Integration?

marsbitHá 1h

Trading

Spot
活动图片




