Arbitrum gains 10% as volume spikes – Can ARB break supply zone?

ambcryptoPublicado em 2026-04-08Última atualização em 2026-04-08

Resumo

ARB gained 10% in 24 hours, supported by a 40% surge in trading volume exceeding $100 million, indicating strong demand. The token is testing a key supply zone near $0.1031. While the Stochastic RSI suggests potential exhaustion, on-chain data shows whale accumulation reducing supply, and derivatives reflect bullish sentiment with a Long/Short Ratio of 1.6. A break above the resistance could target $1.1, but failure may lead to consolidation. The rally's sustainability depends on continued volume and buying pressure.

Arbitrum gained momentum as price and activity increased over the past 24 hours.

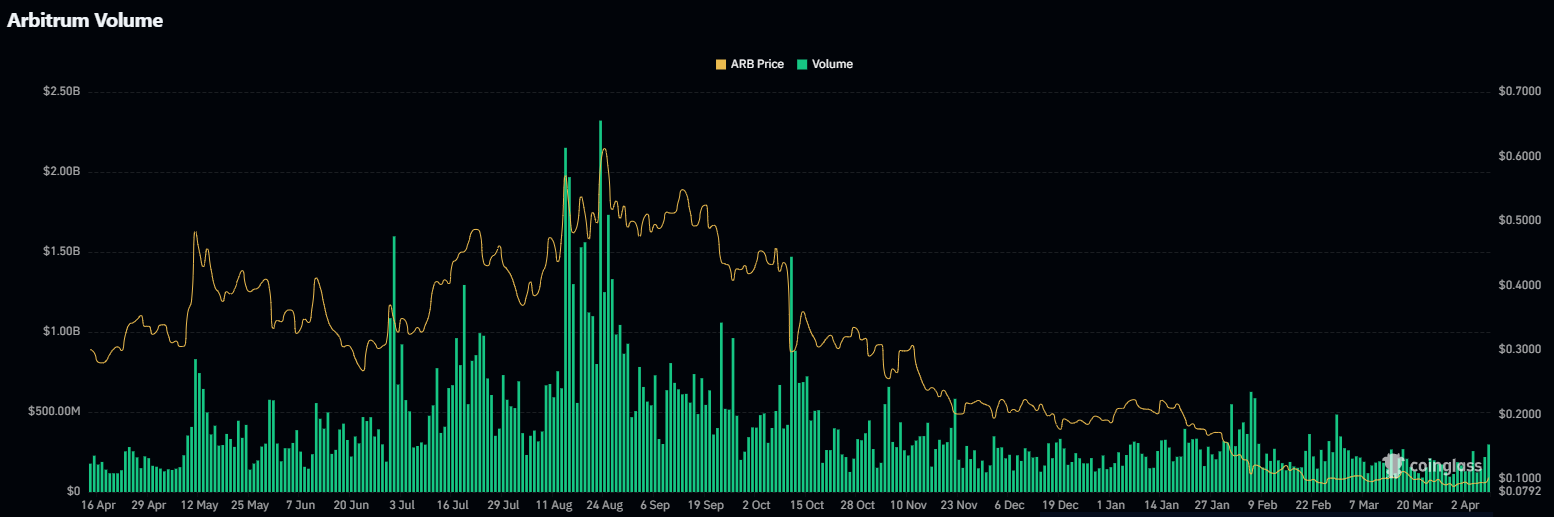
The token, ARB, rose 10%, supported by a sharp rise in market participation. Trading Volume climbed 40%, crossing $100 million.

That expansion suggested growing demand rather than fading interest. However, the Stochastic RSI signaled caution near current levels.

Is volume driving ARB’s rally?

Trading activity surged alongside price, strengthening the current move. The rise in Trading Volume indicated fresh participation rather than short-lived speculation.

That move aligned with sustained buying pressure, which kept momentum intact despite early signs of exhaustion.
Source: CoinGlass

Can ARB clear its supply zone?

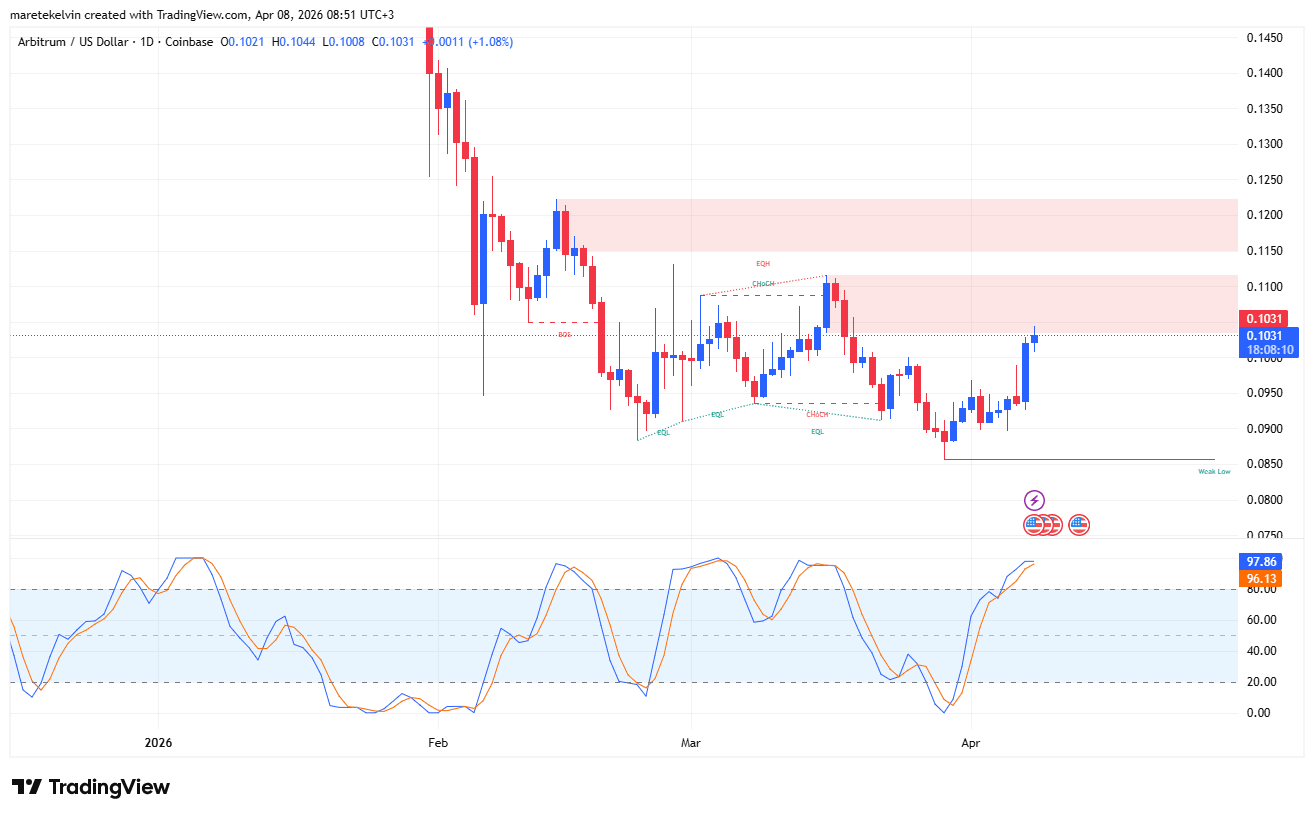
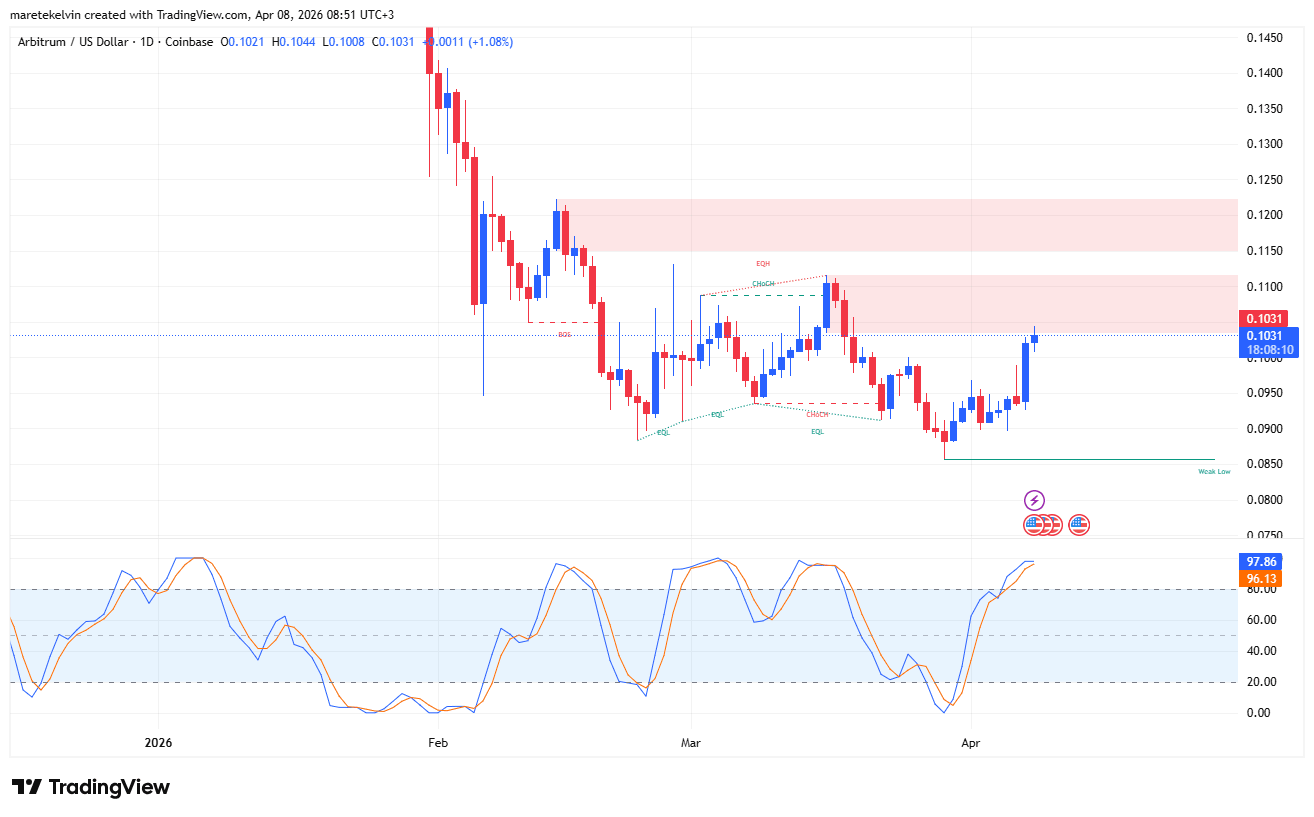
Arbitrum [ARB] tested a key supply zone near $0.1031 on the daily chart. The move followed a strong rally after clearing liquidity clusters during the previous downtrend phase.

Even so, the structure still favored buyers at press time.

However, the Stochastic RSI suggested the rally approached an exhaustion phase. The RSI remained in an oversold region, indicating a potential cooldown.

This left price consolidating near resistance while the market absorbed recent gains.
Source: TradingView

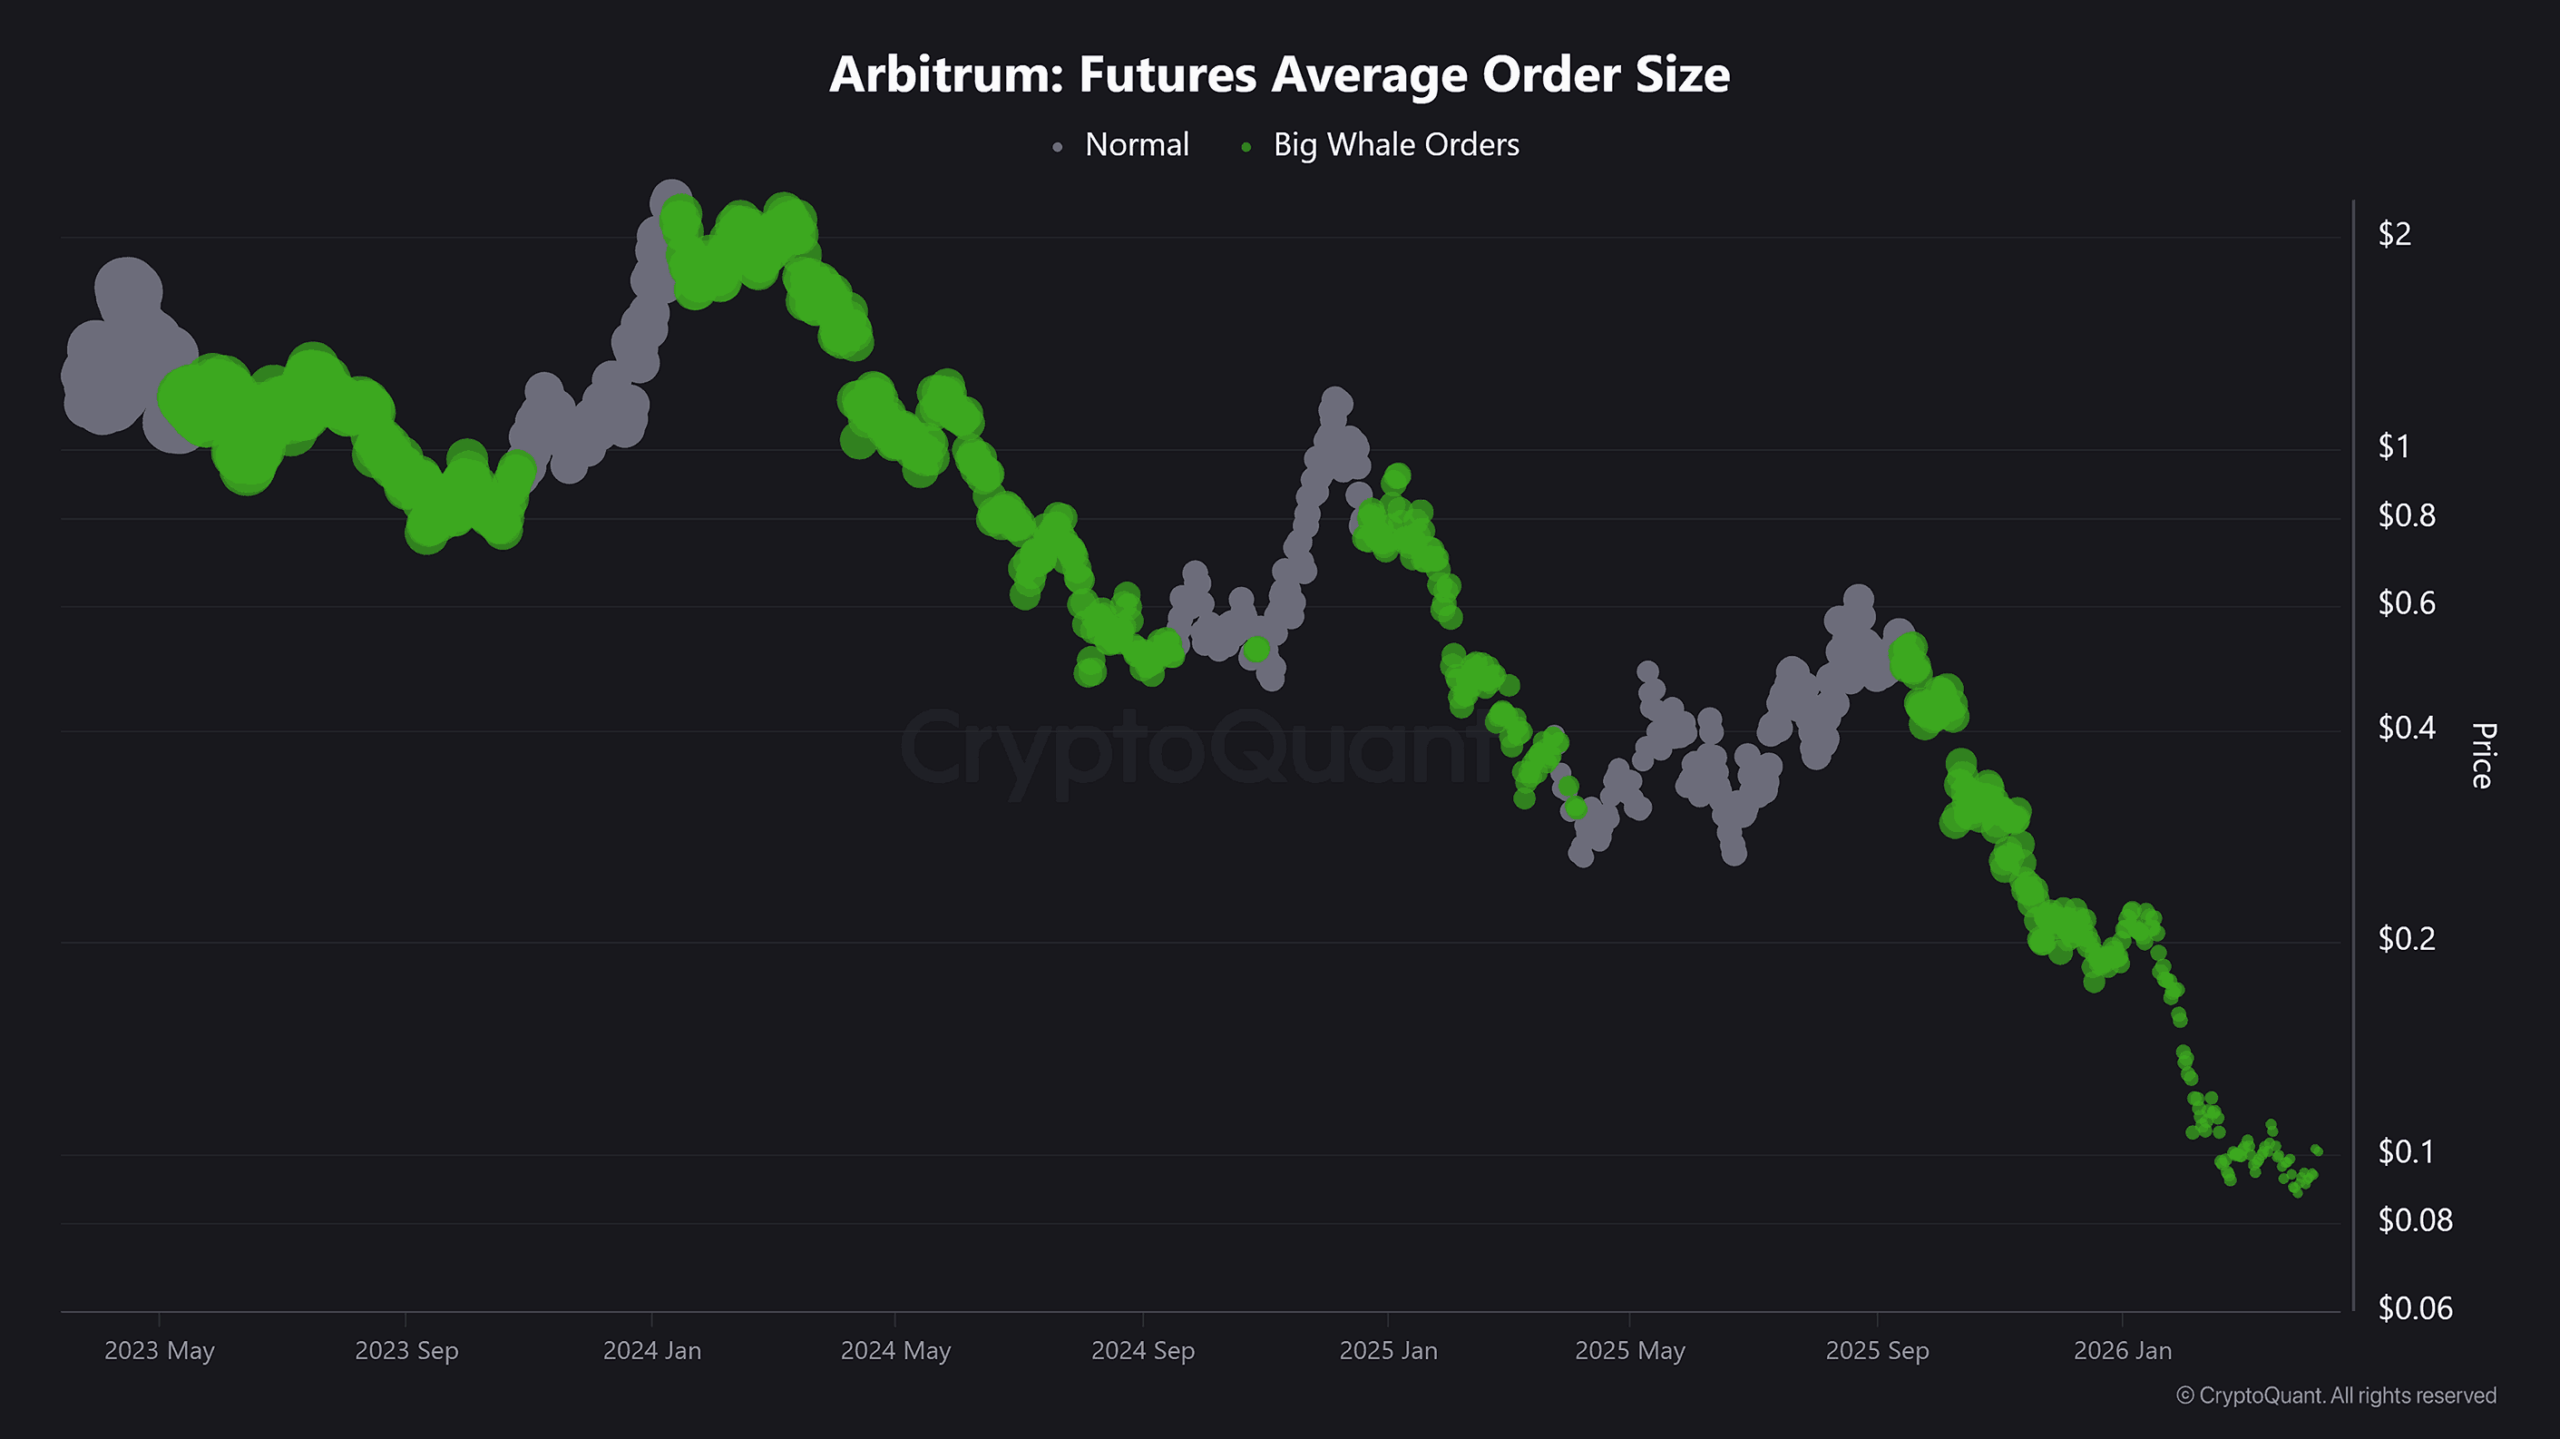
Whale accumulation supports the trend

On-chain data showed continued accumulation by large holders at current levels. This behavior reduced circulating supply and supported the ongoing trend.
Source: CryptoQuant

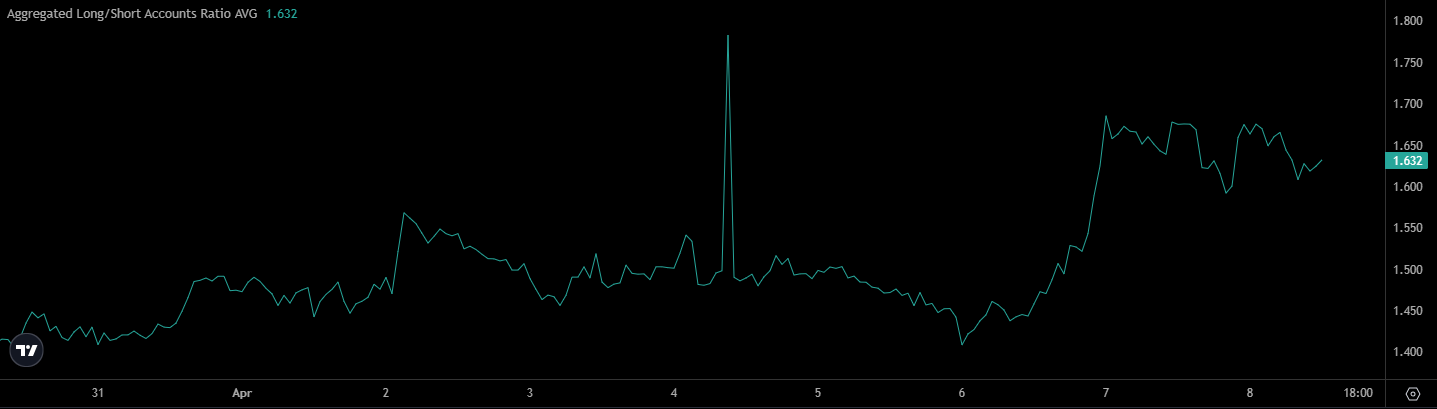
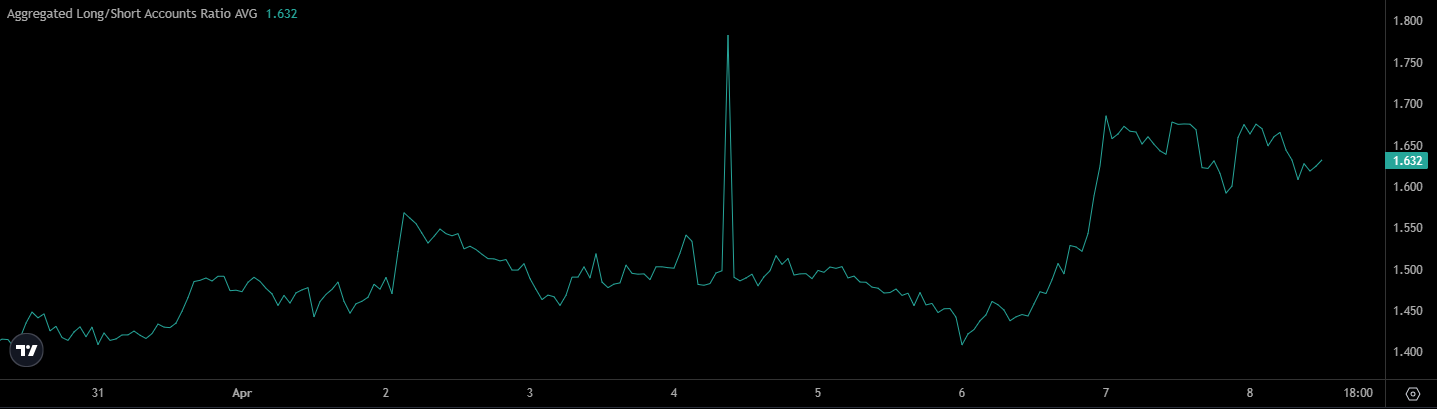
On top of that, derivatives data confirmed bullish positioning. The Long/Short Ratio stood at 1.6, at press time, showing longs outweighed shorts.

That alignment suggested traders leaned toward continuation rather than reversal.
Source: Coinalyze

What is ahead for ARB?

The structure remained constructive as long as buying pressure held. Sustained momentum depended on strong Trading Volume and continued accumulation.

A successful break above the supply zone could open the path toward $1.1. Failure to sustain demand may lead to consolidation before the next move.


Final Summary

  • ARB’s price rise is backed by strong volume growth, showing real market participation rather than a weak bounce.
  • The token is now testing a key supply zone, which will decide whether the rally continues or stalls.


Perguntas relacionadas

QWhat was the percentage increase in ARB's price and the approximate trading volume mentioned in the article?

AARB's price rose by 10%, and the trading volume climbed 40%, crossing $100 million.

QAccording to the technical analysis, what does the Stochastic RSI signal for ARB near its current price level?

AThe Stochastic RSI signaled caution and suggested that the rally was approaching an exhaustion phase.

QWhat key supply zone is ARB testing on the daily chart, and what could a successful break above it lead to?

AARB is testing a key supply zone near $0.1031. A successful break above it could open the path toward $1.1.

QHow did on-chain data and whale activity contribute to supporting the ongoing trend for ARB?

AOn-chain data showed continued accumulation by large holders (whales) at current levels, which reduced circulating supply and supported the ongoing trend.

QWhat does the Long/Short Ratio of 1.6 indicate about trader positioning in the ARB market?

AA Long/Short Ratio of 1.6 indicates that long positions outweigh short positions, showing that traders are leaning toward a continuation of the trend rather than a reversal.

Leituras Relacionadas

Why Bitcoin Holds Above $64,000 After Fed's Hard Pause

**Bitcoin Stabilizes Near $64,000 Following Hawkish Fed Pause** The cryptocurrency market, led by Bitcoin, remained stable around $64,000 despite a volatile reaction to the latest U.S. Federal Reserve meeting. The Fed paused interest rates but signaled a hawkish stance, with three committee members voting for an increase—the highest dissent since 2016. This limits risk appetite but hasn't triggered panic selling. Key market highlights include Bitcoin ETFs seeing a net inflow of $32.1 million, breaking a streak of outflows, while Ethereum ETFs experienced outflows of $18.65 million. Liquidations affected about 90,000 traders. Technically, Bitcoin finds support around $63,000-$63,500, with major resistance near $66,000. While its price is about 49% below its all-time high, institutional demand via ETFs and the absence of mass capitulation support a potential recovery scenario in the second half of the year. Major altcoins showed mixed movements, with Solana attracting capital while Ethereum faced selling pressure despite strong on-chain metrics like a growing staking queue. Regulatory news took a pause as the U.S. Senate delayed the CLARITY Act vote until at least autumn. For the final trading day of July, U.S. inflation and consumer spending data will be crucial. Bitcoin's key levels to watch are $63,000 support and $66,000 resistance. Sustained ETF inflows and Bitcoin holding above $63,000 are seen as positive signs for a potential market recovery later in the year.

cryptonews.ruHá 3h

Why Bitcoin Holds Above $64,000 After Fed's Hard Pause

cryptonews.ruHá 3h

Trading

Spot
活动图片