Annual Loss Rate Only 0.03%: Data Disassembles the Real Risk of DeFi Lending

marsbitPublicado em 2026-05-18Última atualização em 2026-05-18

Resumo

DeFi lending's real-world annual loss rate from hacks and exploits is approximately 0.03% of the Total Value Locked (TVL), excluding cross-chain bridge incidents. This analysis, based on data from DeFi Llama, shows that while lending protocols are frequent targets due to their concentrated assets, the actual financial impact relative to the sector's massive scale is minimal. The overall DeFi hack total of $77.51B is heavily skewed by cross-chain bridge breaches. Removing those, losses drop to $45.18B, with lending and AMM protocols being the most affected non-bridge categories. Risk has significantly improved as the ecosystem has matured. For the year leading to May 2026, net losses in EVM and Solana lending protocols were $30.1 million against an average daily TVL of $99.6 billion, resulting in the 0.03% loss rate. Notably, the industry's asset recovery capability, exemplified by the full recovery and surplus from the Euler Finance hack, mitigates net losses, with a ~20% recovery rate for non-bridge lending incidents. Attack scale follows a log-normal distribution, meaning most incidents are small, and catastrophic losses are rare. This demonstrates that diversification across protocols is an effective risk mitigation strategy. The data indicates that DeFi lending has evolved into a measurable, compartmentalized, and relatively low-risk sector within the broader digital asset landscape.

Written by: Alex McFarlane

Compiled by: Chopper, Foresight News

Every disruptive financial technology is bound to experience growing pains, and decentralized finance (DeFi) is no exception. In the early days, lending markets launched rapidly and expanded dramatically. The industry was hit by various security attacks in the open market one after another, then gradually explored ways to improve code security, collateral risk control, oracle mechanisms, liquidation logic, and governance systems.

Past risk cases have reference value, but they can no longer represent today's mature DeFi ecosystem. After all, those who only review history often fail to seize current opportunities.

Excluding security incidents related to cross-chain bridges, the estimated annual loss rate caused by theft and malicious attacks for DeFi lending operations on Ethereum Virtual Machine (EVM) and Solana chains is about 0.03% of the total value locked (TVL) in lending. This analysis data is all integrated from hacker attacks and vulnerability theft events annotated on the DeFi Llama platform.

The core standard for judging security risk is: how significant is the actual loss from exploited vulnerabilities relative to the amount of funds in the market?

The loss rate of three ten-thousandths is roughly equivalent to the probability of an American citizen dying from an accidental slip and fall. This shows that, setting aside the widespread market panic, the actual security risk of DeFi lending business is actually quite low.

Breakdown of DeFi Security Incidents

As of May 16, 2026, DeFi Llama statistics show that the total amount stolen across all categories of DeFi protocols reached $7.751 billion. This statistical scope is extremely broad. The overall data includes cross-chain bridges, decentralized exchanges, derivative protocols, blockchain game-related projects, digital wallets, underlying infrastructure failures, and non-lending DeFi businesses.

Among them, cross-chain bridges are the hardest hit area: after removing security incidents related to cross-chain bridges, the total theft loss in the DeFi field is reduced to $4.518 billion.

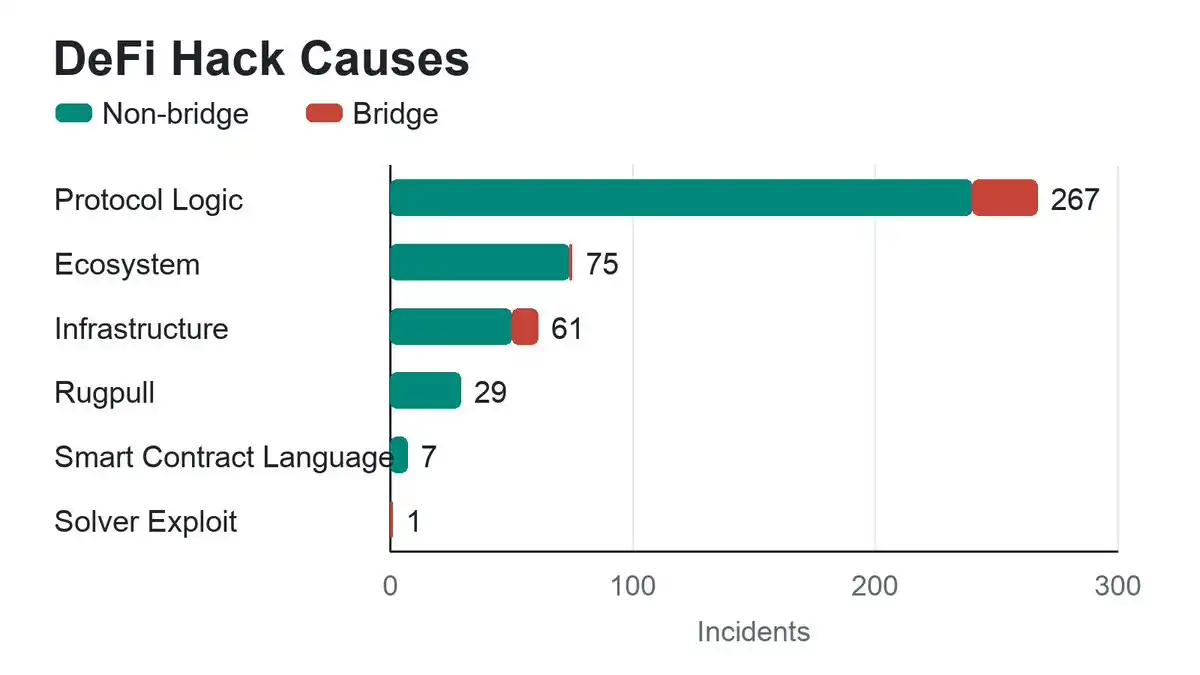
Code execution strictly follows written instructions, not the developer's ideal expectations, which is the root cause of frequent vulnerabilities. It is meaningful to categorize risks well: DeFi is not a single sector with unified risks. Cross-chain bridge theft, DEX oracle manipulation, wallet phishing scams, and collateral asset vulnerabilities in lending markets are all completely different types of risks.

Among all DeFi protocols, lending markets are attacked most frequently, for a very straightforward reason: large amounts of assets are locked in smart contracts for extended periods, making them primary targets for hackers.

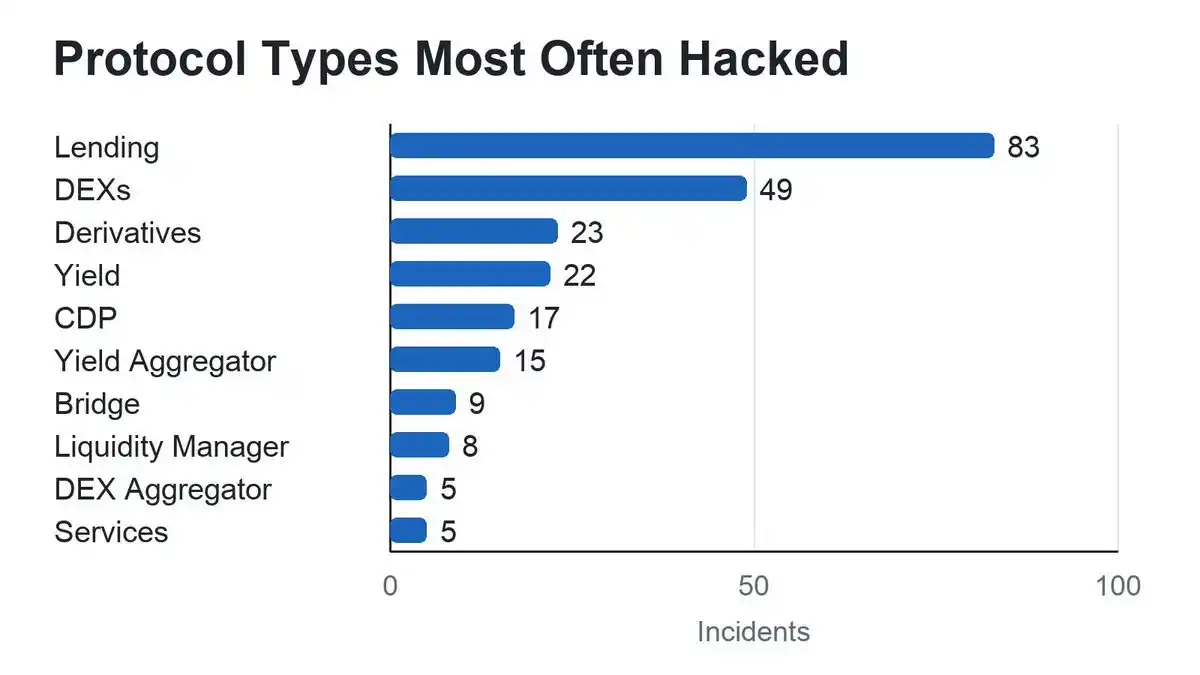
Lending protocols and automated market makers (AMMs) are sectors with high incident rates. Their core commonality is the need to pool large amounts of assets into smart contracts. Apart from cross-chain bridges, the vast majority of security incidents are concentrated in these two types of protocols. This article will focus on the lending and capital borrowing sector for analysis.

Fund Loss Rate Has Greatly Improved

Today, the overall TVL of DeFi is far higher than in the early stages of frequent vulnerabilities, especially in the lending sector. Projects have more mature risk control systems, more comprehensive code audits, and increasingly sophisticated real-time network-wide risk monitoring. Excluding cross-chain bridge incidents, the actual annualized theft loss proportion for lending businesses in EVM and Solana ecosystems has significantly decreased.

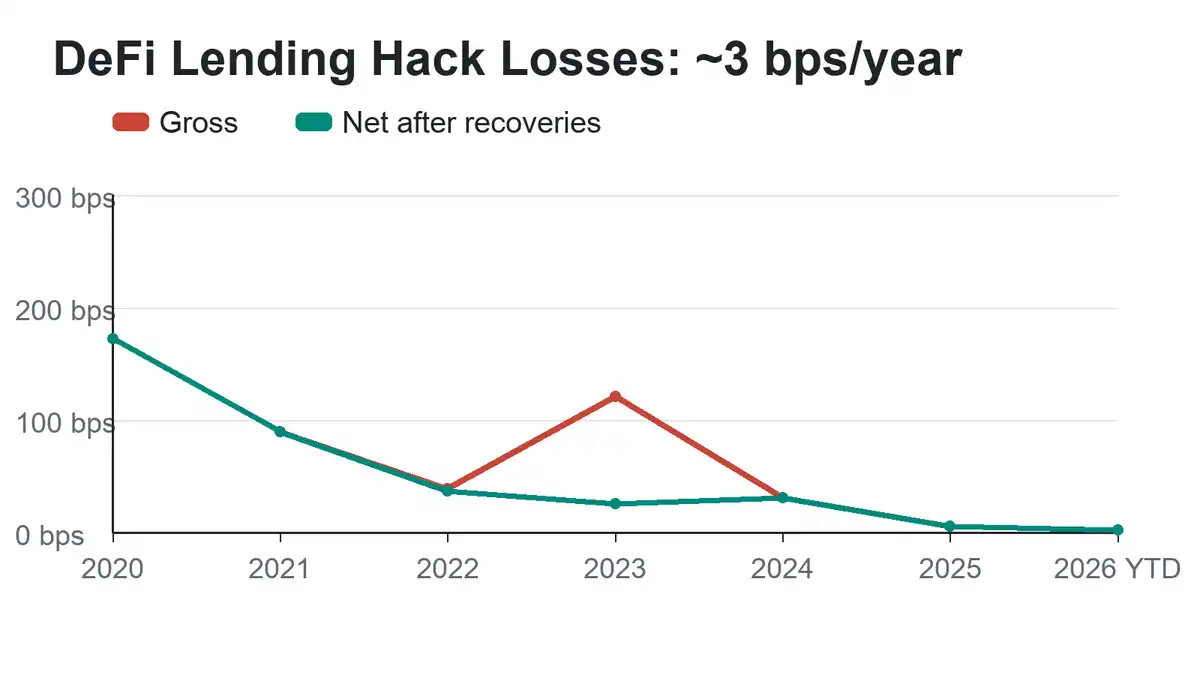
Euler even set a classic risk handling case by successfully recovering all stolen assets. In 2023, Euler was hacked for $197 million, not only fully recovered but also ended up with $240 million due to asset price fluctuations, achieving a positive surplus. This also widened the gap between book losses and actual recovery amounts in the industry.

Taking May 16, 2026 as the cut-off point and summarizing data from the past year:

  • Total book loss from thefts in non-cross-chain lending businesses on EVM and Solana: $30.9 million
  • Actual net loss after deducting asset recoveries: $30.1 million
  • Average daily locked capital size in the lending sector: $99.6 billion
  • Book fund loss rate: 3.1 basis points
  • Actual net loss rate: 3 basis points

Converted, the annual capital loss remains stable at about 0.03% of the total lending TVL.

Advantages of Asset Diversification

DeFi security incidents show a clear polarization characteristic: a very small number of extremely high-value theft incidents account for the vast majority of the industry's publicly disclosed total losses. Charting the scale of incidents on a logarithmic scale reveals that the scale of various theft events roughly follows a log-normal distribution. Visually, the vast majority of security incidents result in relatively small losses, with high-value thefts concentrated in only a few extreme cases.

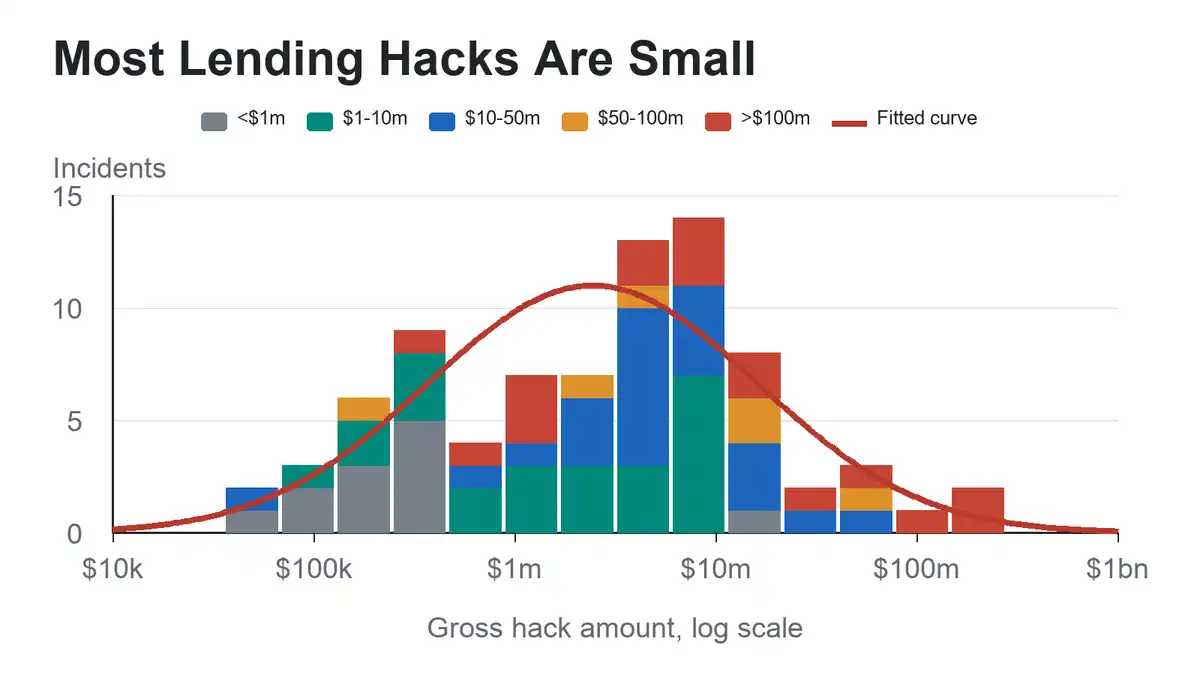
Although ChatGPT expressed a different opinion, I believe this data strongly proves that portfolio diversification is an excellent method to prevent crime.

From the perspective of risk transfer and commercial insurance, this data model also provides reasonable support for industry security insurance businesses. Insurance institutions can set single-claim limits for different protocols and conduct underwriting business in an orderly manner.

Furthermore, the vast majority of theft incidents have limited impact, far from enough to shake the entire capital pool of the lending sector. Moreover, the larger the overall size of the sector, the smaller the impact a single security event has on the whole.

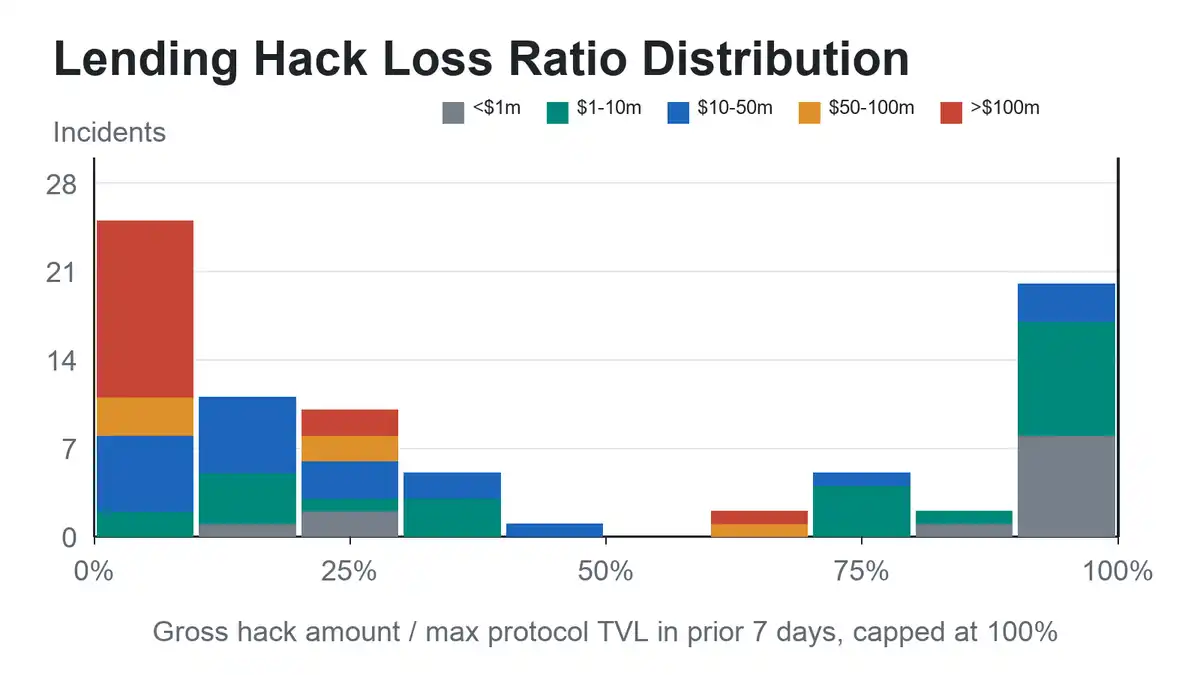
Note: For some theft incidents where the loss amount appears to exceed the project's own TVL, such cases are uniformly counted as 100% loss. There are two main reasons for this data discrepancy: first, there is a time lag between the TVL statistics time and the security incident occurrence time, causing asset volumes to change; second, DeFi Llama's TVL statistical scope is inconsistent with the actual standards for assets at risk exposure.

Although this measurement method is not absolutely perfect, it clearly reflects the industry's current state: the vast majority of vulnerability attacks only affect a single business module within a lending protocol; it is extremely rare for the entire asset pool to be compromised, especially for large-scale leading projects. This research data also provides key basis for DeFi industry risk hedging and asset security custody businesses.

Asset Recovery Capability is Crucial

Asset recovery has also greatly optimized the actual risk performance of the DeFi lending sector. Based on DeFi Llama's all-category DeFi theft data, the overall industry asset recovery amount accounts for about 8% of the total book loss. However, after excluding cross-chain bridge incidents, the asset recovery ratio for the EVM and Solana lending sector is even higher, reaching about 20% of the book loss.

Asset recovery success rates are generally higher for theft cases occurring in regions with well-established legal systems and mature regulatory governance. This phenomenon also hints at industry insights related to access permissions.

Positive Industry Outlook

Today, the security risks in the DeFi lending sector have become quantifiable and classifiable, with the actual fund loss ratio continuously declining. Data proves the industry has entered a mature development stage: actual vulnerability theft losses are extremely low relative to the sector's massive existing capital, various risks are clearly identifiable, and risk boundaries are increasingly transparent.

In conclusion, there's no need to be swayed by external bearish rhetoric; data and facts are sufficient to confirm the true risk level of the DeFi lending sector.

Perguntas relacionadas

QWhat is the annual estimated loss rate due to theft and malicious attacks in EVM and Solana DeFi lending, excluding cross-chain bridge incidents, according to the article?

AThe annual estimated loss rate is about 0.03% of the total value locked (TVL) in DeFi lending on EVM and Solana, excluding cross-chain bridge incidents.

QWhy are lending markets and AMMs highlighted as high-risk categories for security incidents in DeFi?

ALending markets and Automated Market Makers (AMMs) are high-risk because they require large amounts of assets to be pooled and locked in smart contracts, making them prime targets for hackers.

QWhat key improvement does the article mention regarding the handling of the Euler Finance hack in 2023?

AThe Euler Finance hack resulted in the successful full recovery of the stolen assets. Not only were the initial $197 million recovered, but price fluctuations led to the return of $240 million, creating a positive surplus.

QHow does the distribution of hack sizes in DeFi lending affect risk, according to the article's analysis?

AThe hack sizes follow an approximate log-normal distribution, meaning the vast majority of security incidents result in relatively small losses, with only a few extreme cases accounting for the largest portions of total losses. This supports the effectiveness of portfolio diversification as a risk mitigation strategy.

QWhat is the asset recovery rate for EVM and Solana lending sector hacks, excluding cross-chain bridge incidents?

AExcluding cross-chain bridge incidents, the asset recovery rate for hacks in the EVM and Solana lending sector is about 20% of the账面 (book value) losses.

Leituras Relacionadas

Interpreting Investment Opportunities in the Age of Great Navigation, Invesco Great Wall Fund Releases '2026 Report on Chinese Enterprises Going Global'

Invesco Great Wall Fund has released its "2026 China Corporate Globalization Report," titled "The 'Great Navigation Era' of Chinese Enterprises." The report analyzes the new trends and investment opportunities as Chinese companies expand globally, moving from simple product exports to comprehensive overseas operations involving services, branding, and local production. Driven by factors like trade friction, the pursuit of higher profit margins abroad, and policy support, globalization is becoming essential for Chinese companies. The report outlines an evolution: from early product export ("Globalization 1.0") to the current "Globalization 2.0," characterized by overseas capacity, capital goods investment, consumer brand expansion, and service exports. Chinese firms' competitive advantages are highlighted, including a vast engineer talent pool, low-cost and robust infrastructure, and complete industrial clusters. Specific sectors with significant出海 potential are identified: * **Capital Goods** (e.g., engineering machinery, power equipment): Benefiting from global demand, especially in Belt & Road markets and the AI-driven power grid upgrade cycle. * **Consumer Brands**: Transitioning from cost to brand advantage, leveraging供应链 efficiency. * **Technology & Innovation**: Including AI applications, optical modules within global tech supply chains, and new energy vehicles focusing on local production. * **Pharmaceuticals**: Chinese biotech firms are becoming preferred partners for global pharma, with potential for breakthrough drugs in areas like oncology and weight loss. The report concludes that corporate globalization represents a sustained, core theme for China's capital markets, though companies must navigate challenges like geopolitics and localization.

marsbitHá 8m

Interpreting Investment Opportunities in the Age of Great Navigation, Invesco Great Wall Fund Releases '2026 Report on Chinese Enterprises Going Global'

marsbitHá 8m

GitHub, Transfixed by AI

On the night of February 9th, GitHub suffered a major outage caused by a simple configuration change—reducing a cache refresh interval from 12 to 2 hours—that triggered a cascade of failures. This was not an isolated event, but part of a broader pattern. In early 2026, GitHub experienced at least 8 major incidents, failing to meet its promised 99.9% availability. These outages stemmed from structural issues: explosive growth in load, tight service coupling, and insufficient protection against abnormal traffic. This unprecedented load is driven by AI Agents. In 2025, GitHub handled ~1 billion commits. By 2026, weekly commits reached 275 million, projecting to ~14 billion for the year—a 14x increase. AI tools like Claude Code now contribute 4.5% of all public repository commits, with weekly submissions surging 25x in just three months. AI-generated pull requests jumped from 4 million to 17 million per month in half a year. Unlike human developers, AI Agents work continuously, generating commits at a scale that overwhelms infrastructure designed for human rhythms. The surge also shattered GitHub's business model. Copilot's flat-rate pricing, based on assisting human developers, became unsustainable as Agentic AI sessions consumed resources worth hundreds of dollars for a few dollars in fees. In response, GitHub imposed usage limits and, by June 1st, shifted to a pay-per-use "AI Credits" system. Facing this new reality, GitHub realized a 10x scaling plan was insufficient. It announced a need to *redesign* its architecture for 30x current scale—decoupling services, adding fault isolation, and improving change management to prevent cascading failures. Other platforms like Stripe and AWS are facing similar challenges with AI Agents. Fundamentally, GitHub is transitioning from a human collaboration platform to an "exhaust pipe" for automated AI workflows. Its detailed post-mortem reports aim to maintain trust during this turbulent rebuild. The February outage was not just a technical glitch, but a signal of the software industry's entry into a new, AI-driven era.

marsbitHá 48m

GitHub, Transfixed by AI

marsbitHá 48m

Both Suffer Massive Losses Exceeding $90 Billion, Which Is in Greater Peril: Strategy or Bitmine?

Facing massive paper losses exceeding $90 billion each amidst a sharp market downturn, "Digital Asset Treasury" (DAT) giants Strategy and Bitmine find themselves in a precarious position, but with different underlying risks. Strategy, heavily invested in Bitcoin (BTC), faces significant financial strain. Its strategy relies heavily on debt, including convertible notes and preferred stock (STRC) requiring substantial dividend payments. With its cash reserves dwindling and BTC offering no staking yield for cash flow, Strategy's high leverage makes it vulnerable. A continued price decline could force asset sales to meet obligations, potentially creating a negative feedback loop. Its market value has already fallen sharply. In contrast, Bitmine, an Ethereum (ETH) holder, appears on firmer financial ground. It primarily funds its purchases through equity offerings (like ATM programs), avoiding debt pressure. It also generates income by staking a large portion of its ETH holdings. While not immune to market drops and shareholder dilution concerns, Bitmine maintains more flexibility, recently announcing a new preferred share offering to raise further capital. The core divergence lies in their financing: Bitmine uses equity (investor money), while Strategy uses debt (borrowed money). Consequently, Bitmine currently faces less immediate liquidity pressure than Strategy, which must navigate the dual challenge of servicing debt/dividends and a declining core asset (BTC) price.

marsbitHá 55m

Both Suffer Massive Losses Exceeding $90 Billion, Which Is in Greater Peril: Strategy or Bitmine?

marsbitHá 55m

Trading

Spot
Futuros
活动图片