Aggregate Analysis Beyond Price: Glassnode Global Metrics

insights.glassnodePublicado em 2026-06-03Última atualização em 2026-06-03

Resumo

Glassnode Global Metrics introduce a suite of aggregated on-chain and market metrics designed to analyze the dynamic crypto market without the distortions caused by asset reclassifications. The framework offers two data types: Raw Aggregates (original units) and scaled, base-100 Indices for continuous trend analysis. The article demonstrates the power of these indices through three examples. First, they reveal a dramatic 2024 small-cap rally invisible in raw data, where "winner" assets leaving the basket bias the raw series. Second, they provide a clearer view of profit-taking sentiment across market-cap cohorts, showing that small-cap holder sentiment is more stable than raw SOPR data suggests. Third, they isolate leverage behavior in derivatives, highlighting the higher volatility of open interest in mid- and small-cap assets during speculative phases. Currently live metrics include Total Market Cap, Median SOPR, Total Open Interest, and others, calculated for All Coins, Large, Mid, and Small Cap baskets with weekly rebalancing. The data is accessible via dedicated API endpoints for both raw and indexed series, bringing the continuity of traditional finance indices to multi-asset crypto analytics.

Aggregate market analysis has become a challenge since the digital asset space has fragmented into thousands of assets, sectors, and rapidly changing market-cap cohorts. As assets appreciate, decline, launch, or disappear, aggregate metric series develop structural discontinuities that make long-term analysis difficult.

Previously, we showcased the power of global views that aggregate metrics across the market using our Multi-Asset Explorer. We have now extended this framework with Glassnode Global Metrics — a suite of formally rebalanced aggregate metrics with continuous index normalization, available via API.

In this article, we introduce the framework, examine several examples across market capitalization, profitability, and derivatives positioning, and show what continuity-adjusted indices reveal relative to raw aggregates.

What are Glassnode Global Metrics?

Global Metrics are aggregated on-chain and market metrics computed across multiple cryptocurrencies, organized into configurable baskets. Baskets can be defined by market capitalization thresholds, top-N rankings (by any metric), or asset tags (sectors, categories). They solve a fundamental challenge in crypto analytics: how to track on-chain and market metrics across a highly dynamic group of assets over time without artificial discontinuities caused by basket composition changes, in contrast to indices that focus on price alone.

We provide two output types for each metric:

  • Raw Aggregates: True values in original units preserving economic meaning (e.g., USD for market cap, counts for active addresses)
  • Indices: Scaling-factor-adjusted, base-normalized time series for trend analysis and cross-basket comparison

What the indices reveal

Market structure: the 2024 small-cap surge

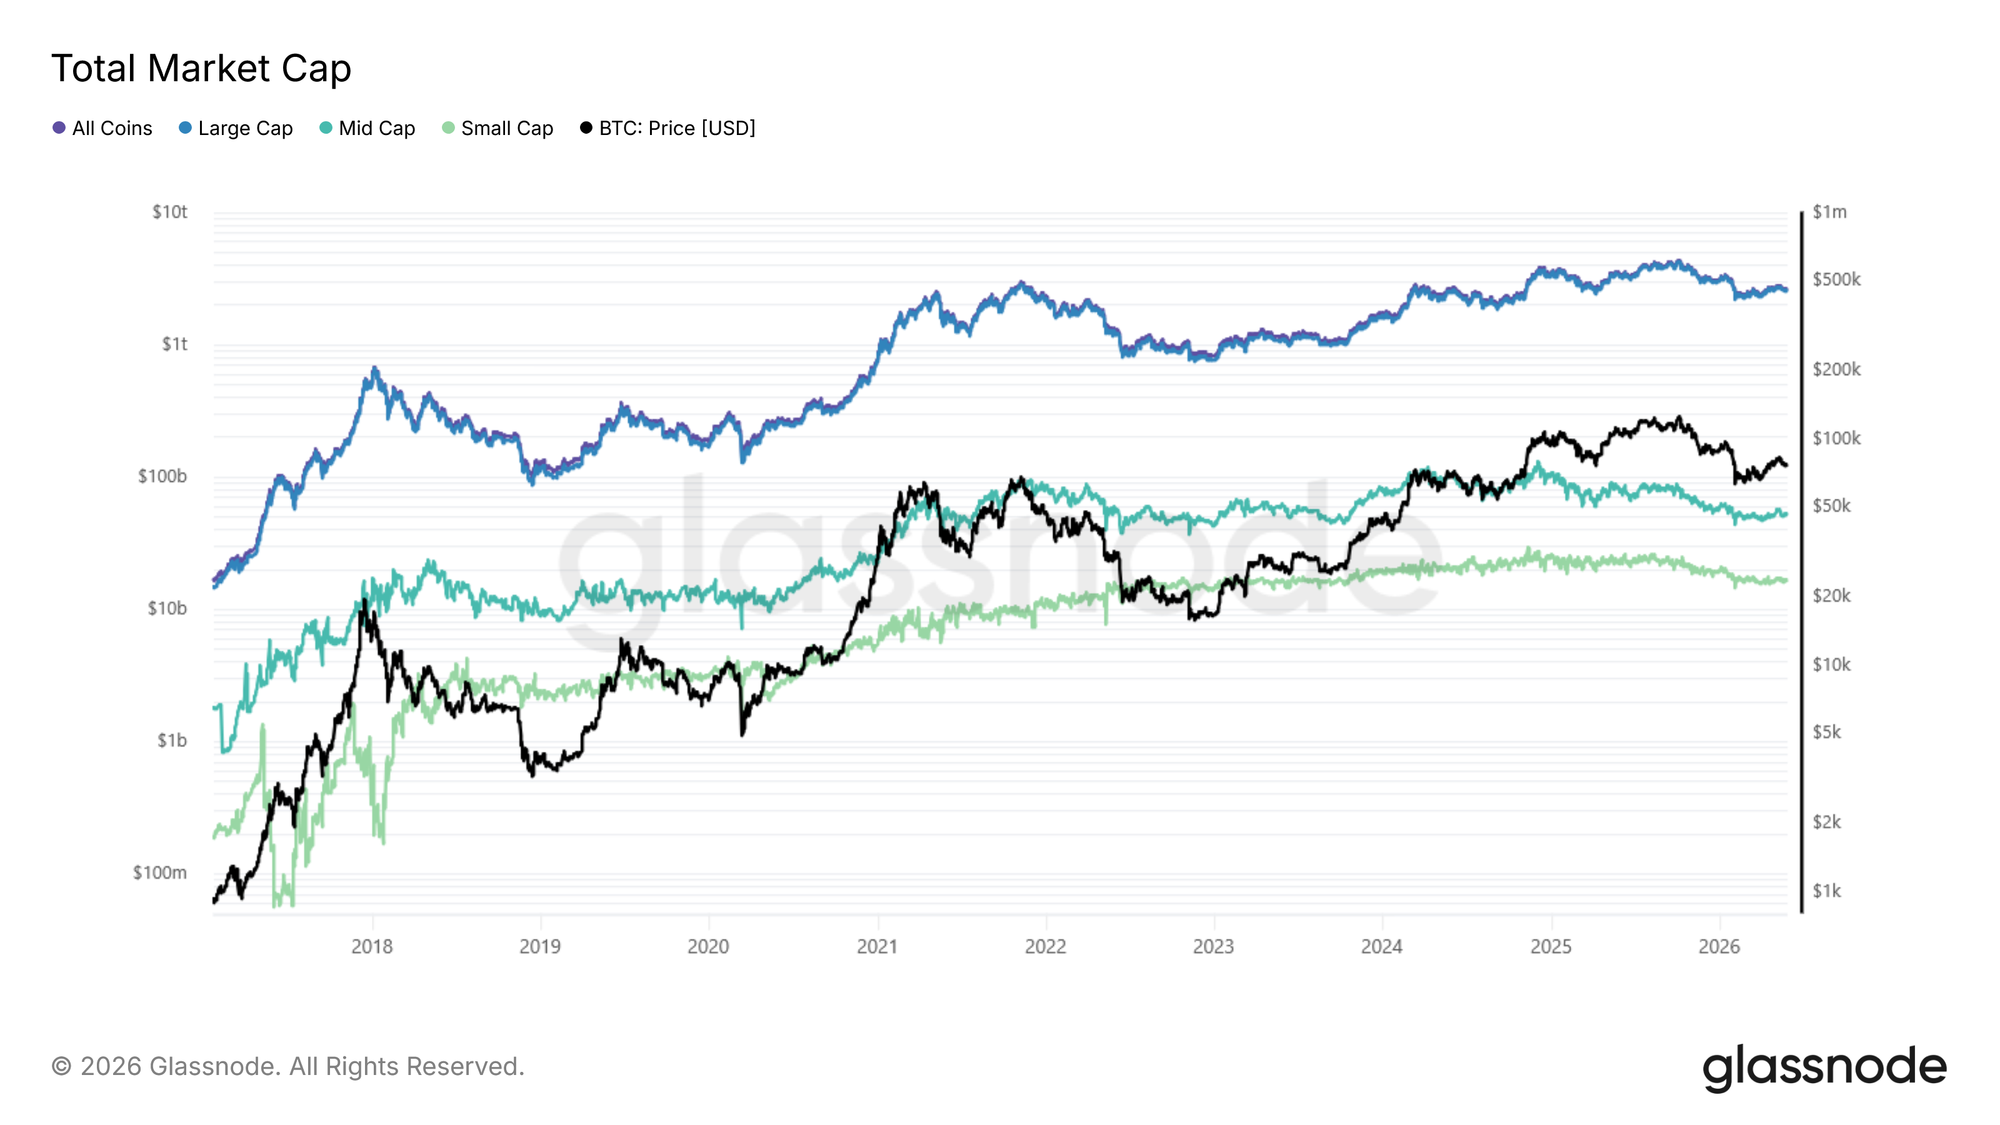
The clearest demonstration of why continuity-adjusted indices matter is the small-cap tier in 2024. The below figure presents Total Market Cap: Raw aggregate (USD, log scale) across all four baskets: All Coins, Large, Mid and Small Cap, with BTC price overlaid.
View Live Metric

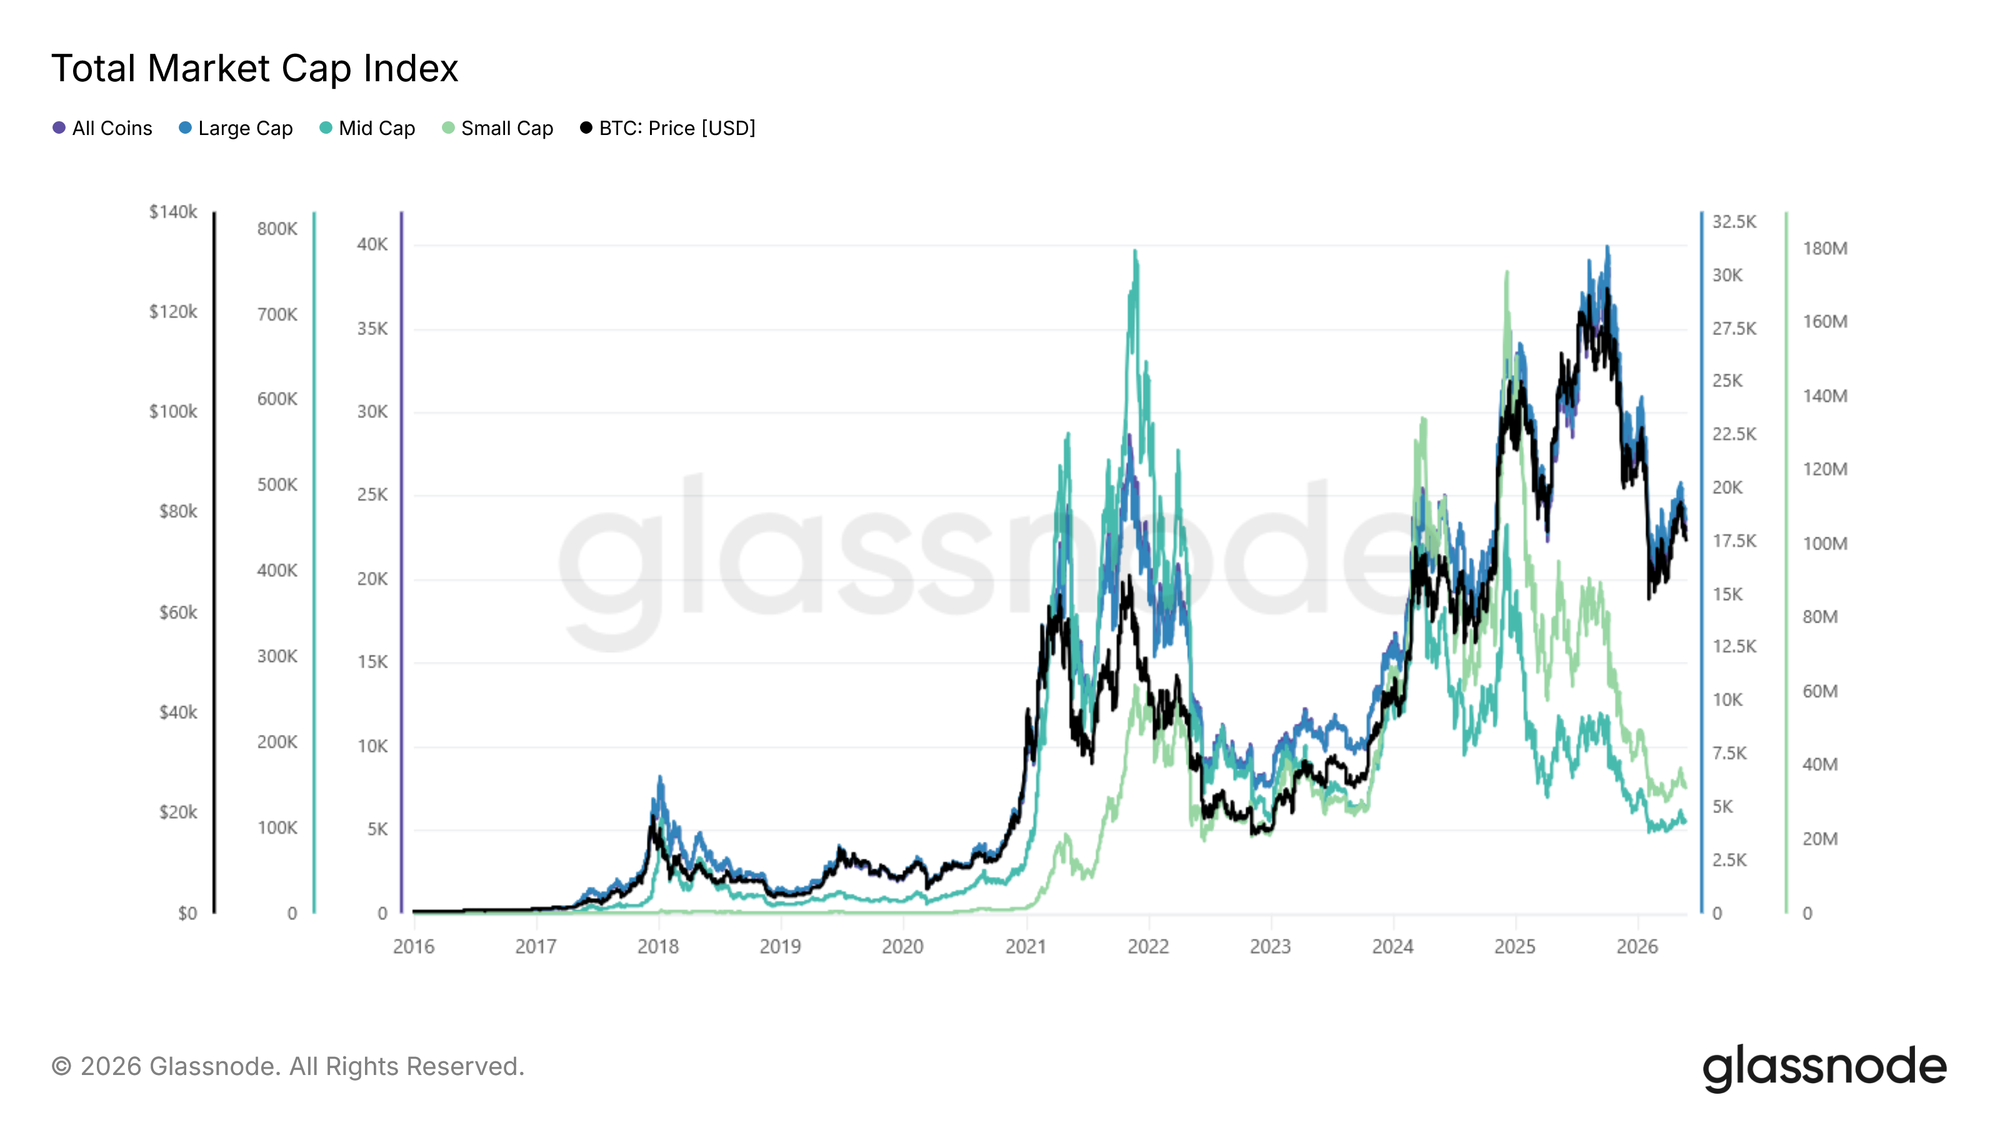
Compare to the Total Market Cap Index: scaled index (base 100) across the same four baskets. Each tier starts at 100, hence the lines are directly comparable as growth multiples.
View Live Metric

The raw small-cap series contains a structural bias: whenever a small-cap asset performs well, it eventually crosses the $100M threshold and leaves the basket, taking its gains with it. In other words, "winners leave". The raw aggregate is, by design, incapable of capturing a small-cap rally.

The index neutralizes this effect. Small-cap shot up dramatically in 2024, a move largely invisible in the raw series, driven by near-instant token creation platforms and the memecoin mania that followed.

The same chart also highlights the divergence across tiers: while large caps held up relatively well, altcoin tiers entered a prolonged drawdown. Both halves only become legible in the index.

Profit-taking Sentiment: Altcoin SOPR vs BTC SOPR

Spent Output Profit Ratio (SOPR), which measures whether coins moving on-chain are being spent at a profit (above 1) or a loss (below 1), is one of the clearest cases where a global metric adds value beyond the single-asset version. BTC SOPR and the median SOPR across altcoin baskets frequently diverge, and the spread between them becomes a signal in itself.

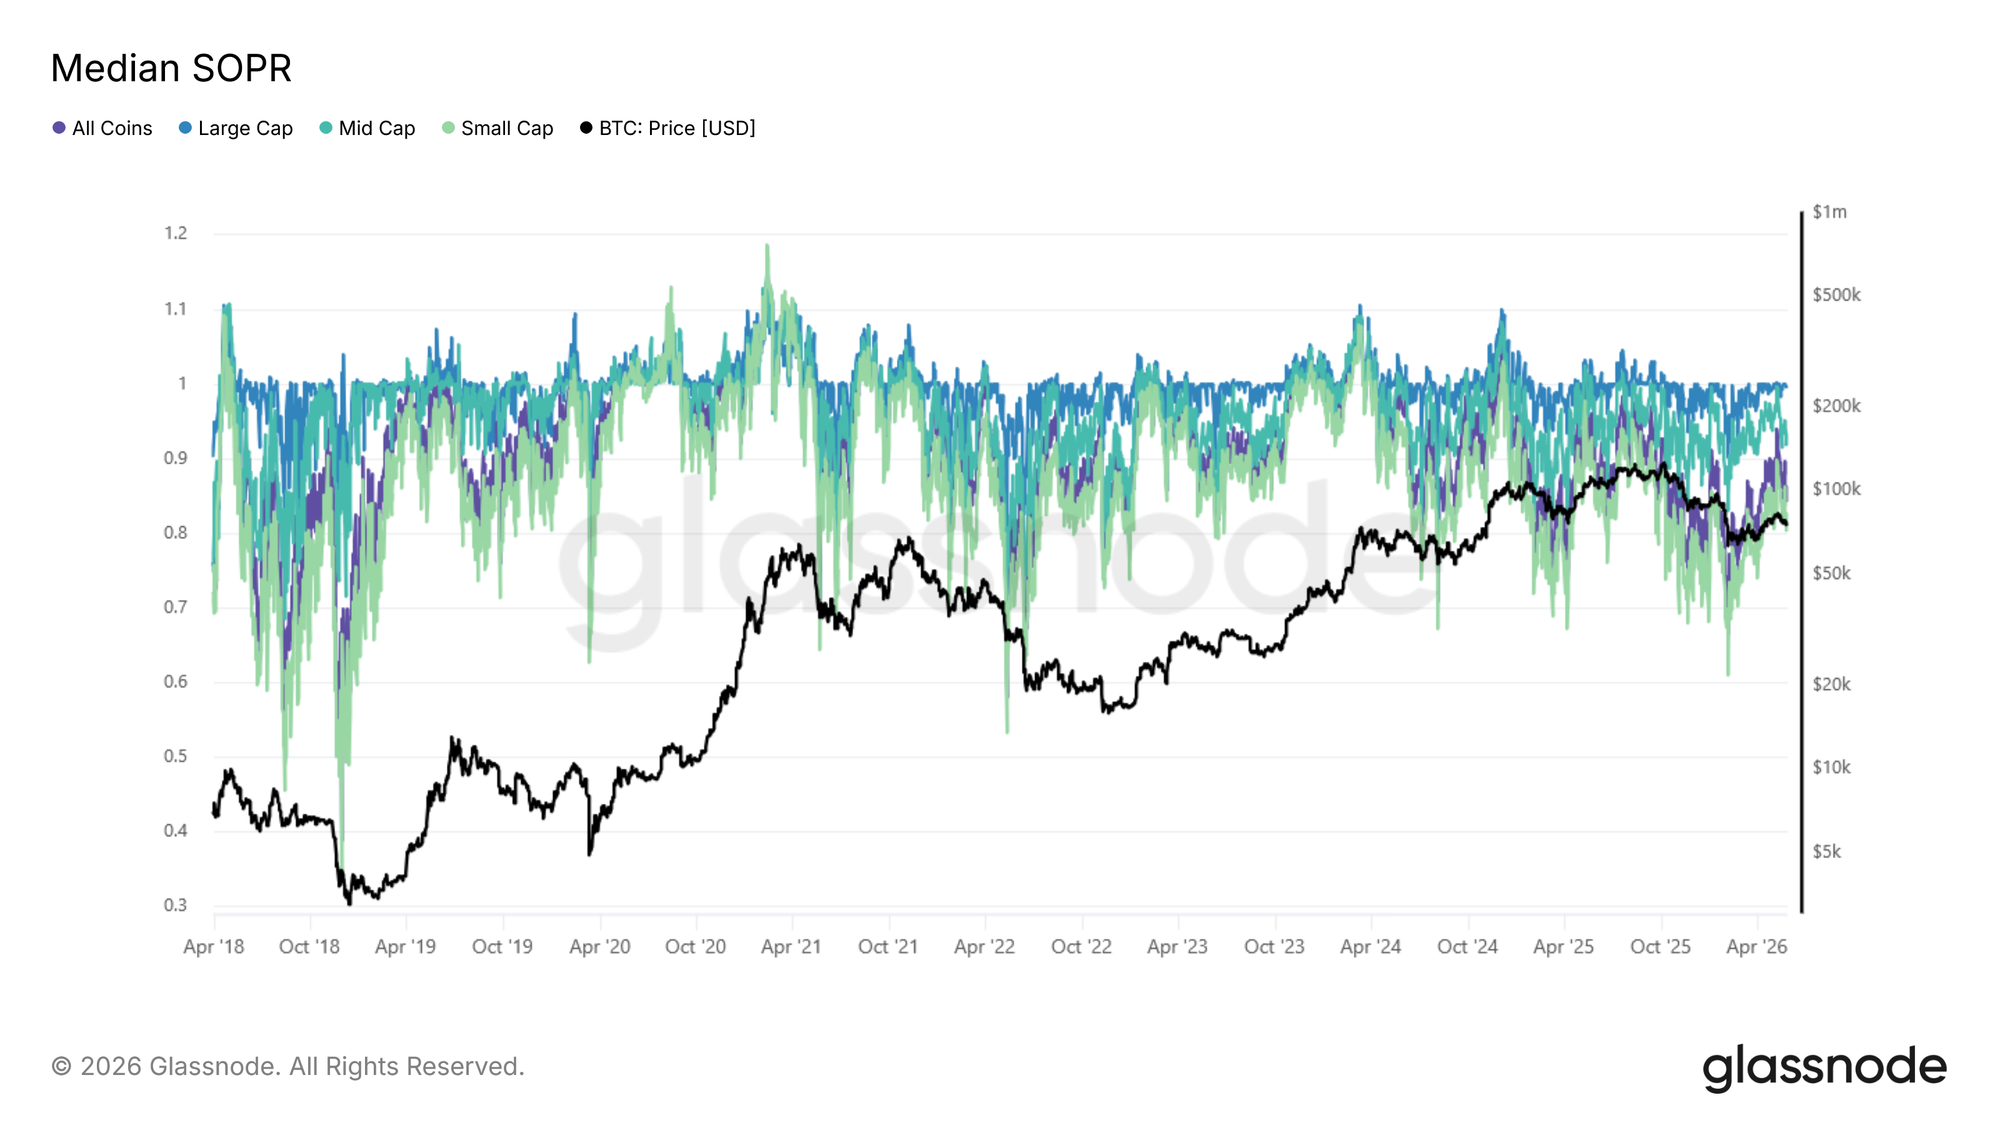
The following figure shows Median SOPR: Raw aggregate across all four baskets, BTC price overlaid. SOPR oscillates around 1.
View Live Metric

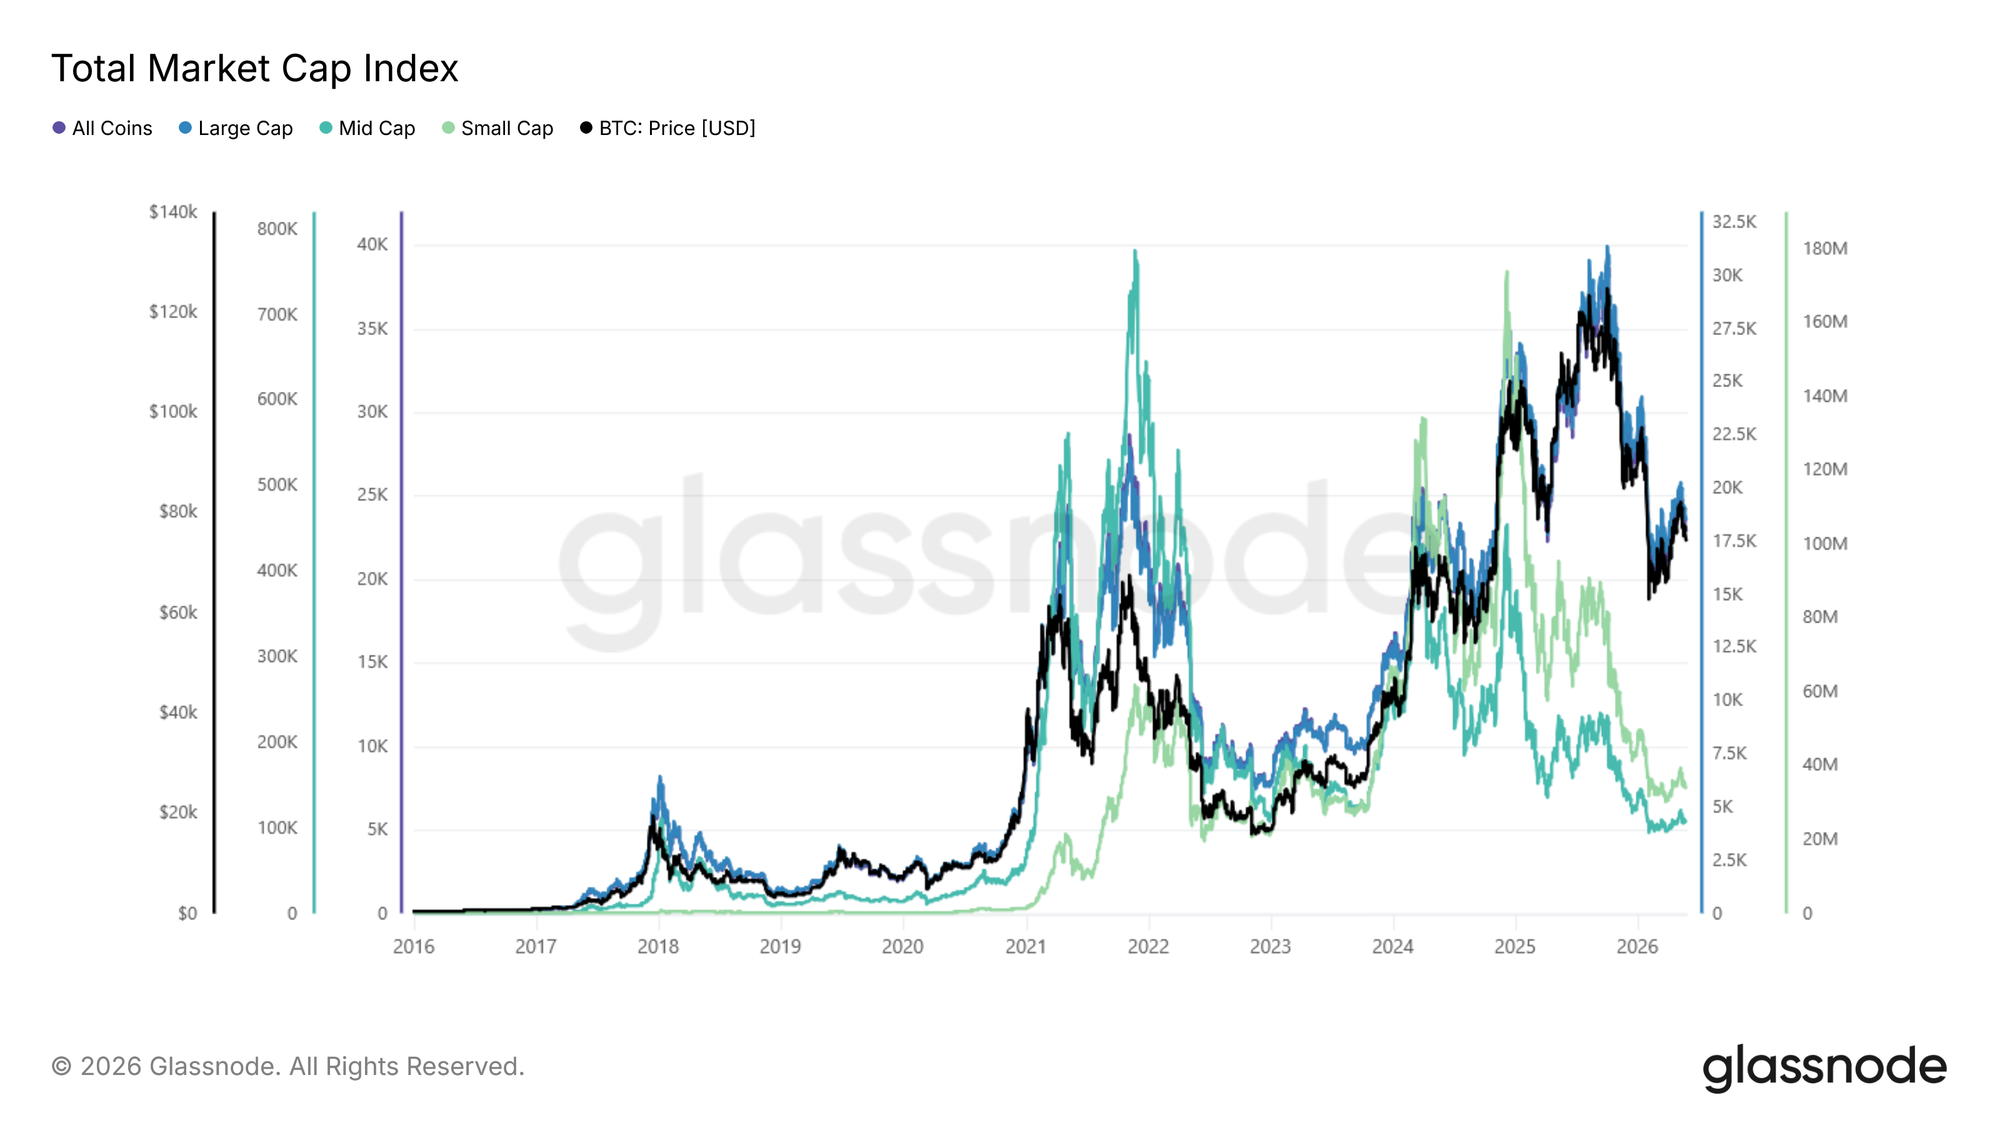
Compare to the Median SOPR: scaled index (base 100), across the same four baskets.
View Live Metric

The raw series tells the following story: small-cap SOPR crashes to levels comparable to the 2018 and 2022 bear markets, while large and mid caps have held up better in recent cycles. The index adds an additional nuance: because appreciated small-cap coins keep leaving the basket as they grow into higher tiers, the raw series overstates how bad sentiment is for the assets that actually remain.

Adjusted for this, small-cap sentiment is more stable than it appears. For large and mid caps no such correction applies, and what the index reveals is a genuine long-term trend: each cycle, the average holder in established assets extracts slightly less profit than the one before. As more supply locks into long-term holding, less of it cycles through at a profit.

Rather than relying on selected tokens as proxies for altcoin sentiment, the global SOPR index provides a cohort-level read directly. No need to cherry-pick individual tokens.

Derivatives Positioning: Open Interest

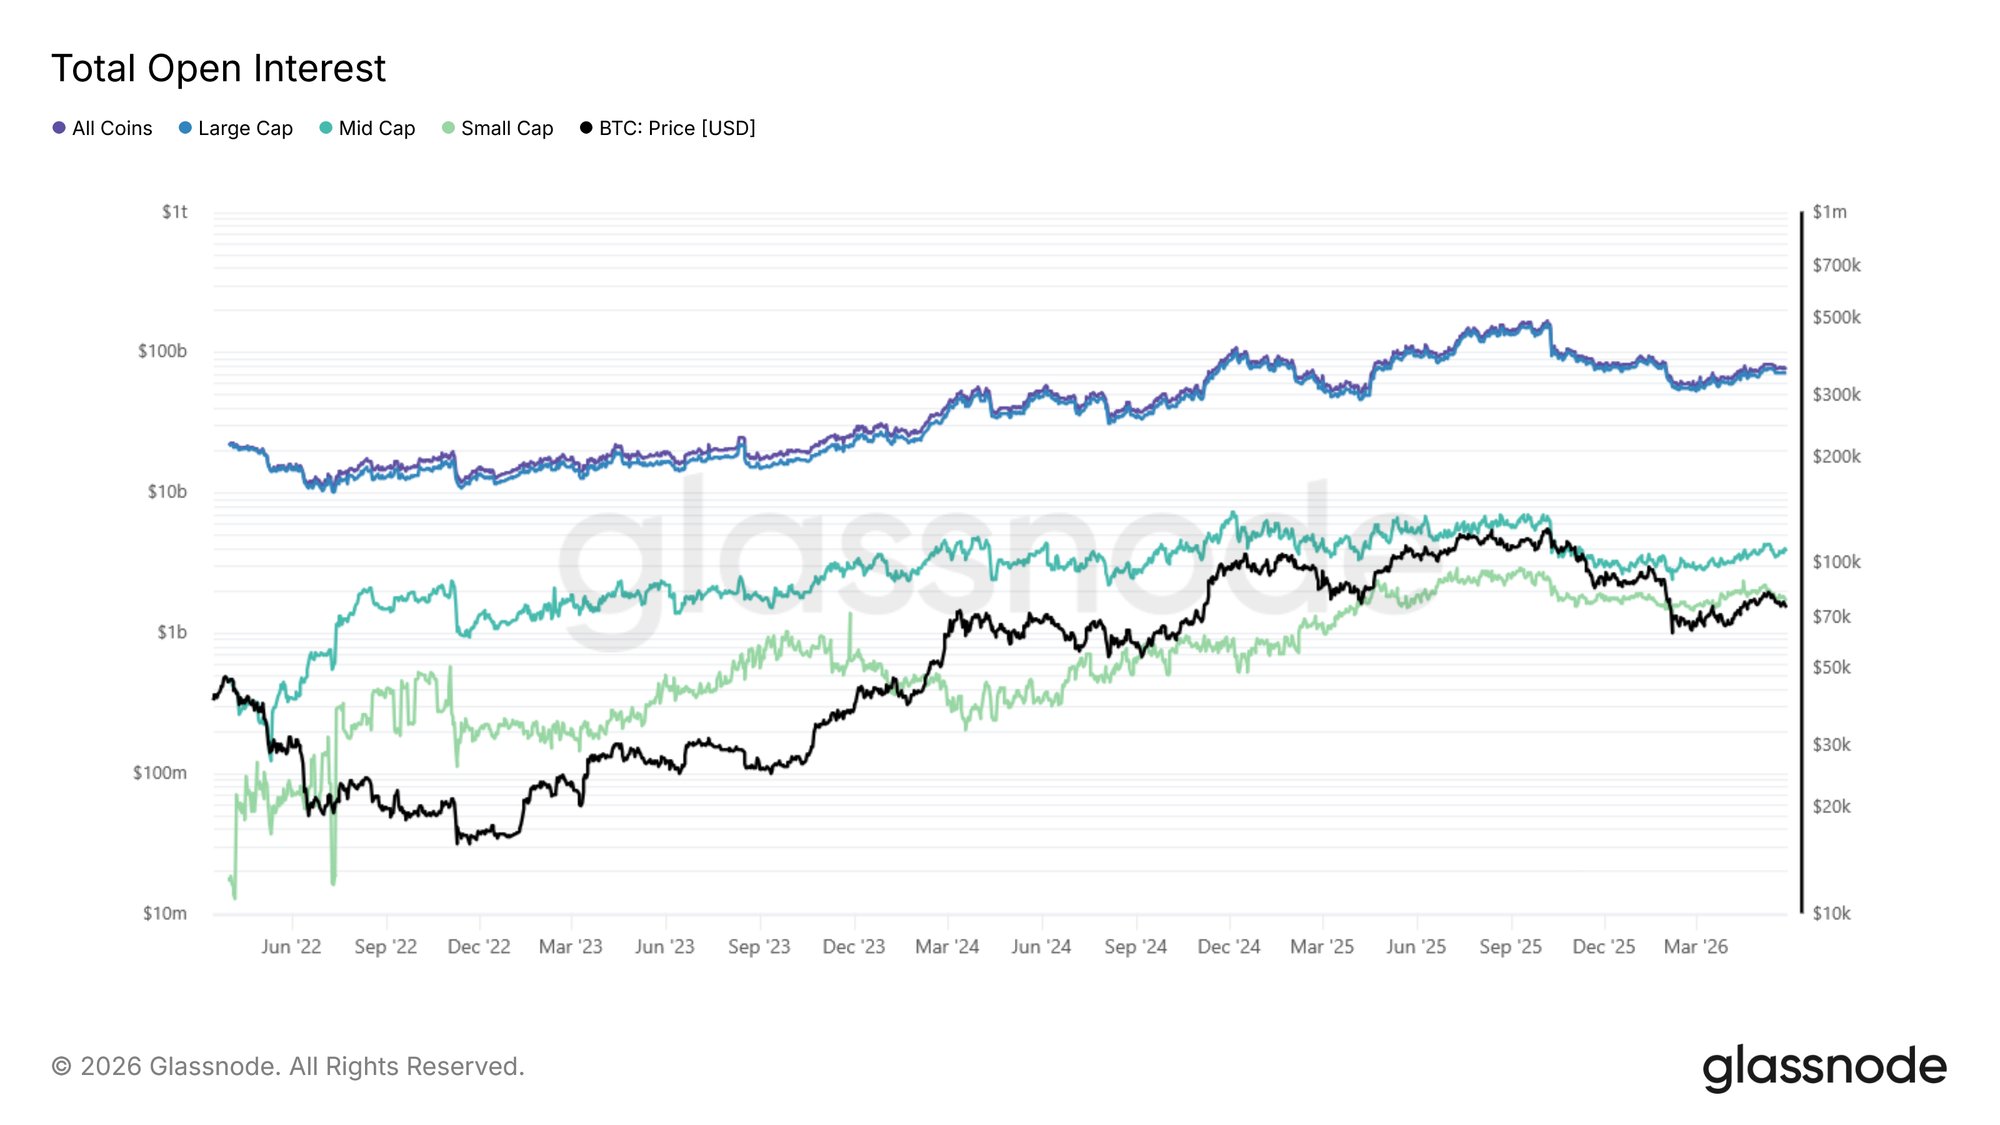
Open Interest (OI) measures the total value of outstanding perpetual futures contracts and provides a useful proxy for leverage concentration across the market.

The below figure presents Total Open Interest: Raw aggregate (USD, log scale) across all four baskets, data from 2022.
View Live Metric

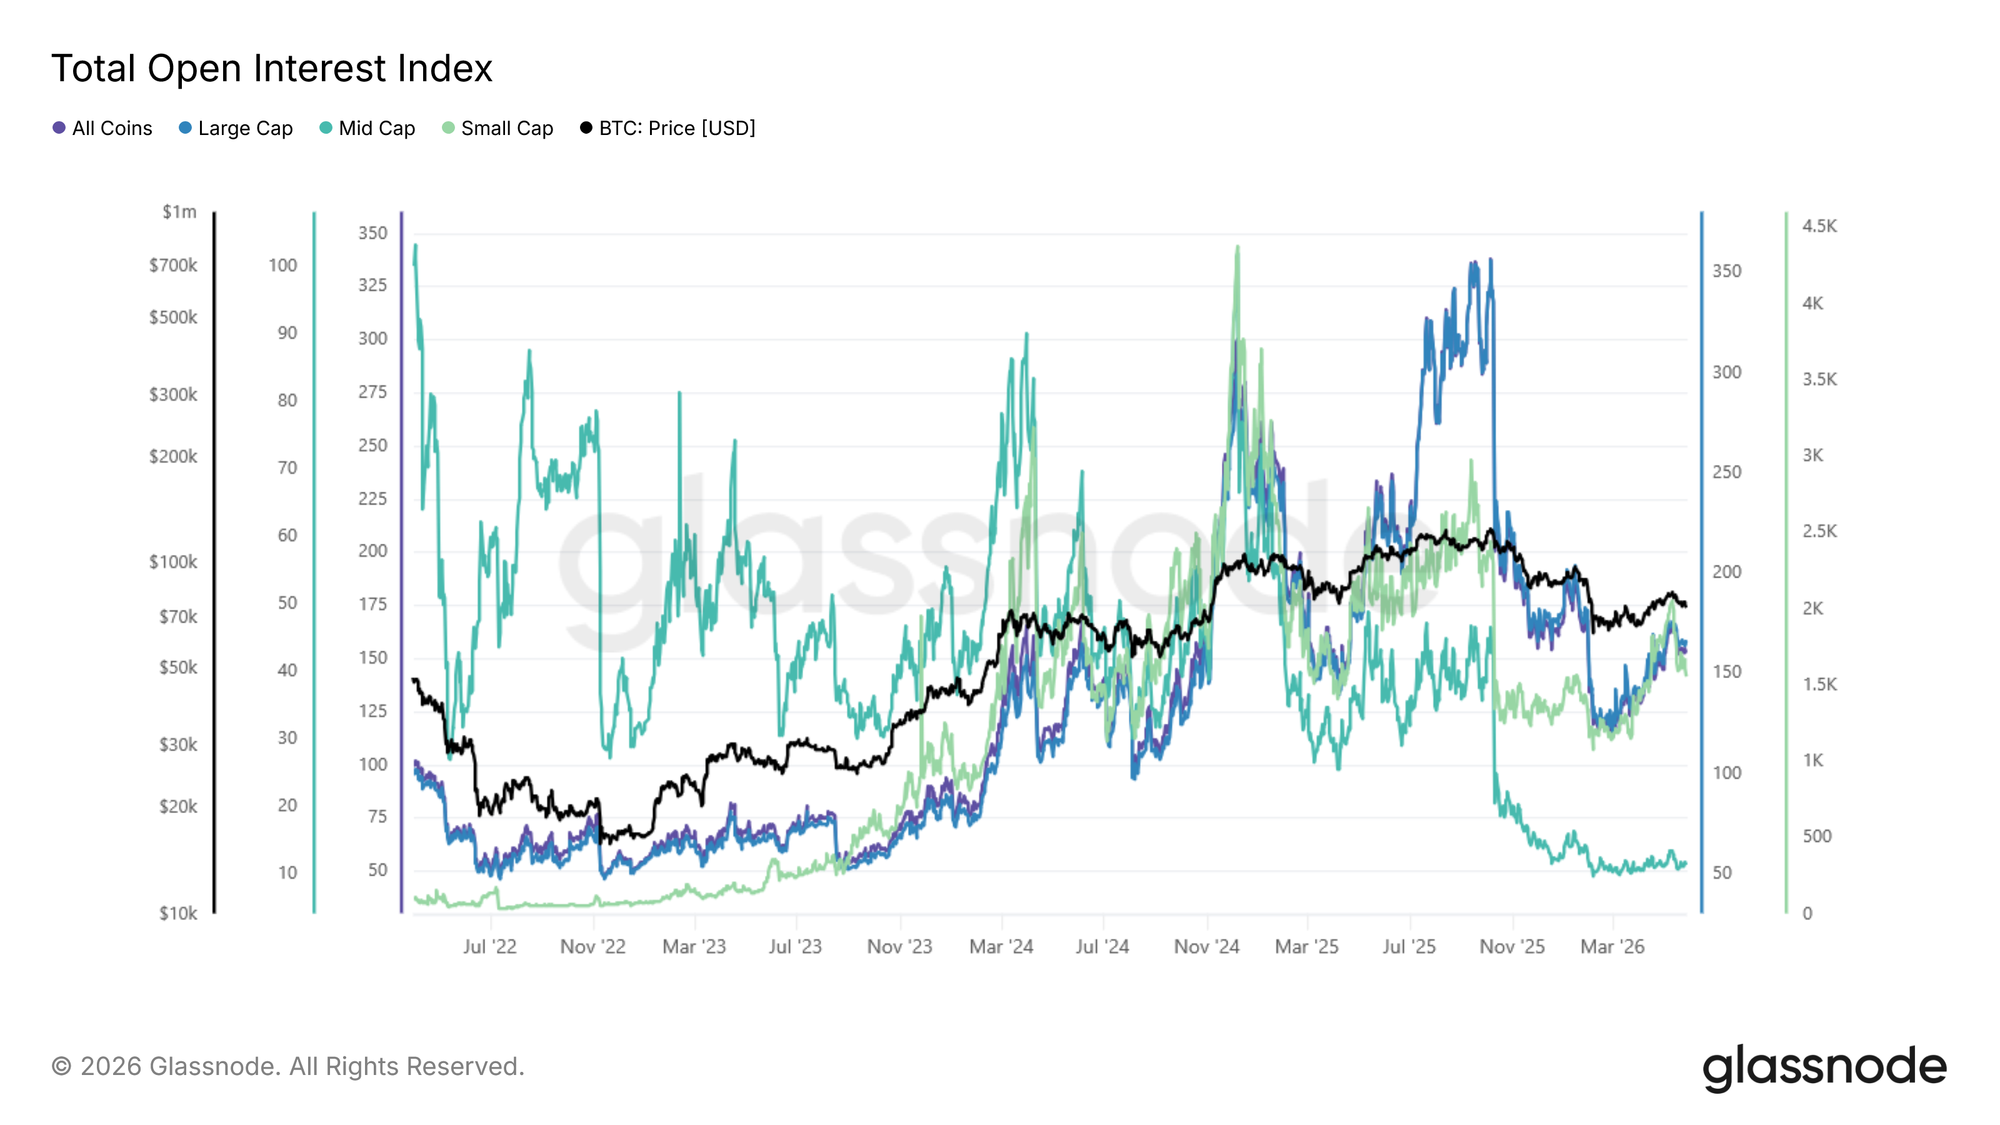
Compare to the Total Open Interest Index: scaled (base 100) across the same four baskets.
View Live Metric

Large cap dominates open interest in absolute terms; most leverage sits on the biggest, most liquid assets. The index, however, makes the behavior of the smaller tiers comparable: mid- and small-cap open interest is far more volatile, spiking sharply during speculative episodes and unwinding just as fast. These spikes are a useful early-warning signal for cascade risk in the more fragile parts of the market.

The continuity-adjusted framework makes these shifts easier to isolate by separating changes in leverage behavior from changes in cohort composition.

The Glassnode Global Metric Suite

Four metrics are live with this release, each computed for all four baskets, sixteen time series in total. All use weekly rebalancing and equal weighting.
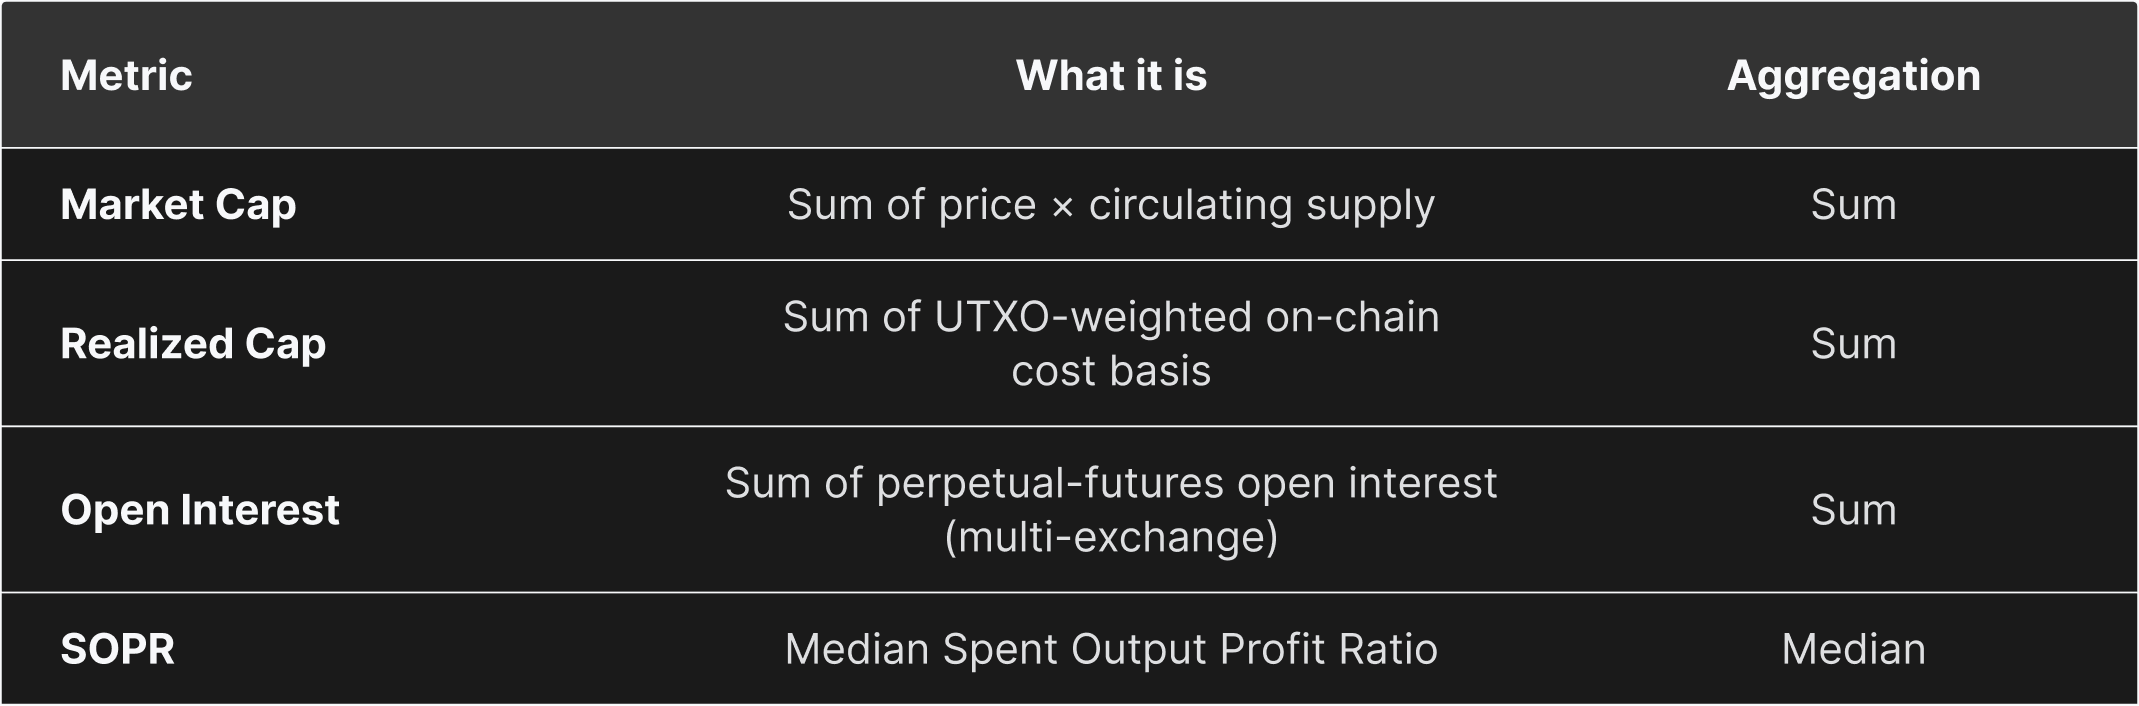
The baskets are the market-cap tiers used throughout this paper:

  • All Coins (no filter)
  • Large Cap (≥$1B)
  • Mid Cap ($100M–$1B)
  • Small Cap (<$100M).

Eligibility filtering, start dates, and the choice of sum versus median aggregation are covered in the appendix.

Accessing the Data via API

Each metric is published in two forms. 1) The raw aggregate preserves the original units (discontinuous at rebalances) and is intended to use for absolute sizing and point-in-time snapshots. 2) The index is scaled, base-100, and continuous, making it more suitable for trend analysis and cross-basket comparison.

Raw and index versions are served from separate endpoints, and each endpoint returns all baskets for that metric:

https://api.glassnode.com/v1/metrics/global/{metric}_{aggregation}_{rebalancing}_{weighting}_raw
https://api.glassnode.com/v1/metrics/global/{metric}_{aggregation}_{rebalancing}_{weighting}_index
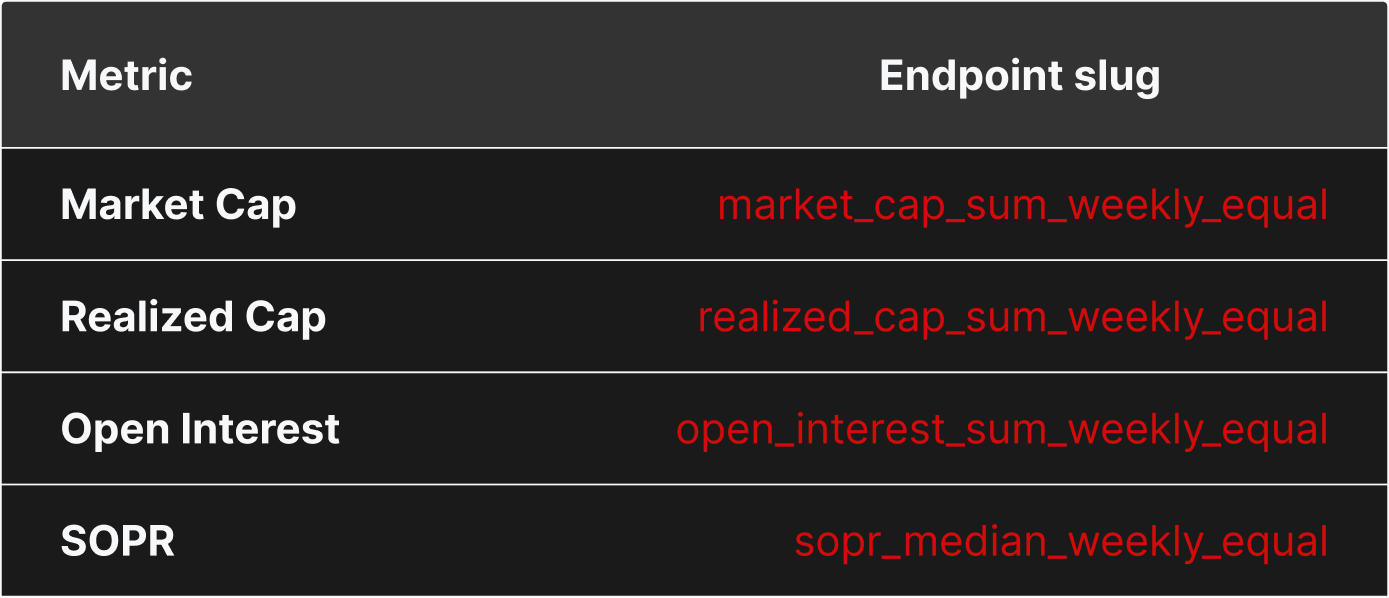
For full request details, please see the Glassnode API documentation. The framework is extensible (additional metrics, alternative weightings, and tag-based sector baskets are planned), but the four metrics above are live today, and they already bring the continuity discipline of traditional price indices to on-chain and market data for a market that is increasingly multi-asset.

Methodology

Full details on basket selection, eligibility filtering, scaling-factor formulas, and index normalization, please reach out to your account manager for access.


  • Follow us on X for timely market updates and analysis
  • Join our Telegram channel for regular market insights
  • For on-chain metrics, dashboards, and alerts, visit Glassnode Studio

Disclaimer: This report is for informational and educational purposes only. The analysis represents a limited case study with significant constraints and should not be interpreted as investment advice or definitive trading signals. Past performance patterns do not guarantee future results. Always conduct thorough due diligence and consider multiple factors before making investment decisions.


Perguntas relacionadas

QWhat is the core challenge that Glassnode Global Metrics aim to solve in crypto analytics?

AGlassnode Global Metrics aim to solve the fundamental challenge of tracking on-chain and market metrics across a highly dynamic group of assets over time without artificial discontinuities caused by basket composition changes. This is in contrast to indices that focus solely on price.

QExplain the key difference between the 'Raw Aggregates' and 'Indices' provided by Glassnode Global Metrics.

AThe 'Raw Aggregates' provide true values in original units (e.g., USD for market cap), preserving economic meaning but potentially containing structural discontinuities. The 'Indices' are scaling-factor-adjusted, base-normalized (to 100) time series designed for continuous trend analysis and cross-basket comparison, as they neutralize the effect of assets entering or leaving the basket.

QUsing the 2024 small-cap market cap example from the article, why does the raw aggregate series fail to capture a genuine small-cap rally, and how does the index correct for this?

AThe raw small-cap market cap series suffers from a 'winners leave' structural bias. When a small-cap asset appreciates and crosses the $100M threshold, it leaves the small-cap basket, taking its gains with it. Therefore, the raw aggregate cannot capture sustained gains. The index corrects for this by applying a continuity adjustment that neutralizes the effect of composition changes, allowing the true performance of the small-cap tier to be visible.

QAccording to the analysis of the Median SOPR (Spent Output Profit Ratio) index, what long-term trend does it reveal for large and mid-cap assets?

AThe analysis of the Median SOPR index reveals a genuine long-term trend for large and mid-cap assets: in each market cycle, the average holder in these established assets extracts slightly less profit than in the cycle before. This is attributed to more supply being locked into long-term holding, resulting in less of it cycling through at a profit.

QHow does the Global Open Interest index help identify risk, particularly for smaller market cap tiers?

AThe Global Open Interest index helps identify risk by making the *behavior* of different market cap tiers comparable. It shows that open interest for mid- and small-cap assets is far more volatile than for large caps, spiking sharply during speculative episodes and unwinding rapidly. These spikes serve as an early-warning signal for cascade risk in the more fragile, less liquid parts of the market.

Leituras Relacionadas

7 Months After the Collapse of Huiwang, Southeast Asia's Escrow Platforms Undergo a Major Reshuffle

Following the collapse of Huione Pay—dubbed the "Alipay of Southeast Asia"—seven months ago, the region's underground financial guarantee platform sector is undergoing a significant reshuffle. This power vacuum has been swiftly filled by emerging platforms such as XinBi, Tiger/Navigator, JinBei (renamed JinBo), Dali/Tiancheng, and FullyLight. These platforms, operating largely via Telegram and offering services like escrow for illicit transactions, have absorbed the vast user base and markets left behind by Huione. While positioning themselves as "trust intermediaries," their primary clientele consists of networks involved in online scams, money laundering, illegal gambling, and even human trafficking. For instance, the Tiger/Navigator platform explicitly provides "escrow" services for kidnapping-for-ransom operations ("强押车交易"). Data underscores the immense scale: Huione alone processed over $103 billion in cryptocurrency payments and facilitated over $31 billion through its escrow market before its downfall, linking it to Cambodia's notorious Prince Group. Since its collapse, competitors have seen explosive growth. For example, the XinBi platform has accumulated over $1.6 billion in total USDT revenue, while platforms like NewPay, OkPay (under Dali), and FullyLight Wallet collectively processed over $4.8 billion in USDT in a single year. This ecosystem thrives in regions like Cambodia and Myanmar, where regulatory gaps allow these platforms to act as critical financial infrastructure for sprawling cybercrime industries, from scam compounds to online casinos. The article concludes that the moniker "Southeast Asian Alipay" is a misnomer, obscuring the platforms' fundamental role in enabling serious criminal enterprises rather than representing legitimate financial innovation.

Odaily星球日报Há 55m

7 Months After the Collapse of Huiwang, Southeast Asia's Escrow Platforms Undergo a Major Reshuffle

Odaily星球日报Há 55m

The Changing Landscape: What Are Crypto VCs Experiencing?

Title: The Shifting Landscape of Crypto Venture Capital The era of dedicated crypto venture capital funds is undergoing a significant transformation. Once essential for navigating the sector's complexity and high risk, these specialized funds are now facing an identity crisis as the market matures. This shift mirrors historical patterns in other specialized investment classes like cleantech and SPACs, where initial information advantages dissipate as technologies become mainstream and integrated into existing industry frameworks. The article argues that crypto is reaching a critical inflection point, transitioning from a "building phase" to an "integration phase." Major players like Stripe, BlackRock, and Visa now engage with crypto not for its novel mechanics but as a foundational financial infrastructure. Their needs—regulatory compliance, banking partnerships, distribution channels—align with traditional fintech, a domain easily understood by large, generalist funds like Sequoia and Founders Fund. This evolution creates a "barbell effect" within the VC landscape. On one end are massive, diversified platforms that can incorporate crypto as one vertical among many. On the other are small, nimble funds focused on niche, experimental projects. The middle ground—medium-sized dedicated crypto funds—is being squeezed out. Their typical fund size makes it impossible to generate sufficient returns solely from early-stage crypto bets, yet they cannot compete with giants for later-stage deals. Consequently, leading crypto-native firms like Paradigm and Framework Ventures are expanding into AI, robotics, and other sectors, driven partly by LP pressure for better returns amid a broader VC DPI crisis. Others, like Dragonfly and a16z, have narrowed their crypto focus predominantly to financial infrastructure like stablecoins, reframing the sector's core narrative. For crypto entrepreneurs, this consolidation presents challenges. While generalist funds offer larger checks and broader resources, crypto projects now compete fiercely with AI for attention and capital within these firms. Furthermore, the long-term, non-commercial foundational work that built the ecosystem—funded by dedicated crypto VCs—is less likely to attract generalist capital focused on direct returns. The conclusion is that "crypto investor" as a standalone category is becoming obsolete, akin to "internet investor." Crypto is becoming a baseline infrastructure layer. The future will see a barbell structure: large-scale growth financing handled by generalist funds, while pioneering, speculative projects are funded by small, specialized vehicles. The dedicated crypto funds of the 2017-2021 boom, which incubated core infrastructure, are giving way to this new, bifurcated reality.

Foresight NewsHá 1h

The Changing Landscape: What Are Crypto VCs Experiencing?

Foresight NewsHá 1h

As Consensus Accelerates, What Are Young Investors Betting On?

Title: As Consensus Forms Faster, What Are Young Investors Betting On? In the rapid evolution of tech investment, a new generation of young investors is navigating a landscape where AI, robotics, commercial aerospace, and quantum computing are advancing simultaneously. Traditional investment logic based on financial models is giving way to a need for deep technical understanding and the ability to act before industry consensus forms. An analysis of trends from the "WAIC FUTURE TECH" list of young investment leaders reveals key shifts in focus. The first major trend is the movement of AI from the digital screen into the physical world. Investment is shifting from large language models and chatbots towards embodied AI, robotics, AI hardware, and edge computing. While demonstrations generate excitement, the real challenge lies in achieving scalable, reliable, and cost-effective delivery in complex real-world environments like factories and logistics. Success depends not just on algorithms but on the integration of sensors, actuators, and control systems. Second, the competitive focus for large models is moving beyond raw capability toward building an "intelligence flywheel." The goal is to create self-reinforcing systems where user interaction generates data, improving the model, which in turn enhances the user experience and attracts more engagement. Companies that successfully embed AI into workflows to create these closed-loop systems can build lasting value that isn't easily erased by the next model upgrade. Third, facing a potential bottleneck in high-quality human-generated data, investors are looking at new underlying technologies. Reinforcement learning and self-play, as demonstrated by AlphaGo Zero, offer paths for AI to generate its own experience. Scientific foundation models, which aim to build general AI capabilities for fields like life sciences and materials discovery, represent a non-consensus direction that could unlock new frontiers of knowledge and data. Finally, in deep-tech areas like quantum computing, commercial aerospace, and space-based infrastructure, patient capital is essential. These fields have long, uncertain development and validation cycles involving complex engineering, supply chains, and regulations. Investment here requires a long-term view, focusing on foundational team capabilities and the eventual emergence of market demand, even if commercial returns are distant. Collectively, these trends illustrate how young investors are adapting to a new era. They are learning to make earlier, technically-informed judgments, balance hype with real-world viability, and provide the patient capital needed to build the deep-tech foundations of the future.

marsbitHá 1h

As Consensus Accelerates, What Are Young Investors Betting On?

marsbitHá 1h

Trading

Spot
活动图片