In September 2024, the Federal Reserve officially initiated interest rate cuts. The median dot plot at the time drew a clear line: down to 3.4% by the end of 2025, implying 4 more cuts.
Six quarters have passed. Last night's March SEP tells us this line has completely distorted.
The Fed kept rates unchanged at 3.50%-3.75%, which was no surprise to the market. But what happened inside the dot plot is more worthy of dissection than the rate decision itself. Among the 19 members, 7 believed there should be no rate cuts this year, and 7 believed there should be one cut. A perfect split. The median didn't change, but the consensus has collapsed.
Using the three charts below, we briefly examine how the Fed has been chasing reality to revise its expectations step by step, the extent of its internal divisions, and why its inflation forecasts are likely underestimated again.
The Collapse of Rate Cut Expectations
According to the Fed's official SEP data, when the rate cuts started in September 2024, the median dot plot projection for the end of 2025 was 3.4%, implying 4 more cuts from the then level of 4.75%-5.00%.
Three months later, in the December SEP, this number jumped to 3.9%. Only 2 cuts remained. After that, through four SEP updates in March, June, September, and December of 2025, the year-end projection for 2025 never returned to 3.4%. The actual year-end rate for 2025 landed in the 3.50%-3.75% range, a full 25 basis points higher than expected when the cuts began.
The projection for 2026 followed the same path. In September 2024, the Fed expected rates to fall to 2.9% by the end of 2026. By last night's March SEP, this number stabilized at 3.4%, 50 basis points higher than the initial expectation.
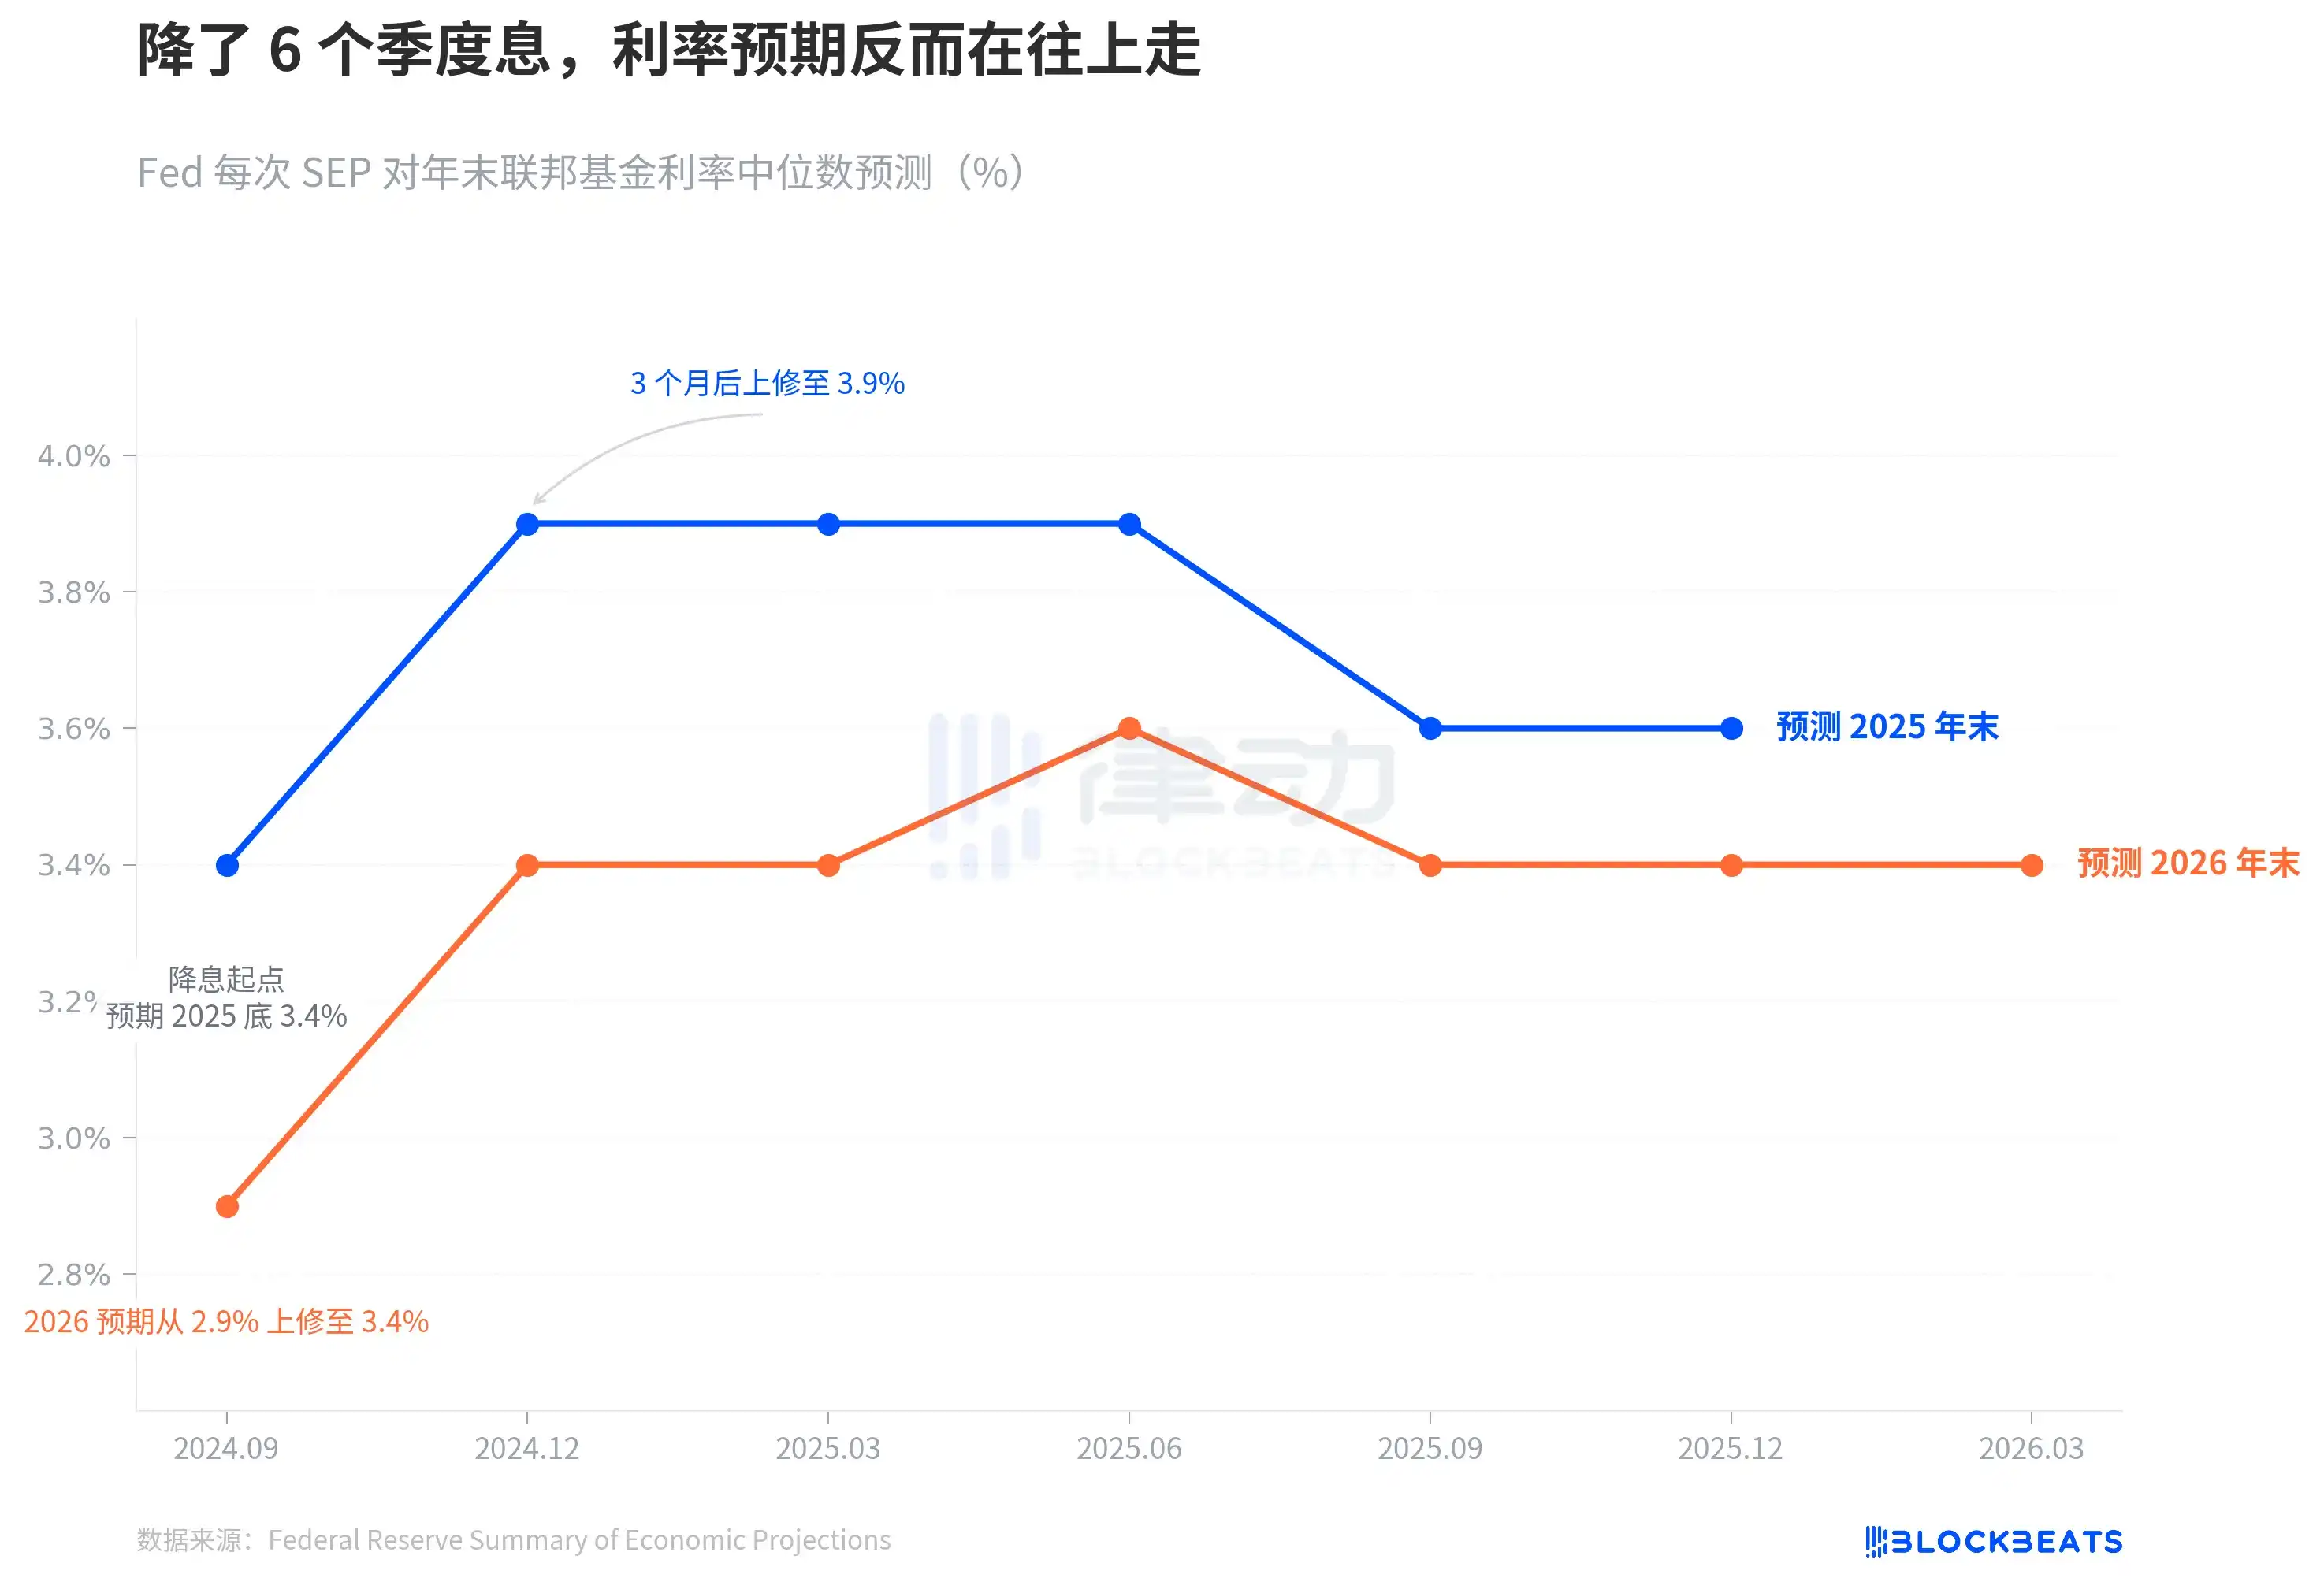
The trends of the blue and orange lines tell the same story: the rate-cutting cycle did indeed start, but the Fed's own judgment on the terminal rate has been continuously shifting upwards.
This drift speed is even more evident when viewed in a longer time frame. In September 2024, the Fed had just cut rates from the peak of 5.25%-5.50% to 4.75%-5.00%. Market confidence in the rate cut path was strong at the time. CME FedWatch once gave a high implied probability of 4-5 cuts in 2025. But the Fed's own forecast ran away first—in December, it directly halved the projected cuts, with the blue line jumping from 3.4% to 3.9%, a single-quarter jump of 50 basis points. No matter how the economic data fluctuated afterwards, this line never came back.
In other words, just 3 months after the rate-cutting cycle began, the dot plot was already hitting the brakes on the rate cut path.
7:7, The Fed Can't See the Direction Clearly
The median is a number that masks the division behind it.
According to the Fed's March SEP Figure 2 dot plot (compiled by BondSavvy), the distribution of votes from the 19 participants for the end-2026 rate is: 7 for no cuts, 7 for one cut, 2 for two cuts, 2 for three cuts, and 1 for four cuts.
7:7, a perfect split. 14 people are concentrated in the "maintain status quo" and "cut once" categories, with only 5 expecting more than one cut.
Compared to the December 2025 SEP, the change is dramatic. In December, 12 people still expected 2 or more cuts; by March, only 5 remained. Powell confirmed this shift at the press conference: "4 to 5 people moved from expecting 2 cuts to expecting 1 cut."
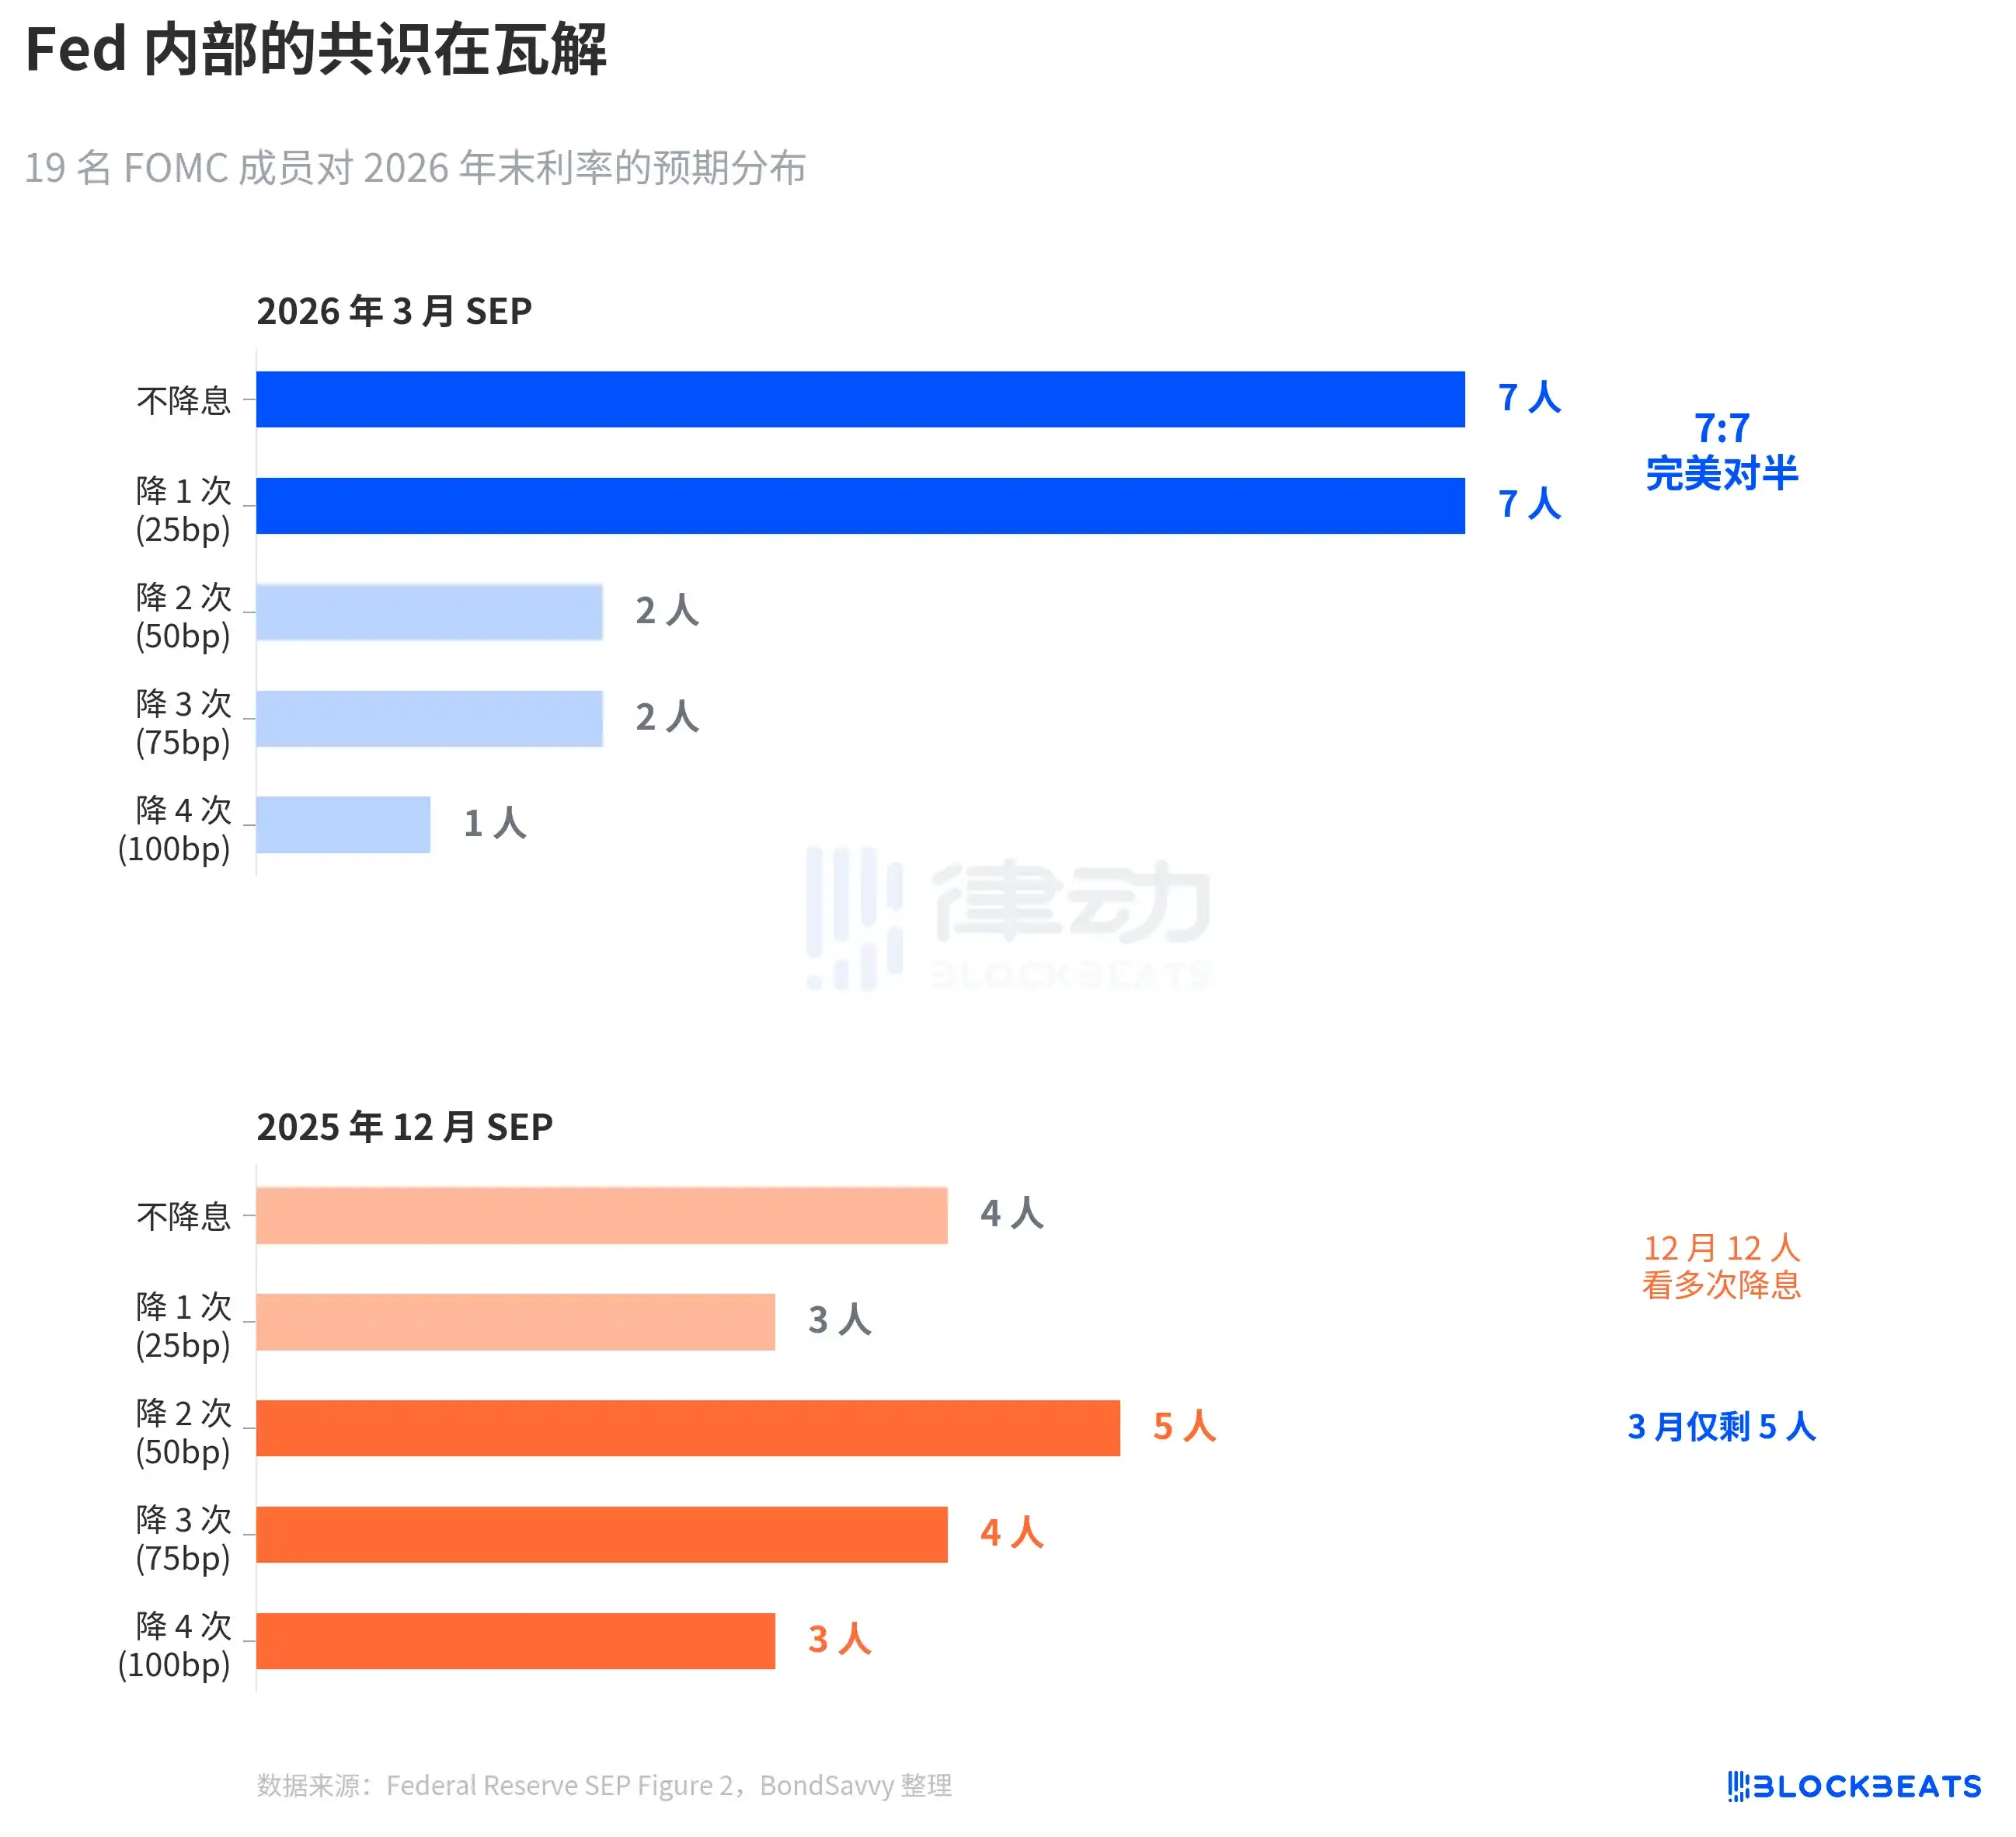
This symmetrical split is very rare in FOMC history. According to a 2023 study by the San Francisco Fed (Bundick & Smith), internal divergence in the dot plot was almost zero during the 2020 pandemic and gradually increased during the subsequent hiking cycle. But past disagreements were mainly about "magnitude"—whether to hike 25 or 50 basis points—the direction was consistent. The March 2026 disagreement is a "directional dispute": whether to cut or not.
The median remains at 3.4%, but beneath this 3.4% stand two teams pulling in opposite directions.
More notably is how the distribution narrowed. The December dot plot was widely scattered, with dots from significant cuts to standing pat. The March dot plot distribution actually narrowed—14 dots squeezed between two categories—but this isn't consensus coalescing; it's two opposing camps each solidifying. Dispersed uncertainty has turned into concentrated disagreement. This is more dangerous than dispersion because any surprise in inflation data could cause one of these teams to collectively shift, causing the median to jump.
The Fed Always Underestimates Inflation
The root of the interest rate dispute is the inflation dispute.
According to various Fed SEP data, in December 2024, the Fed first provided its 2026 PCE inflation forecast: 2.1%. It has been revised upwards every quarter since. March 2025: 2.2%, June: 2.4%, September: 2.6%. December briefly fell back to 2.4%, only to jump to 2.7% in March 2026. Six quarters, a cumulative upward revision of 0.6 percentage points.
This pattern is not new. The 2025 PCE inflation followed the exact same path. In December 2024, the Fed forecast 2025 PCE at 2.5%, subsequently revised up quarter by quarter to 2.7%, 3.0%, 3.0%, and 2.9%. According to data from the Bureau of Economic Analysis (BEA), the actual PCE year-on-year for December 2025 was 2.9%. The Fed spent a whole year catching up, only matching it in the final release.
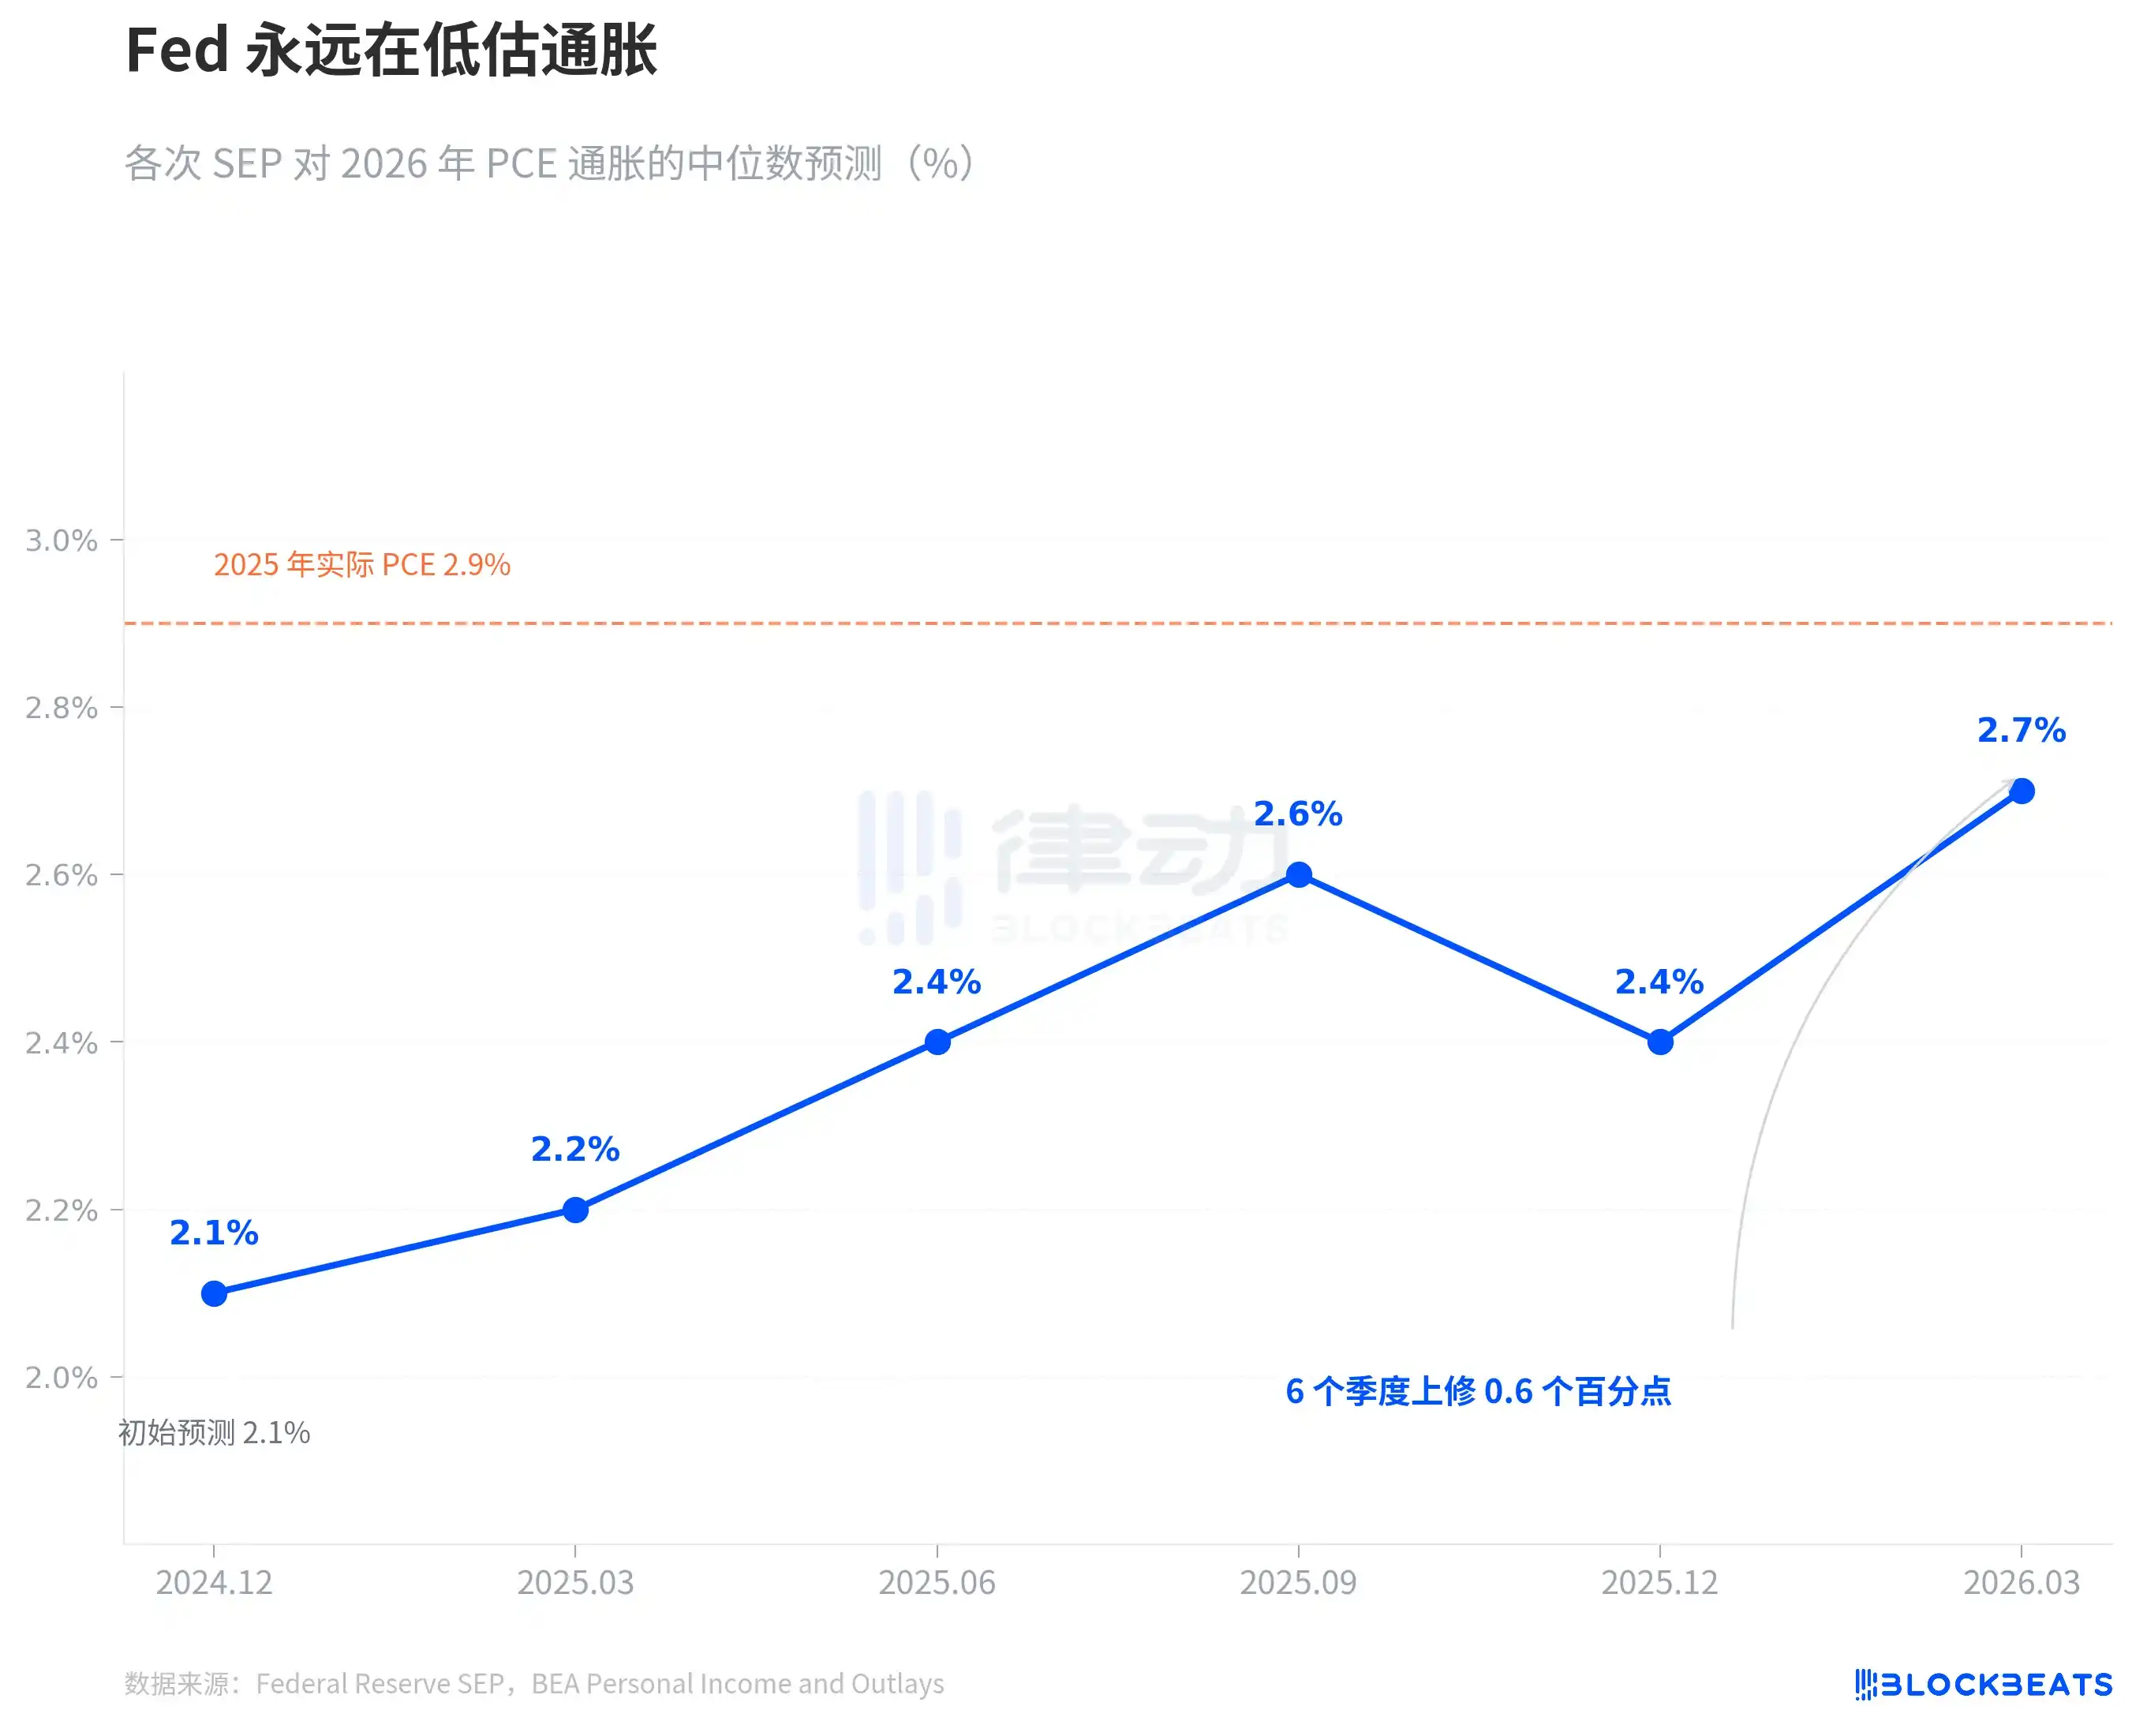
Now the Fed says the 2026 PCE is 2.7%. The orange dashed line on the chart marks the 2025 actual value of 2.9%. Based on their own track record, 2.7% is likely just the starting point, not the endpoint. It's not a conspiracy, it's a pattern. The Fed's real-time inflation forecasts over the past two years have only had one direction—chasing it higher.
Core PCE is worth looking at separately. The March SEP revised the 2026 core PCE forecast up from 2.5% in December to 2.7%, a single-quarter revision of 0.2 percentage points, the largest adjustment among all indicators. Core PCE excludes the volatility of food and energy and is considered by the Fed a more reliable gauge of underlying inflation. When the forecast for this indicator is being revised up, it suggests the issue isn't oil price volatility, but underlying inflation stickiness exceeding expectations.
In the same March SEP, the GDP forecast was slightly raised from 2.3% to 2.4%, and the unemployment rate remained unchanged at 4.4%. The economy is slightly better, inflation is more stubborn, yet the rate path remains unchanged.
There is tension between these three judgments. If inflation is more stubborn than expected, how can the rate path remain unchanged? The 7:7 split provides the answer—it's not that the Fed thinks rates don't need to change, it's that the Fed's internal judgment on the inflation path itself is split.
According to CME FedWatch data, the market's current pricing for all of 2026 is: 32.5% probability of a 50 basis point cut (2 cuts), 25.9% probability of a 75 basis point cut (3 cuts), 21.1% probability of only 1 cut. The market's weighted expectation is about 50 basis points, more dovish than the Fed's median of 25 basis points. But the divergence between the highest probability scenario and the Fed's median恰好映射了 exactly mirrors the Fed's internal 7:7 split.
No one knows the answer. Including the Fed itself.