A Bullish Pennant Just Appeared On The Dogecoin Monthly Chart, Here’s What To Expect

bitcoinistPublicado em 2026-03-10Última atualização em 2026-03-10

Resumo

A massive bullish pennant pattern is forming on the Dogecoin (DOGE/USD) monthly chart, a development that began after the cryptocurrency's historic rally in 2021. The pattern started with a sharp "flagpole" surge that took DOGE from under $0.01 to its all-time high of $0.73. Since that peak, the price has been compressing between two converging trendlines, creating a symmetrical triangle with a series of lower highs and higher lows. The price is currently testing a critical juncture, trading near the lower, rising support trendline around $0.09. Holding this support is crucial for the pattern's validity; a monthly close below it would weaken the bullish outlook. For the pattern to confirm and trigger a significant breakout, DOGE must first push above the upper, descending trendline, which requires closing consecutive months above the $0.32 level. If a breakout occurs, the measured move target—calculated from the height of the 2021 flagpole—projects a substantial upward move. Conservative estimates suggest a target well above $1, with more optimistic projections reaching the $3 to $4 range.

Most traders are watching Dogecoin on the daily or weekly chart, reacting to intraday price action. However, the monthly candlestick chart tells a different story, one that has been developing since the 2021 cycle and is now approaching an inflection point.

Technical analysis shows a massive bullish pennant is forming on the DOGE/USD monthly timeframe. Dogecoin is now at a lower high support in the pennant, and the technical implications are significant.

Giant Pennant Has Been Forming Since The 2021 Rally

The monthly chart shows Dogecoin’s price compressing between two converging trendlines, forming what appears to be a large bullish pennant. The structure begins with the flagpole: the near-vertical surge that launched Dogecoin from below $0.01 to its all-time high of $0.73 in May 2021.

Since that peak, DOGE’s price action has been forming a symmetrical triangle on the monthly chart, a series of lower highs and higher lows converging steadily toward an apex. The upper boundary slopes downward from the peak reached during the 2021 surge, creating a descending resistance line that has rejected several major rallies since then.
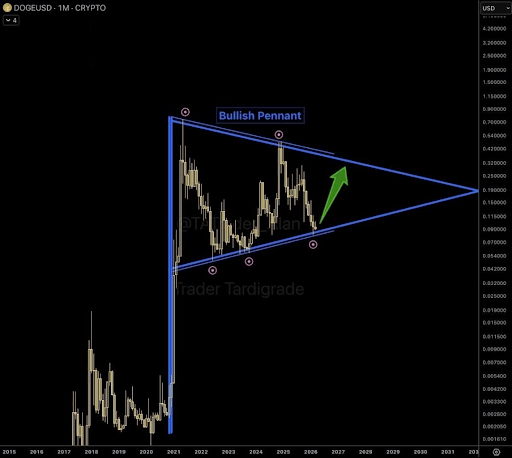
Source: Chart from TheMoonHailey on X

The lower boundary, on the other hand, rises gradually from the base that formed once the previous rally cooled to create a higher low. The lower trendline has provided consistent support, and critically, it held last month when the price tested the $0.08 zone.

As shown in the Dogecoin monthly candlestick chart below, these two lines have created a triangular formation that has continued to narrow since 2021. Multiple turning points on the chart show price reacting precisely at these boundaries, and the structure has been respected repeatedly over time.

Here’s What To Expect From The Bullish Pennant

One of the most important details in the chart is the most recent interaction with the lower trendline. Dogecoin dipped to the rising support boundary in February and bounced. That rebound occurred around the same area where Dogecoin has been trading recently, just below the $0.09 level.

At the time of writing, Dogecoin is trading at $0.094, still close to the support. Holding this support and closing above it in March is important for the structure because a bullish pennant depends on price remaining inside the converging boundaries. If DOGE were to close the month below the lower trendline, then the bullish outlook would weaken.

On the other hand, the bullish outlook depends on Dogecoin breaking above the upper end of the bullish pennant. The measured move target of a bullish pennant is calculated from the height of the flagpole, projected from the breakout point. Given the scale of Dogecoin’s 2021 flagpole, even conservative projections point well above $1, with upper-range targets in the $3 to $4 territory.

However, there is still much work to do for DOGE to return to the upper trendline before a breakout. Particularly, Dogecoin needs to push above $0.32 and close consecutive months above this level.

DOGE trading at $0.09 on the 1D chart | Source: DOGEUSDT on Tradingview.com

Perguntas relacionadas

QWhat pattern is forming on the Dogecoin monthly chart according to the article?

AA massive bullish pennant is forming on the DOGE/USD monthly timeframe.

QWhat was the starting point (flagpole) of this bullish pennant pattern?

AThe flagpole was the near-vertical surge that launched Dogecoin from below $0.01 to its all-time high of $0.73 in May 2021.

QWhat is the critical support level that Dogecoin recently tested and held?

ADogecoin recently tested and held the support at the lower trendline around the $0.08 zone in February.

QWhat is the significance of Dogecoin closing a month above the $0.32 level?

AClosing consecutive months above the $0.32 level is necessary for Dogecoin to push towards the upper trendline and attempt a breakout from the pennant.

QWhat is the potential price target if the bullish pennant pattern completes with a successful breakout?

AThe measured move target, based on the height of the 2021 flagpole, points well above $1, with upper-range targets in the $3 to $4 territory.

Leituras Relacionadas

Must-Watch Events Next Week|CLARITY Act Could Face Senate Vote; SpaceX, Circle to Report Earnings (8.3-8.9)

**Summary: Key Events and Developments to Watch (August 3-9)** The upcoming week is marked by significant financial disclosures, key legislative deadlines, and notable product updates. **Major Financial Events:** Several companies are scheduled to release their Q2 2026 earnings. American Bitcoin (ABTC) will report on August 3, followed by SpaceX and Hut 8 Mining Corp. on August 4, and Circle on August 5. Notably, a significant portion of SpaceX shares (up to 12% of total shares) will be unlocked on August 6 following their earnings release. **Key Legislative Deadline:** The U.S. Senate faces an August 7 deadline to secure 60 votes for the CLARITY Act, a bipartisan bill aiming to establish a federal regulatory framework for cryptocurrencies. The Senate may hold a full vote on the bill during the week. **Economic Data:** The U.S. July Non-Farm Payrolls report will be released on August 7, providing crucial labor market data. **Technology & Product Updates:** * **Shutdowns:** DeFi portfolio tracker Zapper and wallet app Ctrl Wallet will cease operations on August 3. * **Upgrades:** LayerZero will deprecate its v1 relayers on August 3. XRP Ledger's new version 3.3.0, featuring five new functions, is expected next week. * **AI:** Elon Musk announced that the advanced Grok 4.6 AI model is set for release around August 7. * **Bitcoin:** The BIP-110 forced signaling for a potential Bitcoin network change is scheduled to begin around August 8. **Other Notable Events:** Chinese robotics firm Unitree Tech has set its preliminary price inquiry for its IPO for August 5. South Korean exchange Upbit will delist AQT and AERGO tokens on August 3.

marsbitHá 1h

Must-Watch Events Next Week|CLARITY Act Could Face Senate Vote; SpaceX, Circle to Report Earnings (8.3-8.9)

marsbitHá 1h

Stocks Are Plummeting More Sharply Than Cryptocurrencies. Where Has the Money Gone?

Stock Markets Plunge Deeper Than Cryptocurrencies: Where Did the Money Go? In late July, Seoul's Kospi index triggered circuit breakers for two consecutive days, plummeting over 40% from its June high. The collapse was led by heavyweight stocks like SK Hynix, whose record profits still disappointed investors, and devastating leveraged ETFs, with one major product losing over 83% of its value. This signaled a global, forced deleveraging targeting the most crowded trades. Interestingly, while stocks exhibited extreme volatility akin to crypto markets, Bitcoin rose nearly 15% in July after a prior steep drop. Analysis shows the money fleeing equities did not flow into Bitcoin. Instead, Bitcoin had already absorbed its sell-off in May-June, when U.S. spot Bitcoin ETFs saw historic outflows. The true safe-haven beneficiary was gold, whose price rose over 20% year-on-year, highlighting a decoupling between Bitcoin and gold as "digital gold." The sell-off was a targeted unwinding of leveraged positions in tech and semiconductors, accelerated by broker-dealer risk management and shifts in the AI narrative, including new competition from Chinese memory chipmakers. The retreat path was clear: from high-valuation tech stocks to cash and U.S. Treasuries, then to gold. For Bitcoin to attract sustained institutional inflows, conditions like eased global liquidity pressure, a "soft-landing" Fed rate cut, and U.S. regulatory clarity via legislation like the stalled CLARITY Act are needed. Currently, Bitcoin is not a safe haven but an already-cleared asset. Its low correlation with tech stocks, however, makes it a potential diversification play for institutional portfolios once the storm passes. The money isn't here yet, but the positioning is underway.

marsbitHá 1h

Stocks Are Plummeting More Sharply Than Cryptocurrencies. Where Has the Money Gone?

marsbitHá 1h

In Conversation with Ray Dalio: We Are Currently in an AI Bubble, with 1% of My Portfolio in Bitcoin

Ray Dalio, founder of Bridgewater Associates, warns in an interview that the current AI boom shows classic bubble characteristics, which could lead to significant economic downturns as seen in past cycles like 1929 or 2000. He explains that speculative enthusiasm, fueled by debt and overvaluation, often precedes a crash when rising rates or taxation force asset sales, causing widespread losses and recession. Dalio also outlines his "Big Cycle" theory, describing an approximate 80-year pattern where widening wealth gaps, massive government deficits, and shifting geopolitical power (like China's rise) create internal conflict and global instability. He emphasizes that we are in a late-cycle, transitional phase where traditional powers like the US and UK face decline. For personal wealth protection, Dalio advises diversification beyond cash into assets like stocks, bonds, real estate, and particularly gold, which he prefers over Bitcoin. While he holds about 1% of his portfolio in Bitcoin as a non-printable hard asset, he views gold as more secure from technological or governmental threats. Regarding AI's impact, Dalio believes it will disproportionately benefit capital owners, worsening inequality by replacing both physical and cognitive labor. He suggests that human intuition and emotional intelligence, combined with AI, will be key for future workers. On taxation, Dalio argues that wealth taxes are impractical and risk triggering asset sell-offs, reducing productive investment. He points to the UK as a cautionary example of debt, low productivity, and political strife. Geopolitically, Dalio foresees a more regionalized world, with the US showing weakness in prolonged conflicts like with Iran, akin to past imperial declines. The ideal outcome, he suggests, is coexisting powerful blocs (e.g., Americas, China-Asia Pacific) without major war.

marsbitHá 5h

In Conversation with Ray Dalio: We Are Currently in an AI Bubble, with 1% of My Portfolio in Bitcoin

marsbitHá 5h

Trading

Spot
活动图片





