Original Title: What drove the stablecoin supply down
Original Author: Hannah Curtis, Product Lead at Crystal Foresight
Original Translation: @lufeieth
Below is the full translation of the report text, chart descriptions, data tables, FAQs, sources, and disclaimers.
What Drove the Stablecoin Supply Down
The stablecoin market reached a record high of nearly $320 billion in May. By July 14th, the market size had fallen to $306.5 billion, a decrease of $11.5 billion (a 3.6% drop) over 90 days, marking the first quarterly contraction in nearly three years.
This decline is real, but highly concentrated. Only a handful of stablecoins contributed almost the entire supply contraction, and the reasons for each coin's decrease vary. The following will outline which stablecoins changed and the reasons behind it.
Key Takeaways
There has been a real and concentrated supply contraction. The net stablecoin supply fell by $11.5 billion. This capital has been redeemed, not merely transferred between wallets or networks. A few stablecoins accounted for almost the entire decline.
The reasons for the decline vary across different stablecoins. The supply of USDe and USDS fell due to yield reductions. The supply of USDC fell due to cooling demand for collateral in DeFi. USDT remained largely unchanged, with its minor changes stemming more from strategic choices rather than yield dynamics.
Different stablecoins are interconnected through underlying capital pipelines. The unwinding and redemption of USDe alone reduced the USDC held in Ethena's reserves by approximately $2 billion.
The decline in gold-backed tokens stems from entirely different reasons. The total market capitalization of PAXG and XAUt decreased by about $900 million as the spot gold price corrected. This is unrelated to changes specific to the stablecoin market.
Some growth is driven by subsidized purchases, not organic demand. The fastest-growing USDG expanded through a profit-sharing rewards program. If incentives stop, this portion of the supply could also leave.
1. After the Record High, a Real Supply Decline
For most of 2026, the stablecoin supply continued to rise. In mid-May, the total stablecoin size hit a historical peak of $320.4 billion.
Over the 90 days ending July 14th, the stablecoin supply decreased from approximately $318 billion to $306.5 billion, a reduction of $11.5 billion, or 3.6%. The current size is nearly $14 billion below the May peak.
This is the first quarterly supply contraction since late 2023. The dollar-denominated decline in June alone was the largest monthly drop since the Terra collapse in 2022.
When stablecoins are redeemed, they are burned. Therefore, this decline represents real capital flowing back from on-chain to banked dollars, not a stablecoin depeg.
The reason this warrants further breakdown is that the decline was extremely uneven. Splitting the market into specific coins reveals that the supply contraction is concentrated in a very short list, with each stablecoin having its own reasons for the decrease.
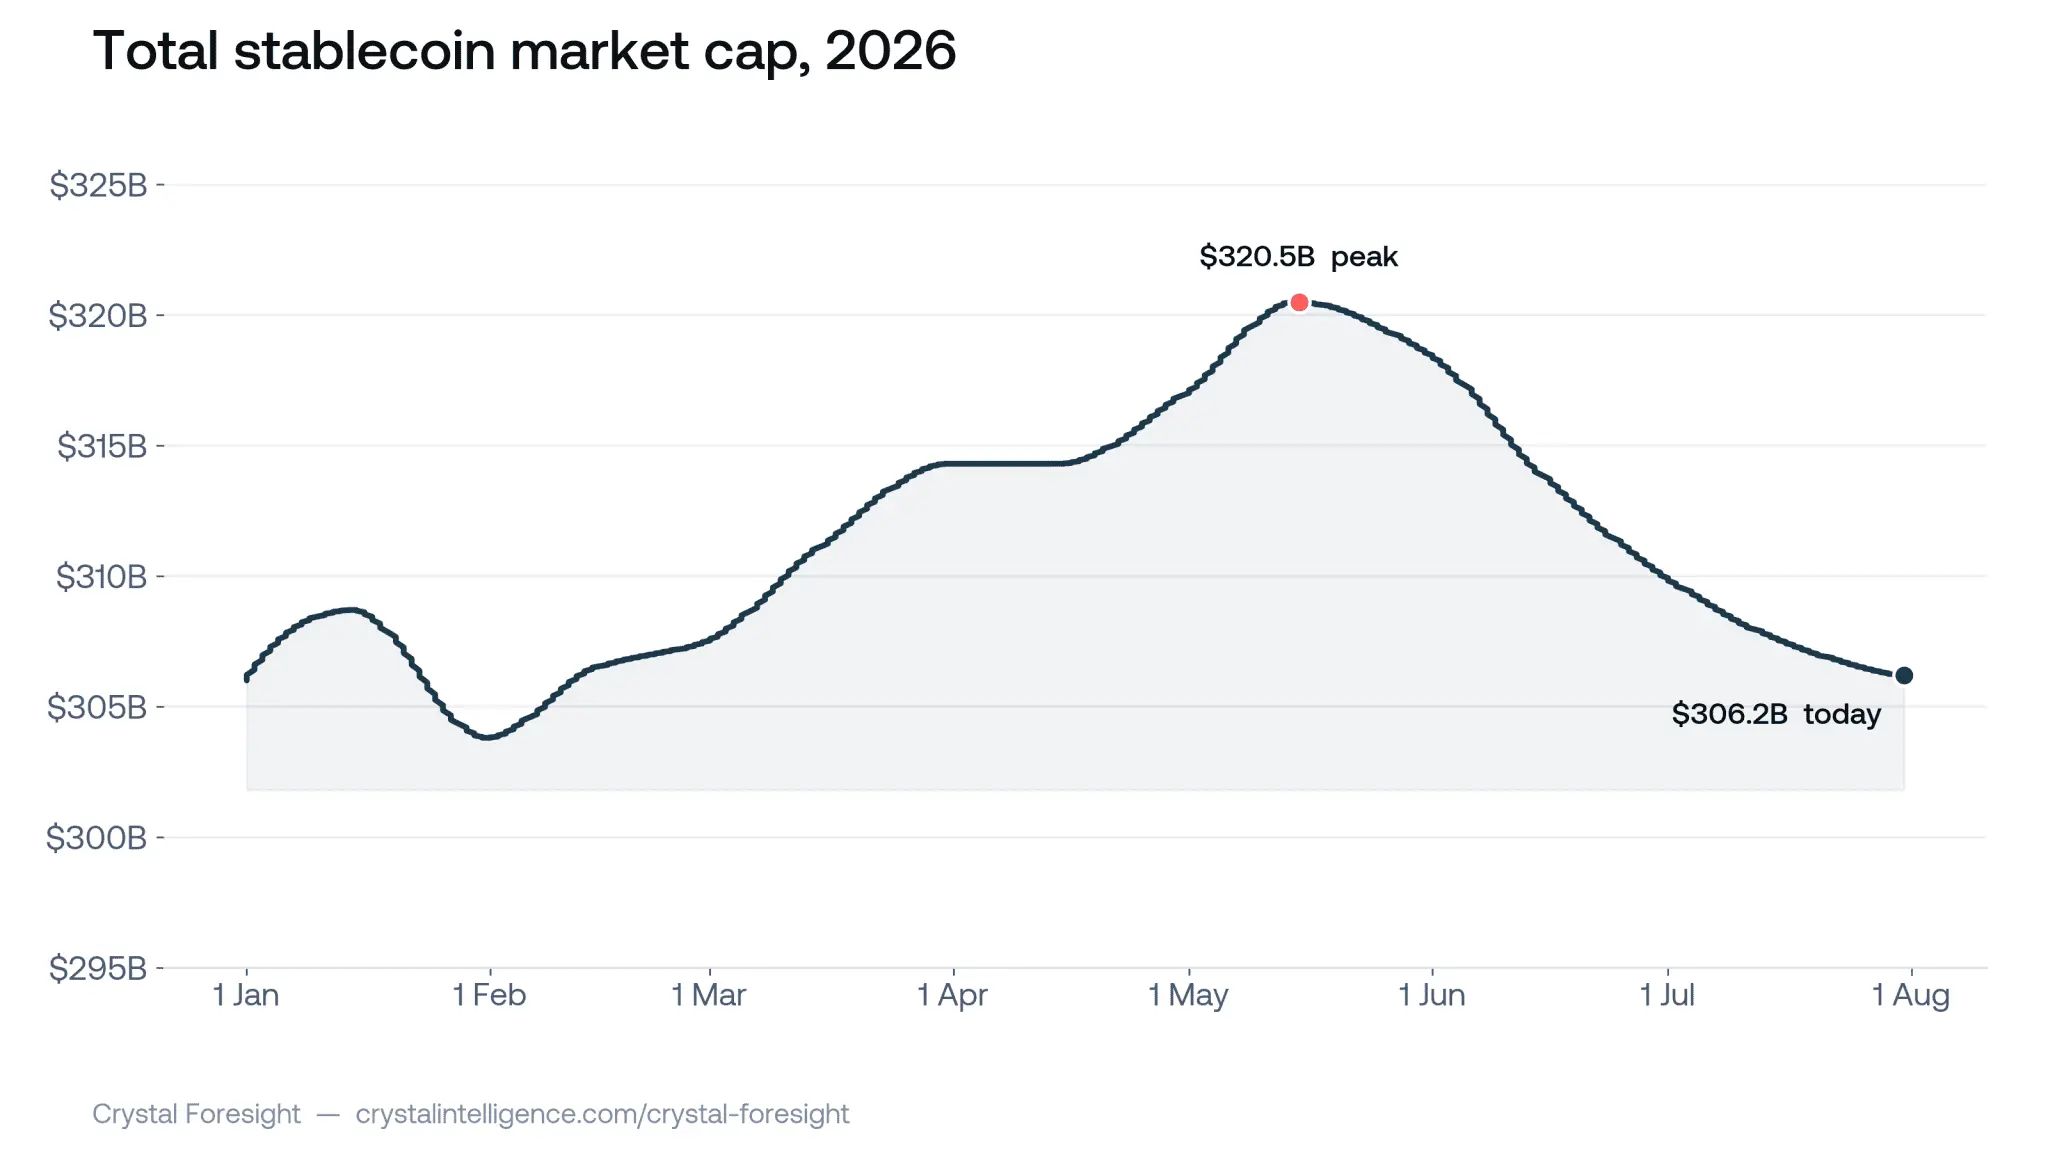
Chart description: The stablecoin market size first rose to a record high in May, then decreased by $11.5 billion over 90 days. Data covers the total market capitalization of all tracked assets classified as stablecoins for 2026.
Data source: DefiLlama.
2. Different Stablecoins Serve Different Functions
While these stablecoins superficially represent "one dollar on-chain," their actual use cases vary significantly.
Crystal's "Transfer Fingerprint" analysis identifies these differences:
USDC and USDS are primarily collateral-type stablecoins. Approximately 58% and 80% of their transaction volume, respectively, are related to capital inflows and outflows in lending markets.
USDe is primarily a yield-type stablecoin, with nearly 40% of its activity occurring in yield protocols.
USDT is mainly used for payments and trading. About half of its activity consists of ordinary transfers, around a quarter is exchange fund flows, with a relatively low proportion used as collateral.
The primary scenario in which a stablecoin exists determines what factors drive changes in its supply. This explains why the same quarter had completely different impacts on different stablecoins.
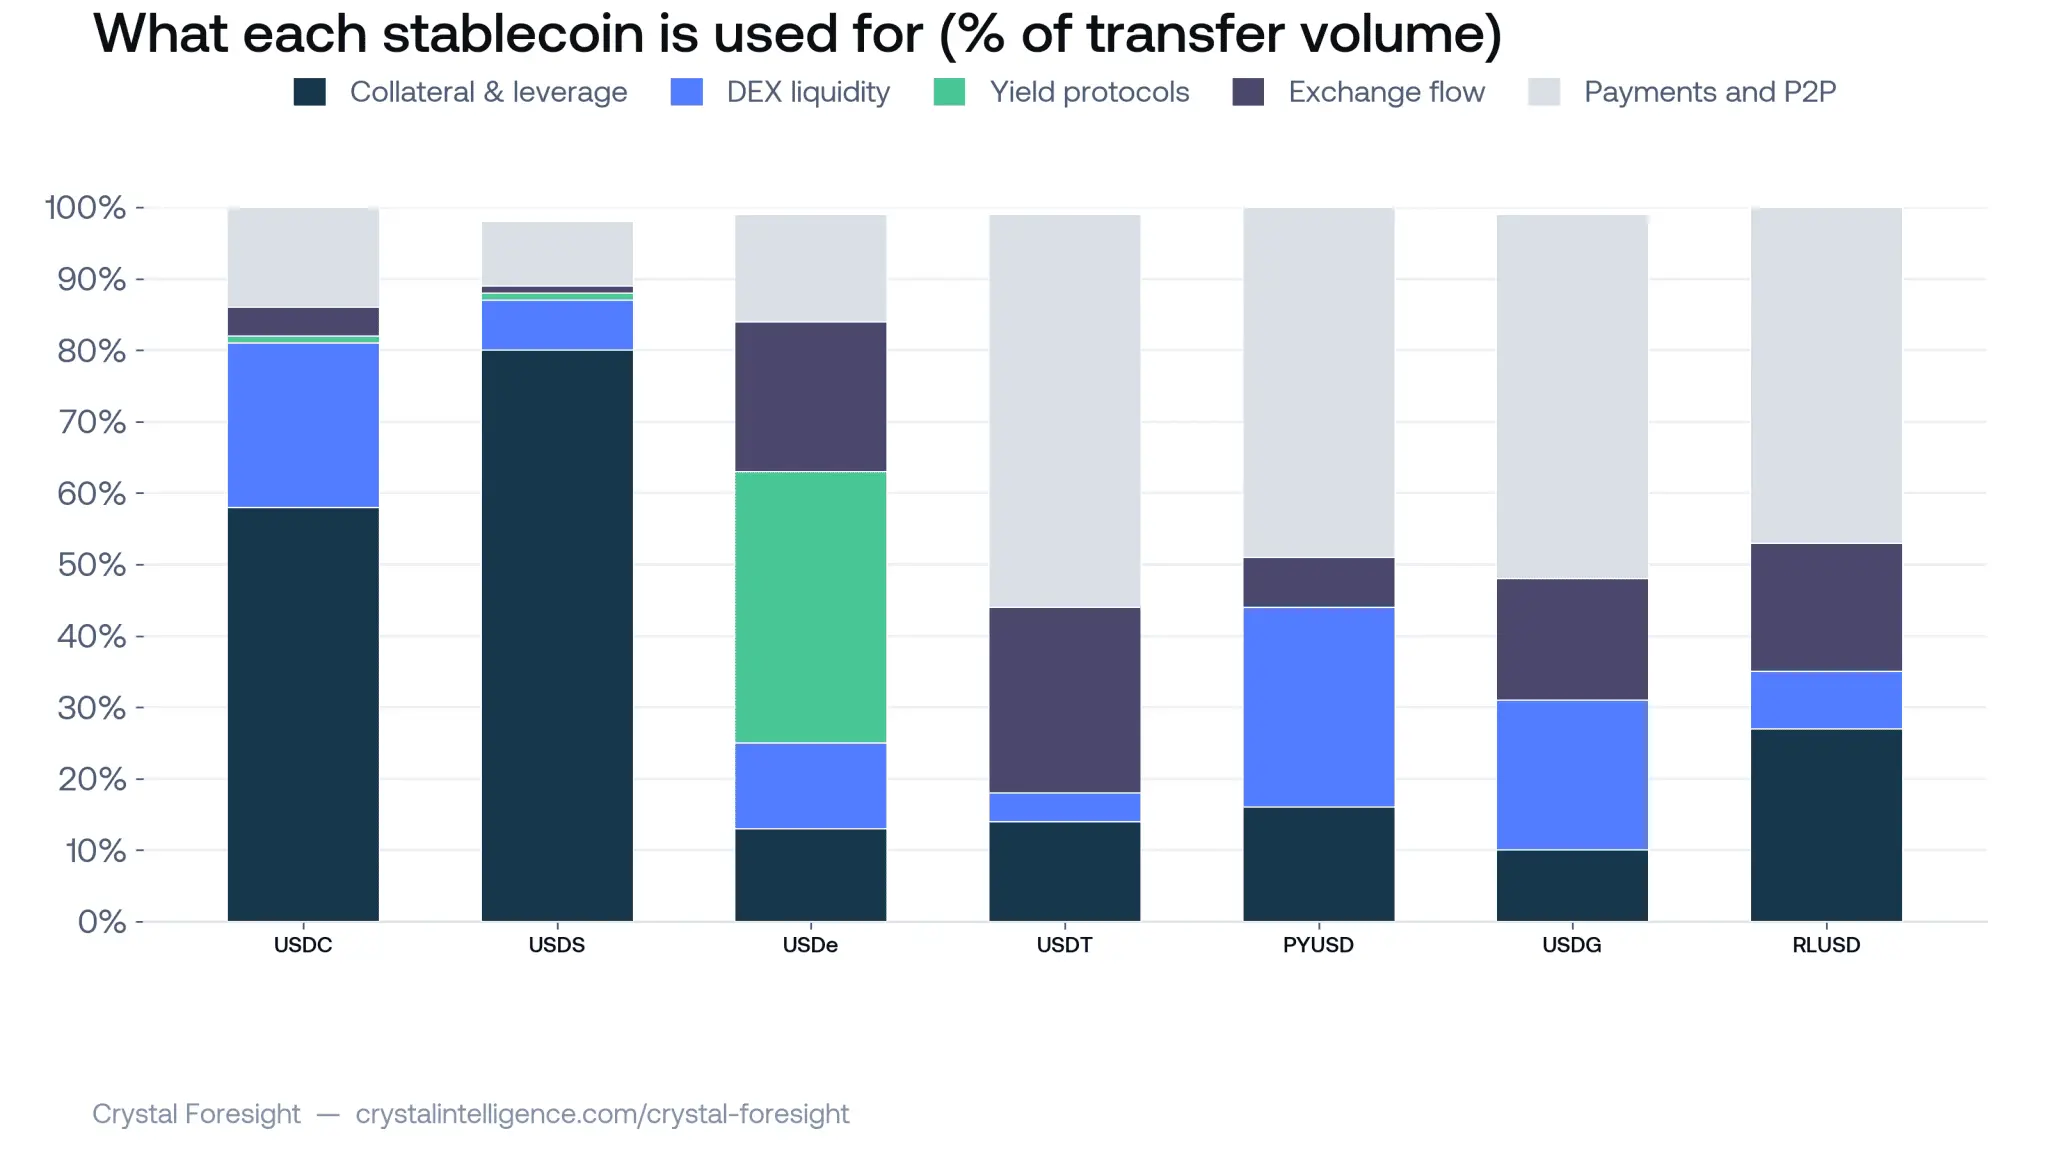
Chart description: The same functional dollar performs different jobs on-chain. The chart shows the proportion of each stablecoin's total transfer volume over the past 7 days categorized by activity type.
Data source: Crystal Intelligence Transfer Fingerprint data.
3. Which Stablecoins Changed
Five stablecoins contributed almost the entire supply contraction:
USDC decreased by $5.8 billion
USDe decreased by $2.0 billion
USDS decreased by $2.0 billion
USDT decreased by $1.4 billion
PYUSD decreased by $1.2 billion
Two additional gold-backed tokens also declined, the reasons for which will be explained separately later.
Meanwhile, a small number of stablecoins saw growth:
USDG increased by $829 million
USD1 increased by $338 million
DAI increased by $251 million
RLUSD increased by $67 million
The combined supply increase from these growing stablecoins is only about one-fifth of the decrease from the declining stablecoins.
The table below provides the complete data, including the two gold-backed tokens mentioned in the chart but not individually listed in the text above.
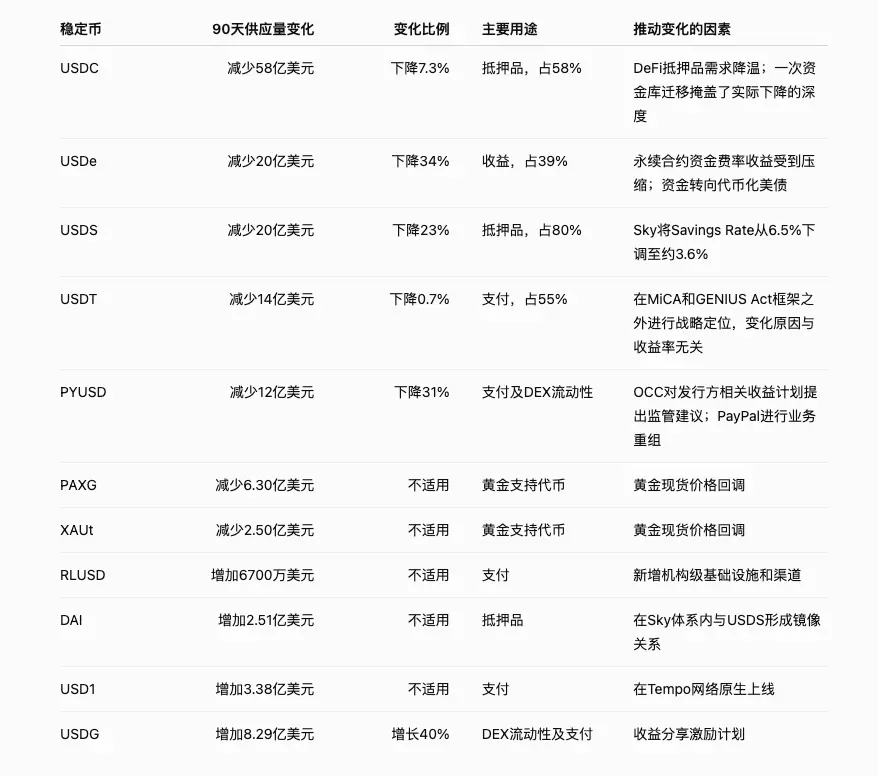
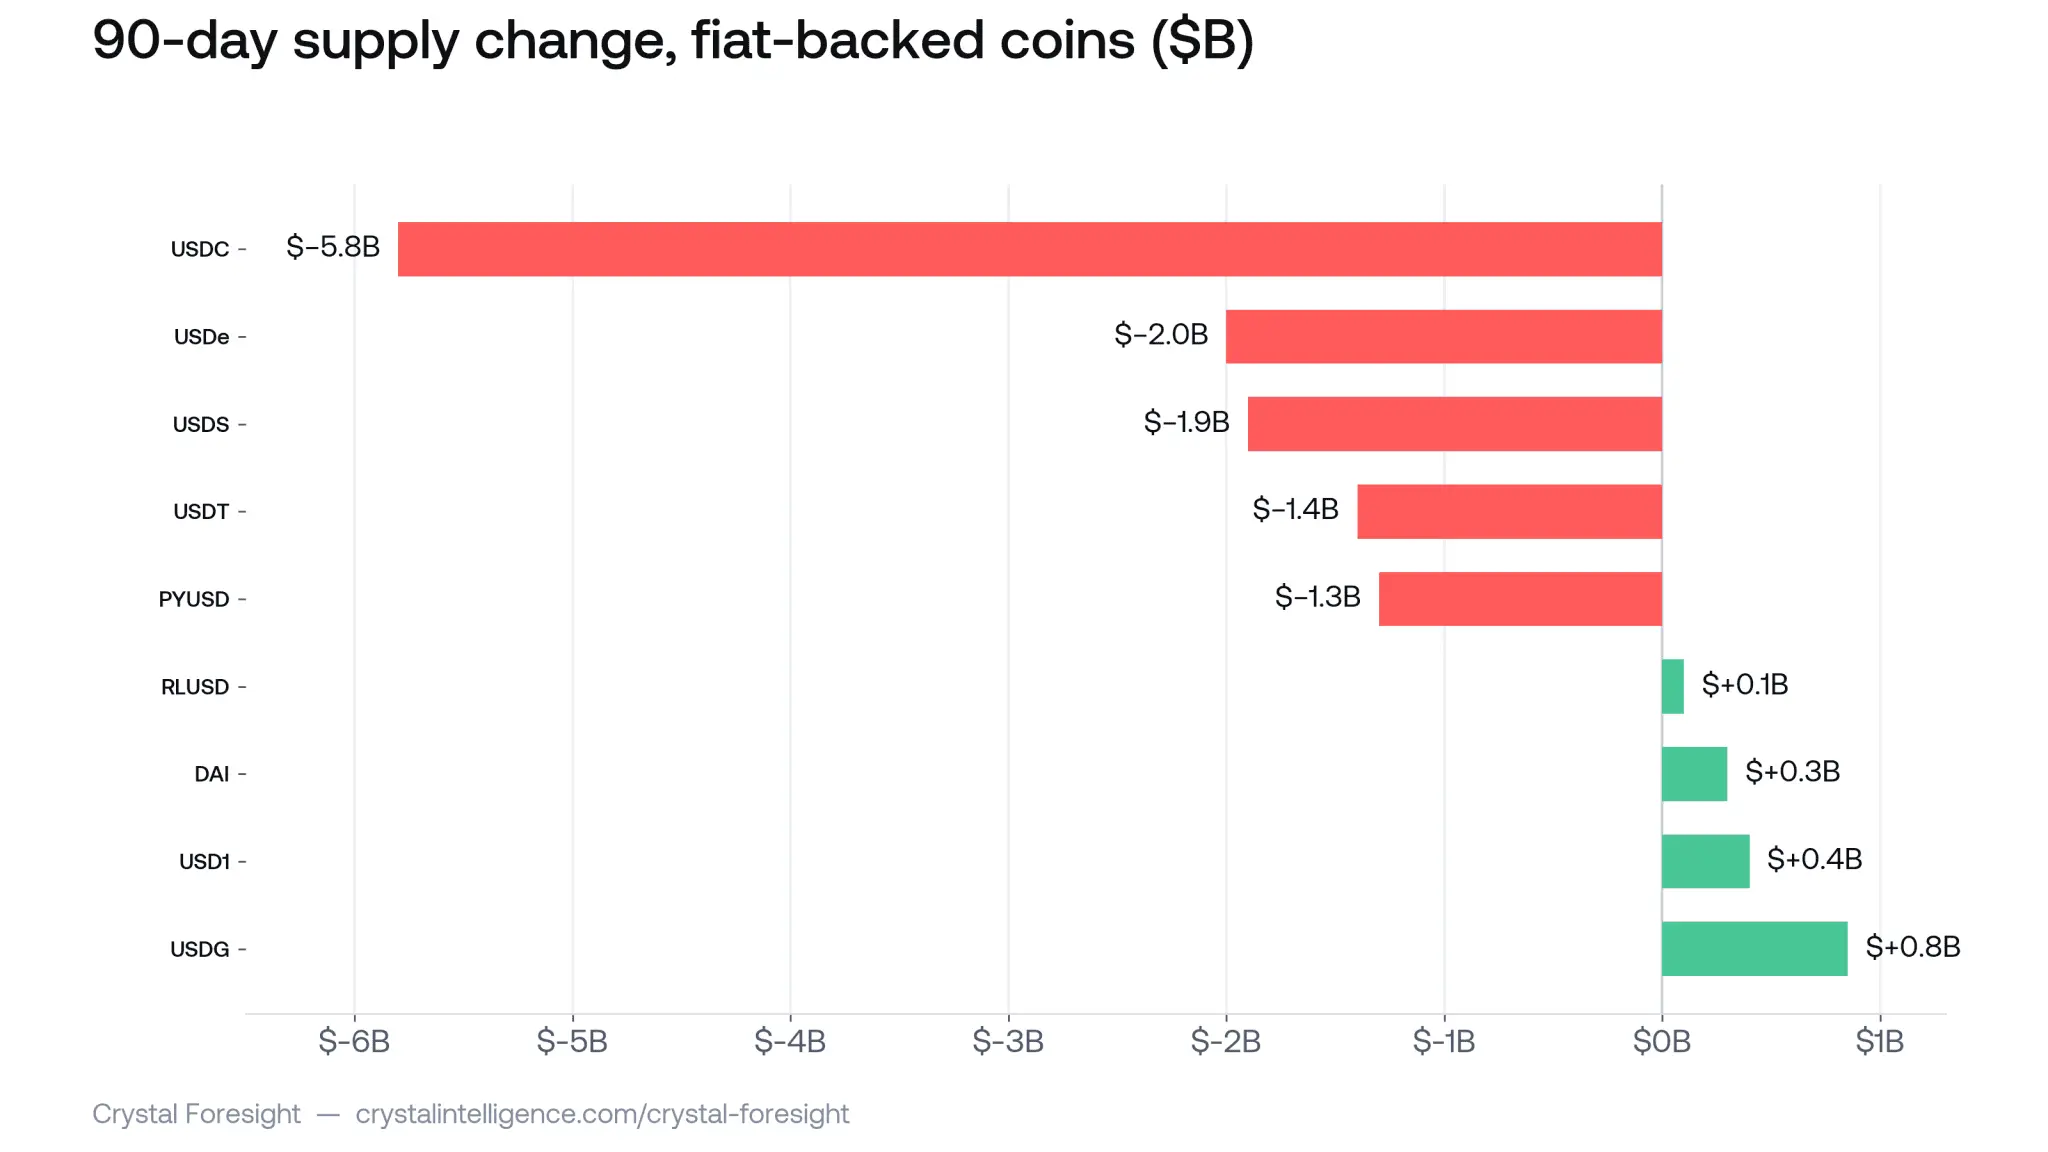
Chart description: The supply decline is highly concentrated. The chart shows the 90-day supply change for each coin, in billions of dollars. USDS data from DefiLlama, all other data from Crystal on-chain data.
4. Gold-Backed Tokens Belong to a Completely Different Market
PAXG and XAUt track the spot price of gold. Their changes reflect gold demand, not dollar demand.
Compared to the historical peak of over $5,590 per ounce in January 2026, the spot gold price has fallen by about a quarter. This price decline is influenced by a stronger US dollar and reduced market expectations for Fed rate cuts.
Therefore, the decline in PAXG and XAUt reflects more of a shift in the gold market and has limited explanatory power for stablecoin adoption. They should be viewed separately when analyzing dollar-pegged stablecoins in this report.
5. USDC: The Decline Hidden Beneath the Surface
The supply contraction contributed by USDC is very large.
USDC's transfer fingerprint explains why it is so vulnerable to a DeFi cooldown. Only about one-tenth of USDC transaction volume comes from natural use cases such as payments, ordinary transfers, and settlements.
Meanwhile:
- 58% of USDC transaction volume is related to collateral flows.
- About one-fifth is related to DEX liquidity.
USDC is the working capital in the DeFi system. Therefore, when DeFi activity cools, USDC supply contracts accordingly.
USDC's total transfer volume decreased by 46.5% week-over-week.
Superficially, the decline in holder data does not seem severe. The USDC holdings of the top 500 addresses decreased by only $1.5 billion, while the total USDC supply fell by $5.8 billion.
But this data is significantly distorted by one single factor: Hyperliquid's new USDC treasury received an inflow of $4.9 billion.
This address, deployed by Coinbase, received a record-breaking transfer of approximately $4 billion from Circle in June when USDC became Hyperliquid's native stablecoin.
This change represents a migration of USDC position, not new demand.
Excluding this migration, the downward trend in USDC becomes very apparent:
- Exchange USDC balances decreased by $7.1 billion.
- USDC in Ethena's reserves decreased by $2.0 billion due to USDe unwinding and redemptions.
- Smaller holder balances further decreased by $4.3 billion.
A large capital consolidation masked a broader redemption trend.
USDC Holder Change Chart
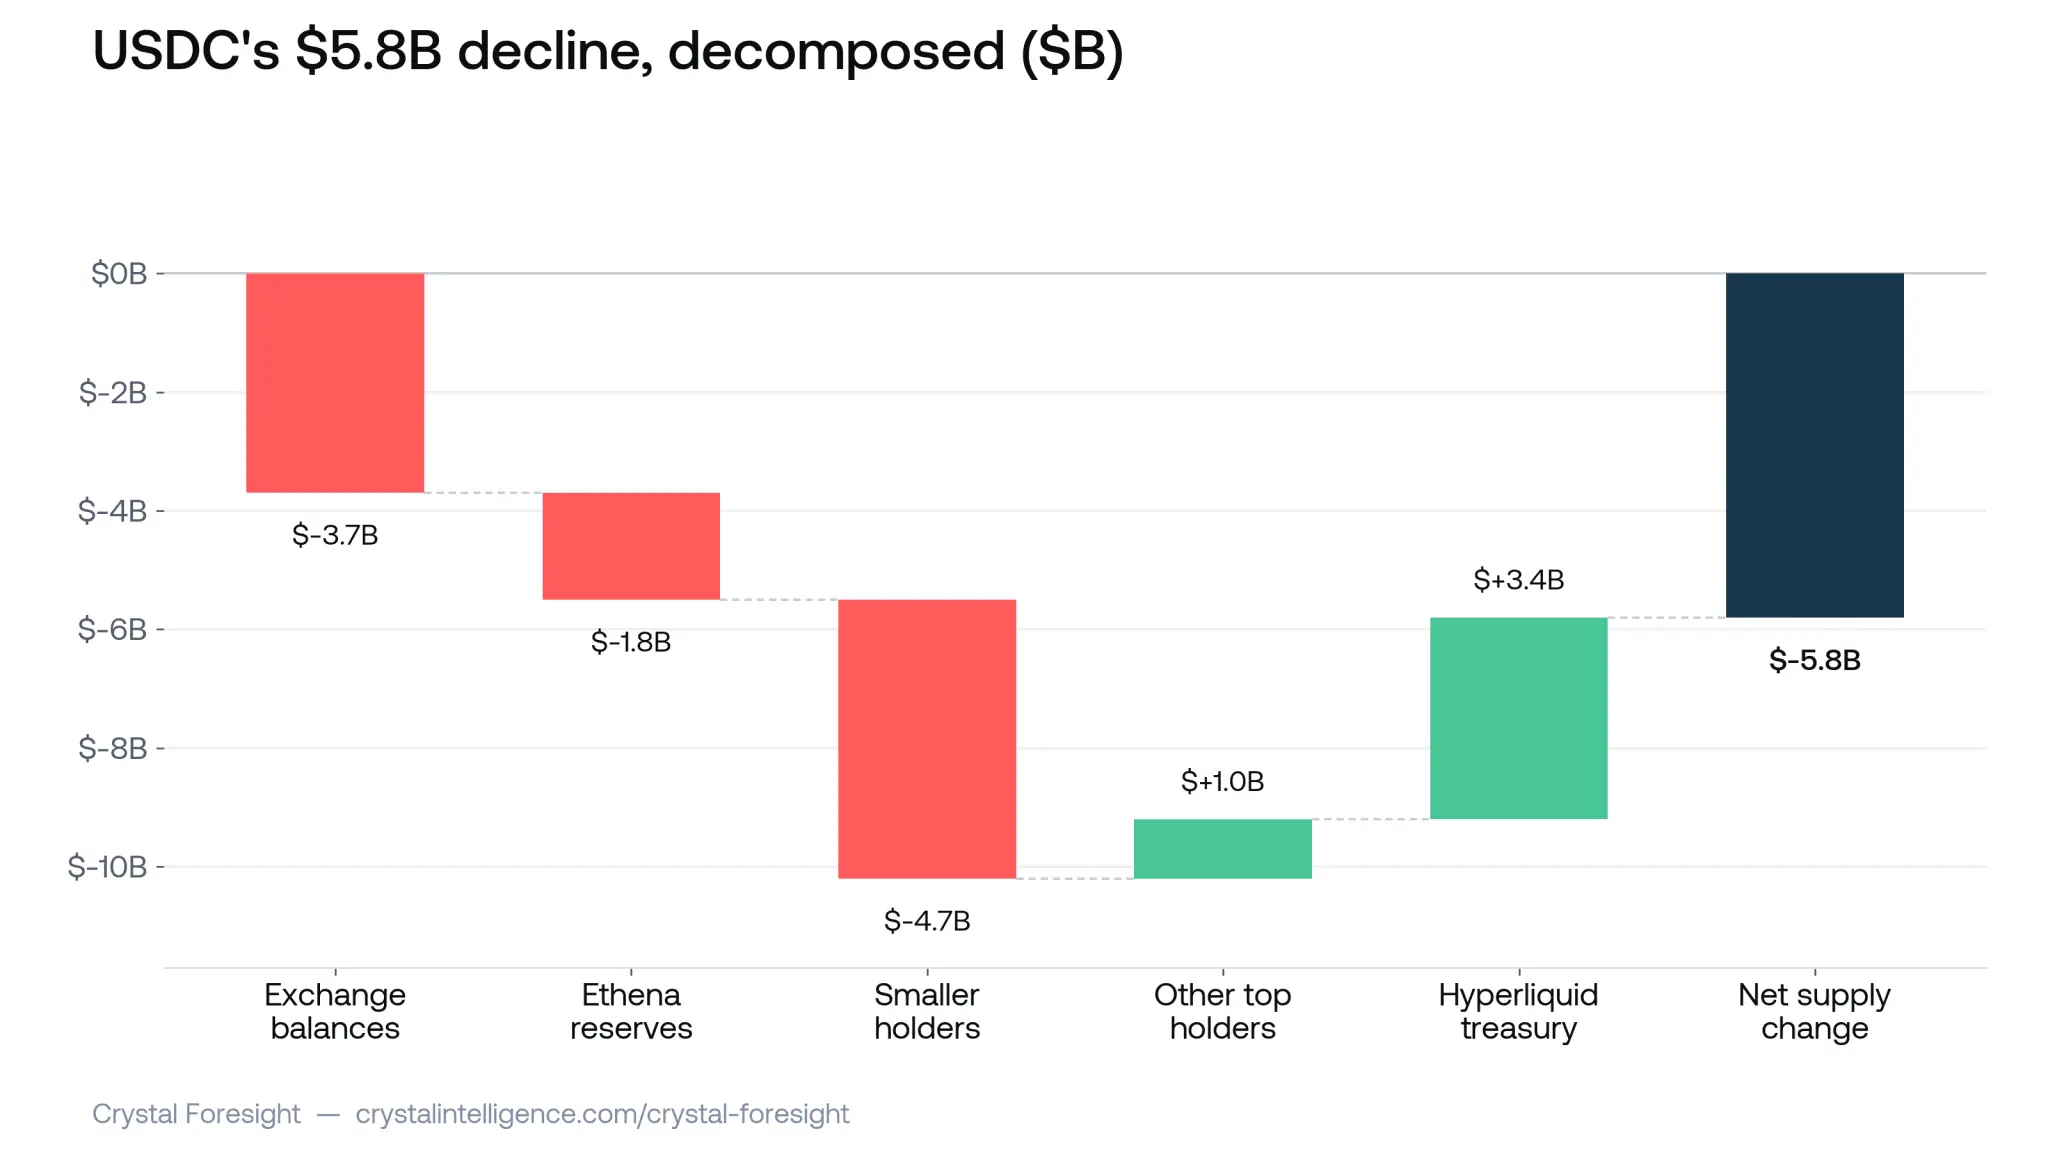
The chart shows the contribution of different holder categories to the $5.8 billion decrease in USDC supply over 90 days:
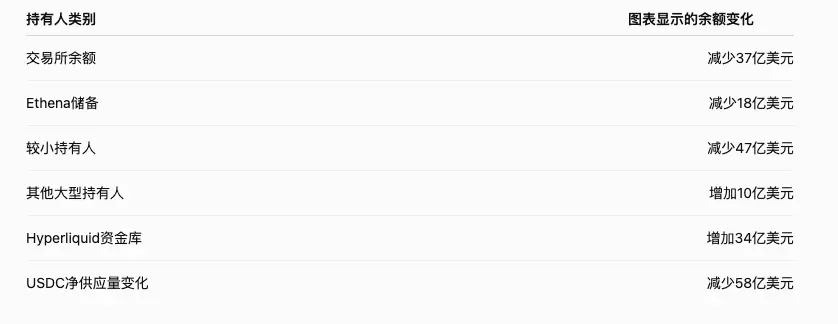
Chart description: The decline is masked, but not gone. The chart breaks down the $5.8 billion decrease in USDC over 90 days by holder distribution, in billions of dollars.
Data source: Crystal Intelligence.
6. Brief Analysis of Other Stablecoins
USDe: Decrease of $2.0 billion, down 34%
USDe's yield growth has stalled.
Throughout the spring, perpetual futures funding rates gradually moved from negative towards near zero, and sUSDe yields fell to the mid-single-digit range. Approximately $1.5 billion exited sUSDe staking products.
This is also part of a broader capital migration. Funds are shifting from crypto-native yield products to tokenized U.S. Treasury products like BUIDL and USDY.
USDS: Decrease of $2.0 billion, down 23%
Sky lowered its Savings Rate from 6.5% to about 3.6%, leading to an unwinding of funds staked in sUSDS.
USDS shares the same Sky reserve base with DAI, so the two should be observed together.
The combined supply of both stablecoins decreased from approximately $13.2 billion to $11.5 billion. Part of this change is simply savers exiting yield-wrapped products and returning to plain DAI.
USDT: Decrease of $1.4 billion, down 0.7%
USDT saw minimal overall change, primarily driven by strategic choices rather than yield dynamics.
Tether chose to keep USDT outside the MiCA and GENIUS Act frameworks rather than adjusting USDT itself to comply. Demand subject to these regulatory constraints is being directed to independent products like USAT.
This small outflow primarily stems from European trading platforms being required to delist USDT.
Therefore, USDT supply is being actively constrained, a different implication from a contraction due to operational difficulties.
PYUSD: Decrease of $1.2 billion, down 31%
PYUSD's capital base in DeFi lending markets is highly sensitive to incentive changes, and this capital had ample reason to exit.
In February, a proposal from the OCC created regulatory uncertainty for issuer-related yield programs. Concurrently, PayPal reorganized PYUSD into a payment-prioritized business unit in late April.
USDG: Increase of $829 million, up 40%
USDG is the fastest-growing stablecoin, but its growth is largely subsidy-driven.
Global Dollar Network's profit-sharing model funds a roughly 7% lending program on Robinhood's new chain and also seeded initial liquidity into a Solana lending pool. Most of the new USDG supply entered these scenarios.
Whether this growth is sustainable depends on how long the incentive programs can be maintained.
USD1, RLUSD, and DAI Grow Through New Channels
Other growing stablecoins primarily expanded via distribution channels and infrastructure.
USD1 achieved native integration on the Tempo payments network.
RLUSD made new institutional-grade progress, including a cross-bank tokenized U.S. Treasury settlement on the XRP Ledger involving JPMorgan and Mastercard.
DAI mirrors the relationship with USDS within the Sky system.
7. Synthesis and Conclusion
The most important conclusion of this report is that no single narrative can explain the changes for all stablecoins this quarter.
When assessing the next quarter's direction, two patterns are worth watching.
First, most of the supply decline can be traced back to yield reductions at Ethena and Sky, not a loss of market confidence.
This mechanism can run in reverse. If on-chain yields rebound or interest rates fall, the same stablecoin supply could return at a pace close to its exit rate.
Second, USDC has high exposure to the DeFi collateral cycle. This means USDC will likely continue to follow DeFi market sentiment more closely than simply tracking the overall sentiment of the stablecoin industry.
Key factors to watch next:
- Whether Ethena's funding rate trade can turn positive again.
- Whether Sky will recalibrate and increase its Savings Rate.
- How the OCC will clarify its regulatory stance on issuer-related yield programs, which is particularly important for PYUSD.
The yield fingerprint and collateral fingerprint are more important than the headline number of total stablecoin supply. The earliest signals of a market turning point will appear in these indicators.
8. Frequently Asked Questions
Does this decline mean any stablecoin depegged?
No.
The stablecoins discussed in this report were destroyed through normal redemption processes; no depegging occurred.
A supply decrease means capital flowed back from on-chain to banked dollars. Depegging should be judged by observing stablecoin prices, not supply. None of the stablecoins covered in this report experienced depegging.
Why did gold-backed stablecoins decline alongside dollar stablecoins?
They declined for different reasons.
PAXG and XAUt track the spot gold price, not dollar redemption demand. Their supply size decreased as the overall gold market corrected, with limited relation to factors specific to the stablecoin market.
What is a "Transfer Fingerprint"?
A "Transfer Fingerprint" is Crystal Foresight's classification of the actual use case for each transfer.
Classifications include:
- Collateral flows in lending markets
- DEX liquidity
- Yield product deposits
- Exchange fund flows
- Ordinary payments
This metric reveals what scenario a stablecoin is used for, not just the volume of its transfers.
Can this supply contraction reverse?
Part of the contraction is potentially reversible.
A significant portion of the decline stemmed from yield programs being cut, not permanent demand disappearance.
If Ethena's funding rate trade turns positive again, or if Sky increases its Savings Rate, some of this stablecoin supply could return.
Why should USDS and DAI be discussed together?
USDS and DAI use the same Sky reserve base.
When savers exit staked sUSDS and move into plain DAI, the data simultaneously shows one stablecoin declining and another increasing.
Observing only one stablecoin in isolation misses this internal capital migration.
9. Sources and Notes
Stablecoin supply and transfer fingerprint data are from Crystal Intelligence's on-chain data as of July 14, 2026, cross-checked with DefiLlama data.
Discrepancies between data for individual coins are controlled within approximately 1%.
Gold price context is from public market reports, including the record high in January 2026 and the subsequent price correction.
Off-chain drivers are from public reports, including:
- CoinDesk
- Cointelegraph
- crypto.news
- Circle's record-breaking transfer of approximately $4 billion on June 12, 2026
- Announcements from stablecoin issuers and protocols
Analysis regarding USDT, MiCA, GENIUS Act, and USAT references public reports and information disclosed by Tether.
10. Disclaimer
This analysis is for informational purposes only and does not constitute financial or investment advice.
On-chain supply and transfer fingerprint data are directional in nature, reflecting information available as of July 14, 2026.
The categorization of entities and functions is derived from the balance and transfer activity of each stablecoin's largest holder addresses. These categorizations illustrate where supply is concentrated and do not constitute a full reconciliation and adjustment of total supply.
Off-chain drivers represent potential causes, not confirmed causal relationships.
Data sources: Crystal Intelligence, Dune, and DefiLlama.
Translator's Note: Data Discrepancies in the Original Report
The original report contains a few minor discrepancies between the main text, tables, and charts. The translation above preserves the original numbers from each section separately:
- USDS shows a $2.0 billion decrease in the table but approximately a $1.9 billion decrease in the chart.
- PYUSD shows a $1.2 billion decrease in the table but approximately a $1.3 billion decrease in the chart.
- In the USDC holder breakdown section, the numbers listed in the main text for exchanges, Ethena, and small holders do not perfectly match the numbers in the waterfall chart.
- The total stablecoin market size is $306.5 billion in the main text but labeled approximately $306.2 billion at the end of the chart.
The report's disclaimer also states that on-chain attribution is a directional estimate and cannot be fully reconciled to total supply.
Regarding USDC, the core takeaway of this report can be summarized as:
The most important insight this report provides for USDC is that while USDC has become a core asset for on-chain dollar liquidity, its current demand structure remains highly dependent on DeFi.
When DeFi expands, USDC grows rapidly as collateral, margin, and liquidity assets. When DeFi cools, this working capital quickly contracts.
For Circle, the key to determining future profitability stability and valuation ceilings lies in whether it can further upgrade USDC from being DeFi working capital to a foundational dollar asset within payments, corporate treasury, RWA settlements, and institutional financial systems.