BTC Faces Triple Resistance at $80,000 Milestone, HYPE Hits New Highs Signaling Potential | Invited Analysis

Odaily星球日报Publicado em 2026-05-26Última atualização em 2026-05-26

Resumo

This weekly analysis maintains a structured framework, focusing on Bitcoin (BTC) and HYPE, dissecting their multi-timeframe price action to identify key support and resistance zones and formulate actionable trading plans. The previous week's short position on BTC yielded a 2.78% gain, reinforcing the "signal-driven, disciplined" approach. For Bitcoin, the core scenario revolves around the battle between the 78,500–79,500 USD resistance zone and the 73,500–75,000 USD support area. The daily chart shows BTC within a rising channel; a failure to hold support at the channel's midline could lead to a test of the lower boundary. The 4-hour chart details an 8-segment corrective structure from the 82,850 USD high. Two short-term strategies are proposed: (A) Selling on a failed rally into the 78.5k-79.5k zone, with a stop above 80,600, or (B) Selling a confirmed breakdown below the 73.5k-75k support, with a stop above 76,500. Medium-term positioning remains neutral. For HYPE, the 4-hour chart indicates a five-wave advance from the May 14th low, now showing potential exhaustion and a top warning signal near 65 USD. The core view is to watch for a potential short-term peak formation. The recommended strategy is to avoid chasing the rally and instead look for a long setup upon a pullback to the 47.5–50 USD support zone, provided clear stabilization and model confirmation signals appear. The report concludes with a detailed review of the prior BTC short trade, executed based on model s...

Continuing with our structured analytical framework this week, we dissect the current movements of Bitcoin and HYPE from multiple time dimensions, assess the struggle between buyers and sellers around key resistance and support zones, and formulate specific, actionable operational plans accordingly.

Last week's short position successfully yielded a 2.78% profit, once again validating the trading logic of 'signal-driven, strict discipline'. However, a single profitable trade does not necessarily indicate that the market direction is definitively correct – the market always retains the possibility of exceeding expectations.

The core variable for this week remains the battle between the $78,500–$79,500 resistance zone and the $73,500–$75,000 support zone. The outcome will be answered by the market itself.

Summary of Core Trading Views for This Week:

• Analysis of BTC's multi-cycle price structure. (Detailed in Part I)

• BTC price forecast and mid-term, short-term operational strategies for this week. (Detailed in Part II)

• Analysis of HYPE's hourly chart structure. (Detailed in Part III)

• HYPE price forecast and short-term operational strategy for this week. (Detailed in Part IV)

Market Verification of Last Week's Trading Strategies and Core Views:

• BTC Short-term Trading Results: Bitcoin completed one short-term short position (1x leverage) last week, achieving a profit of approximately 2.78%. (Detailed in Table I)

• Market Verification of BTC Price Forecast: In last week's article, we noted: If the price effectively breaks below the support zone of $78,500–$79,500, it will test the support strength near $75,000. The current market movement verifies our previous forecast.

I. Analysis of Bitcoin's Multi-Cycle Price Structure

1. BTC Daily Chart Structure Analysis

Bitcoin _ Daily Chart:
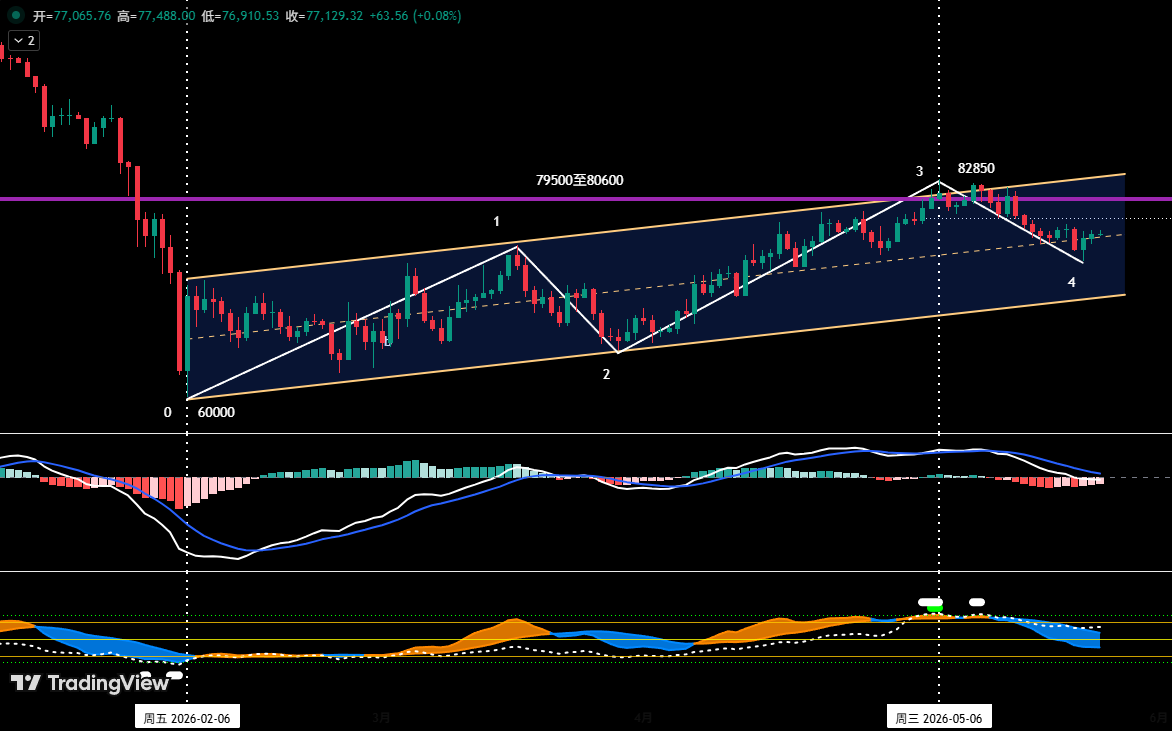
Figure 1

• As shown in (Figure 1), since establishing a stage low near $60,000 on February 6, 2026, Bitcoin's daily chart has constructed and maintained a clearly structured ascending channel: its lower boundary is formed by connecting the lows of February 6 and March 29, while the upper boundary is drawn parallel to the lower boundary through the high of March 17.

• In our April 27th weekly review, we pointed out: "The current price is facing dual pressure from the channel's upper boundary and the $79,500 to $80,600 resistance zone, making a breakthrough likely difficult". Subsequent market action confirmed this assessment. After nearly 20 days of tug-of-war between bulls and bears, although a new rebound high of $82,850 was reached on May 6, it failed to effectively break through this zone's resistance, and the price subsequently began to fluctuate downward.

From the current structure, the price has retraced from near the channel's upper boundary to the mid-channel area. If the price fails to find effective support near the mid-channel and resume its uptrend, the probability of subsequently seeking support at the channel's lower boundary is increasing.

2. In-Depth Analysis of BTC's Hourly Chart Structure

Bitcoin _ 4-Hour Chart
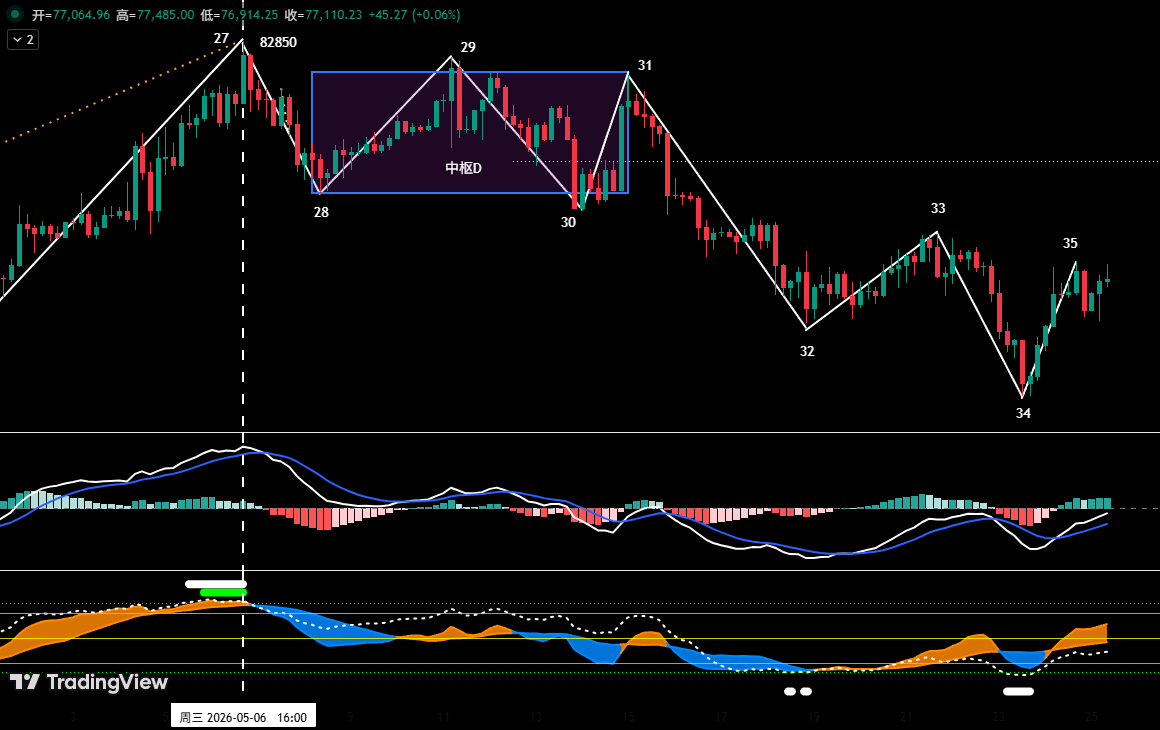
Figure 2

As shown in (Figure 2), from the May 6 high of $82,850 to the ongoing adjustment;

• On the 4-hour chart, it can be subdivided into an 8-segment adjustment structure: from "Segment 27-28" to "Segment 34-35"; Central D: Due to the overlapping of segments 28-29, 29-30, and 30-31, they constitute Central D.

• From the 4-hour chart structure, segment 34-35 is about to rebound to the $78,500–$79,500 zone. If the price faces resistance and falls back after rebounding to this zone, failing to form an effective breakthrough, the market is likely to continue the current fluctuating adjustment pattern and test the core support band of $73,500–$75,000 again.

II. Bitcoin Price Forecast and Operational Strategy for This Week

1. BTC Price Forecast for This Week:

Core View This Week: Focus on the outcome of the battle between bulls and bears for the $78,500–$79,500 resistance zone and the $73,500–$75,000 support zone.

2. Core Resistance Levels:

• First Resistance Zone: $78,500–$79,500 (near the boundaries of two central zones)

• Second Resistance Zone: $83,500–$84,500 (previous dense trading area)

3. Core Support Levels:

• First Support Zone: $73,500–$75,000 (previous key support area)

• Second Support Zone: $69,500–$70,500 (previous key support area)

4. Operational Strategy for This Week (Excluding Impact of Sudden News)

1. Mid-term Strategy:

Bitcoin _ Daily Chart: (Position Monitoring Model)
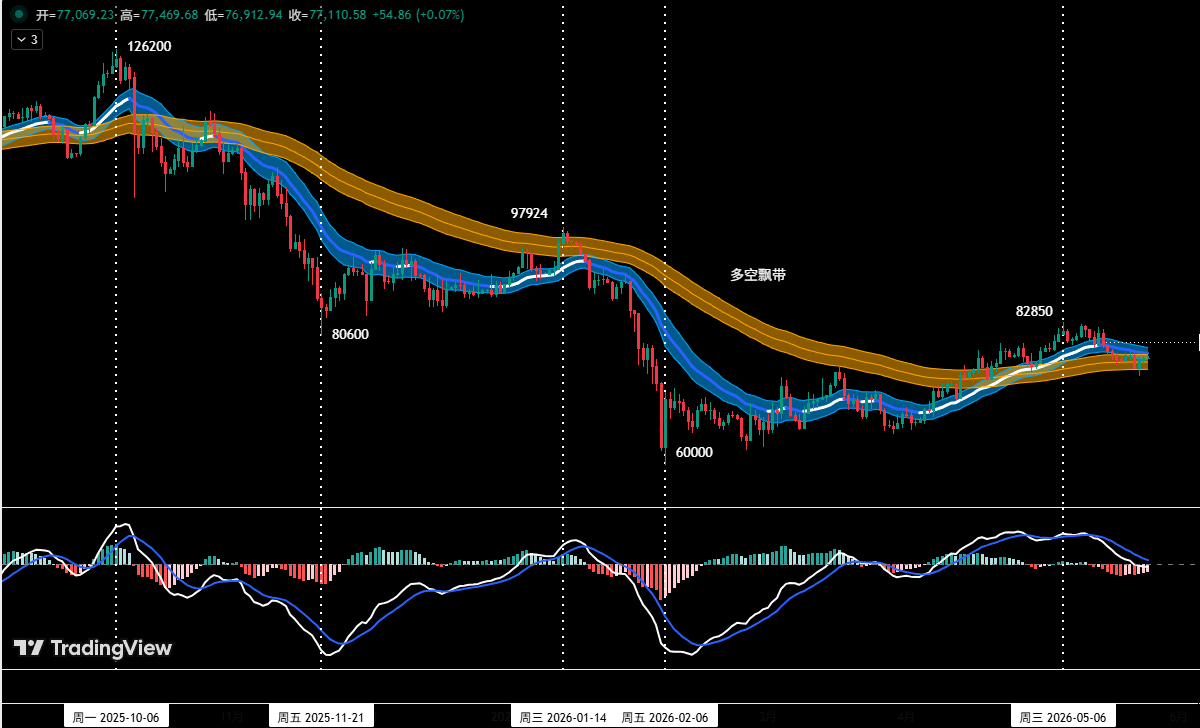
Figure 3

Position Monitoring Model: As shown in (Figure 3), based on trading rules, the market's mid-term direction is not yet clear. This week's mid-term strategy is to maintain a no-position, wait-and-see approach.

2. Short-term Strategy: Utilize 30% of capital, set stop-loss points, and look for "spread" opportunities based on support and resistance levels. (Using 30-minute/60-minute as the operational cycle).

3. In short-term operations, to dynamically respond to complex market developments, we have prepared two specific operational plans in advance: Plan A/B.

Plan A: Rebound Meets Resistance, Sell High.

• Entry: When the price rebounds to the $78,500–$79,500 zone and encounters resistance, combined with a top signal from the quantitative model, a short position below 30% can be established.

• Risk Control: Initial stop-loss set above $80,600.

• Exit: When the price adjusts near important support levels combined with model signals, gradually close the position to take profits.

Plan B: Effectively Breaks Support, Follow the Trend Short.

• Entry: When the price effectively breaks below the $73,500–$75,000 support zone combined with a model top signal, a short position below 30% can be established.

• Risk Control: Initial stop-loss set above $76,500.

• Exit: When the price falls to important support levels combined with model signals, gradually close the position to take profits.

III. HYPE Price Structure Analysis

HYPE_4-Hour Chart
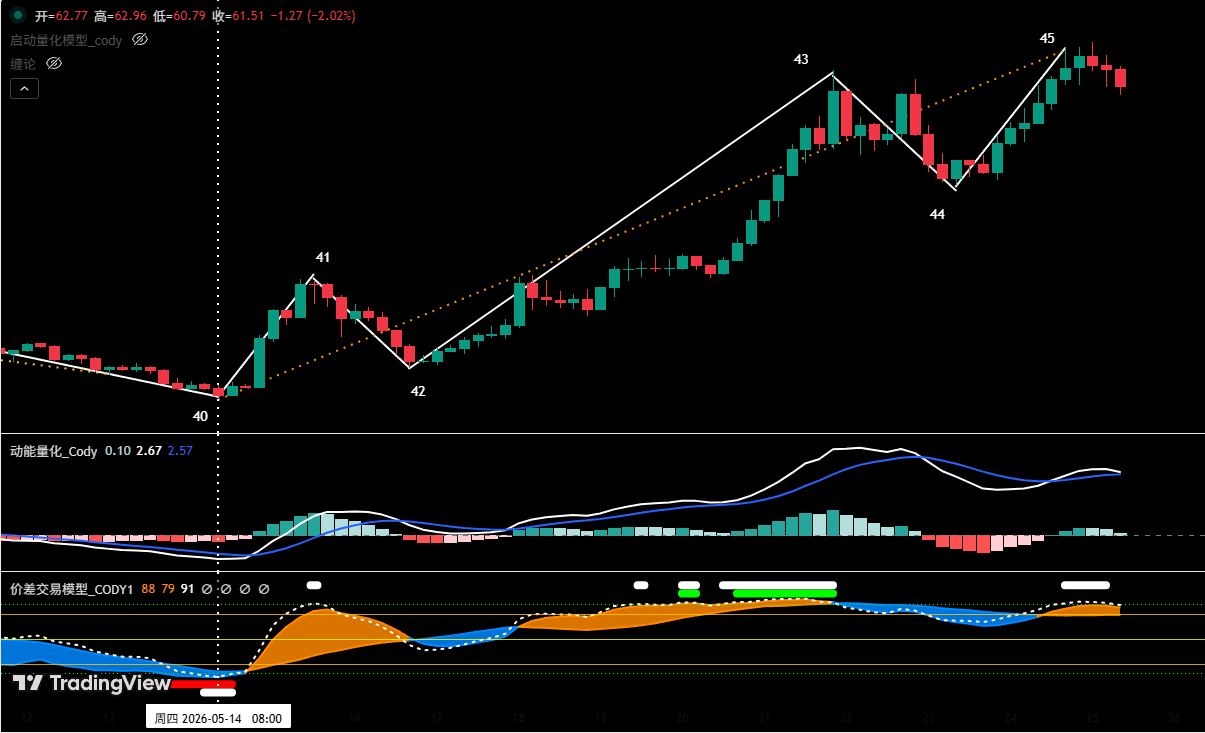
Figure 4

1. As shown in (Figure 4), the uptrend in HYPE starting from the May 14 low of $38.14 can be divided into a five-segment structure on the 4-hour chart: segments 40-41, 41-42, 42-43, 43-44, 44-45.

2. Our proprietary "Spread Trading Model" indicates that near endpoint 45, a top warning signal (white dot) has been triggered.

3. From the "Momentum Quantification Model" perspective, the rising segment (44-45) near $65 has shown signs of weakening upward momentum.

4. If the price forms a momentum bearish divergence state at "endpoint 45" and resonates with the top warning signal from the "Spread Trading Model", the probability of the price forming a short-term high here increases significantly.

IV. HYPE Price Forecast and Short-Term Operational Strategy for This Week

1. HYPE Price Forecast for This Week:

Core View on HYPE This Week:

• Observe whether "endpoint 45" can form a short-term high since the rise began on May 14.

• If a short-term high is formed, subsequently, look for short-term long opportunities when the price retraces to key support areas (e.g., $47.5 to $50) and shows clear signs of stabilization.

2. HYPE Short-Term Operational Strategy for This Week: (Buy on Support)

Currently, the strategy of "avoid blind chasing of highs, buy on dips" should be followed. If the price retraces to the $47.5 to $50 zone, finds support, and shows stabilization signals, combined with bottom signals triggered by both models, consider a light long position. Position size must be controlled below 30%, and strict stop-loss discipline must be maintained.

V. Operational Review

1. Short-Term Operation Review:(See Table I)

We strictly followed the operational plan. Based on trading signals from our proprietary "Spread Trading Model" and "Momentum Quantification Model", we completed one short-term (short) operation last week, achieving a trading profit of 2.78%.

1. Bitcoin Short-Term Trading Details Summary: (Leverage*1x)
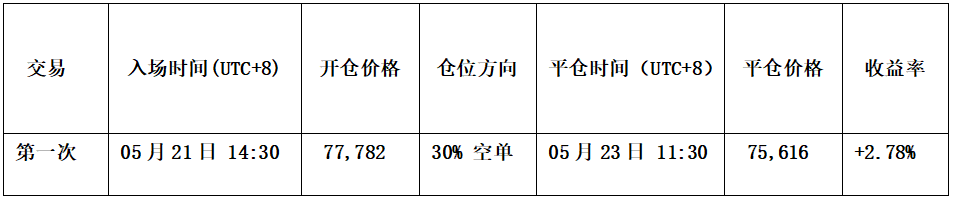
Table I

2. Short-Term Trading Review: (See Figure VI)

• Entry Strategy:

a. When the price rebounded near $78,500, encountered resistance, showed pressure signals, and the candlestick formed a "top reversal" bearish signal;

b. The "Spread Trading Model" triggered a top warning signal (white dot), and the "Momentum Quantification Model" formed a momentum bearish divergence signal.

Therefore, we established a 30% short position at $77,782.

• Exit Strategy:

a. When the price fell near $75,000 and found support, and the candlestick formed a "bottom reversal" signal;

b. The "Spread Trading Model" triggered a strong bottom warning signal (red dot + white dot), resonating with a bottom signal from the "Momentum Quantification Model".

Therefore, we closed all positions near $75,616.

• Summary: This trade successfully yielded a profit of approximately 2.78%.

BTC_30 Minute Chart: (Momentum Quantification Model + Spread Trading Model)
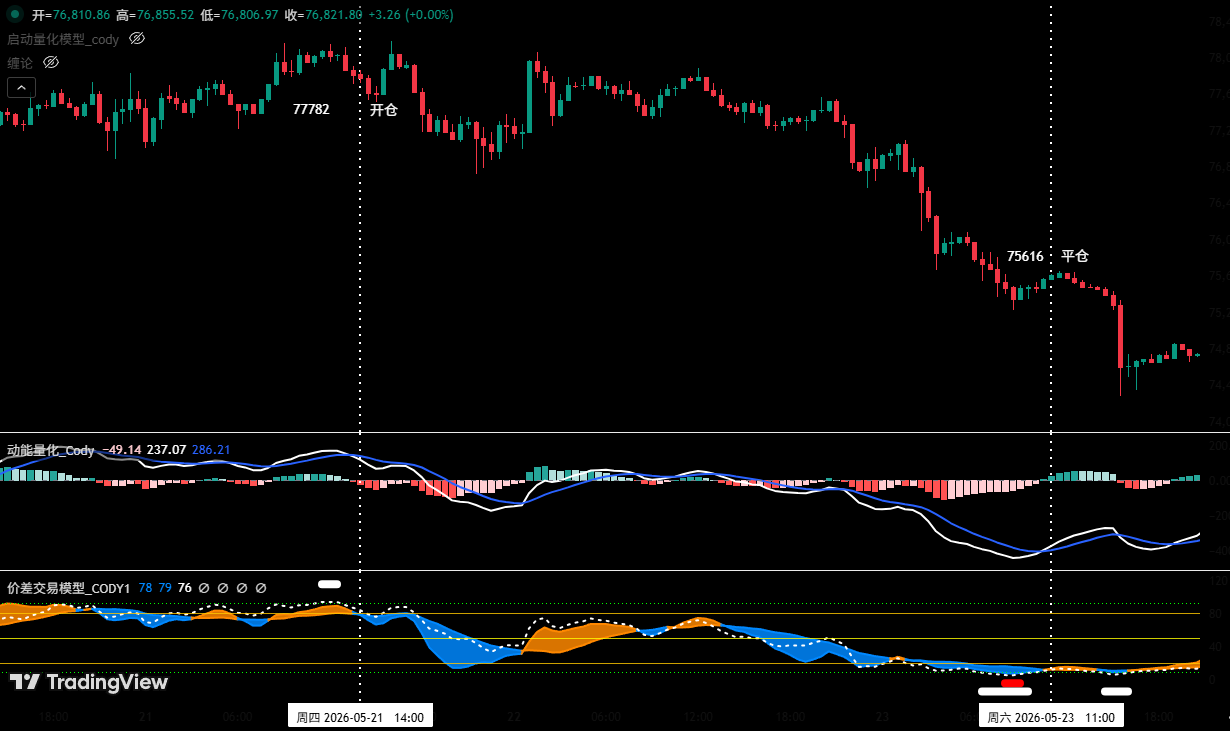
Figure V (Short-Term Trading Illustration)

VI. Special Note:

1. When opening a position: Immediately set the initial stop-loss point.

2. When profit reaches 1%: Move the stop-loss to the entry cost price (break-even point) to ensure capital safety.

3. When profit reaches 2%: Move the stop-loss to the 1% profit level.

4. Continuous Tracking: Thereafter, for every additional 1% profit, move the stop-loss up by 1%, dynamically protecting and locking in profits.

Financial markets are ever-changing; all market analysis and trading strategies require dynamic adjustment. All views, analytical models, and operational strategies mentioned in this article are derived from personal technical analysis, intended solely for personal trading log purposes, and do not constitute any investment advice or operational basis. The market carries risks; investment requires caution. Please do not make decisions based on this.


Perguntas relacionadas

QAccording to the article's analysis, what are the two main resistance and support zones for Bitcoin this week?

AThe core resistance zone is 78,500-79,500 USD, and the core support zone is 73,500-75,000 USD.

QWhat was the primary technical reason for the author's successful short trade on Bitcoin the previous week?

AThe trade was executed based on a confluence of signals: the price encountered resistance near 78,500 USD forming a top reversal candlestick pattern, and both the author's 'Price Difference Trading Model' and 'Dynamic Energy Quantification Model' triggered top warning signals, including momentum divergence.

QBased on the analysis, what is the key condition for HYPE to present a potential short-term buying opportunity?

AA short-term buying opportunity for HYPE may arise if the price pulls back to the 47.5 to 50 USD support zone, shows clear signs of stabilization, and is confirmed by bottom signals from the author's trading models.

QWhat is the author's current medium-term (midline) strategy for Bitcoin, as indicated by their 'Position Monitoring Model'?

AAccording to the 'Position Monitoring Model', the medium-term market direction is not yet clear. Therefore, the author is maintaining a strategy of staying out of the market (holding no medium-term positions) and observing.

QIn the article's proposed short-term trading plans for Bitcoin, what are the two main scenarios (Plan A and Plan B)?

APlan A: Sell short on rallies if the price rebounds to the 78,500-79,500 USD resistance zone and encounters selling pressure. Plan B: Sell short on breakouts if the price effectively breaks below the 73,500-75,000 USD support zone.

Leituras Relacionadas

Metrics Ventures Market Watch: The Brewing Storm

In the past month, the market has been actively trading contrasting expectations, balancing global supply chain disruptions fueling re-inflation against both actual and anticipated (Walsh) interest rate hikes. This volatility has impacted commodities and most equities, though tech has temporarily benefited from concentrated short-term liquidity. Fundamentally, as previously analyzed regarding the Strait of Hormuz situation, the US faces deep-seated balance sheet issues beyond what any single Fed chair can resolve. Hypotheses around a figure like Walsh could only materialize if AI fundamentally reshapes production relations. Until then, most non-AI-leading nations (effectively all except the US and China) risk fiscal and monetary policy collapse, rendering the identity of the Fed chair ultimately irrelevant. For crypto assets, there is currently no clear role in these dominant narratives. The market remains strongly capped by the 200-day moving average. While trends may shift from "anything but AI" to "anything but mines," this phase is dominated by the silicon vs. carbon (AI vs. traditional) dichotomy, leaving little room for crypto—though its time will come. **Market Overview & Commentary** The crypto market lacks significant catalysts beyond hype, plagued by low volume and scarce innovation, with clear technical resistance. Currently, crypto struggles for attention as global focus lies elsewhere. Assets like gold, oil, and grains are more direct hedges against supply-chain-driven inflation/stagflation. Bitcoin needs more time for capitulation and consolidation; this reset is expected to last until at least Q4 2026. Looking ahead, three factors will likely drive future market volatility: 1. Whether Walsh repeats the patterns of predecessors like Bassant or Musk, shifting stance into a new policy cycle. 2. The market underestimates the severity of global supply chain damage and the prolonged time needed for repair, which will eventually lead to recognition of acute resource shortages and price swings. 3. AI non-beneficiary, high-inflation nations (e.g., UK, Japan) will face severe fiscal and monetary crises. Rapid AI-driven displacement could trigger a collapse of existing credit and welfare systems. Ultimately, the market may realize that an AI bubble burst could spark contagious sovereign credit crises. The monetary and fiscal responses to such a scenario could serve as the ultimate catalyst for Bitcoin's next major bull run.

marsbitHá 51m

Metrics Ventures Market Watch: The Brewing Storm

marsbitHá 51m

Insiders Betting on Musk Are Reaping 'Historic Returns'

The largest IPO in history is imminent as SpaceX, led by Elon Musk, is set to price its offering on June 12. At a targeted valuation near $2 trillion, this event will mint new billionaires from Musk's inner circle of long-time allies, rewarding their loyalty with unprecedented returns. Key beneficiaries include Antonio Gracias, Musk's close friend and confidant, who holds a 7.3% stake potentially worth over $140 billion, making him the second-largest individual shareholder. Gwynne Shotwell, President and COO since 2002, holds shares valued at roughly $2 billion. Bret Johnsen, the CFO, holds stock worth approximately $1.4 billion. Luke Nosek, a PayPal co-founder and early investor, stands to gain about $5.3 billion. The IPO filing also reveals complex and controversial financial arrangements. SpaceX has guaranteed nearly $20 billion in payments from xAI's subsidiary to Gracias's Valor Equity Partners for AI hardware leases—deals auditors flagged as "failed sale-leaseback" transactions, forcing SpaceX to record them as debt. Despite rapid revenue growth, SpaceX is not profitable, posting a $49 billion loss in 2025 and a $4.3 billion loss in Q1 2026. Capital expenditures are soaring, with over 60% directed toward AI. Public investors will inherit these losses, significant debts, and a governance structure heavily controlled by insiders, including a provision granting Musk up to a billion additional shares if one million people live on Mars.

链捕手Há 53m

Insiders Betting on Musk Are Reaping 'Historic Returns'

链捕手Há 53m

Ethereum Reduced to a Chinese Concept Stock

The article titled "Ethereum Becomes a Chinese Concept Stock" presents a critical analysis of Ethereum's perceived decline in market confidence and its structural parallels to Chinese companies listed on US stock exchanges. It begins by noting significant sell-offs by early investors like Wanxiang and key figures like Bankless's Hoffman in 2026, despite Ethereum's strong fundamental activity. The piece questions the erosion of trust in Vitalik Buterin and the Ethereum Foundation (EF), arguing that while other ecosystems have faced founder controversies, Ethereum's issues stem from its internal governance model. The author draws a direct comparison to "China concept stocks," which are Chinese businesses operating globally but reliant on foreign capital and listings. Similarly, Ethereum, funded early by Chinese capital like Wanxiang, developed a strong institutional framework from its IXO to its PoS transition. The core problem, according to the article, is a leadership vacuum regarding price and direction. Vitalik's move to make the EF smaller and less active is framed as a mistake. While he advocates for ETH as a "commodity," the ecosystem lacks a clear entity to steward its price stability, creating tension within the PoS system, as seen with Lido's challenges. The narrative suggests that excessive abstraction and a hands-off approach from the EF have left the community adrift, contrasting with more proactive foundations like Solana's. The article then examines emerging technical narratives for Ethereum: privacy (ZK-proofs), AI integration, and a refocus on Layer-1. However, it observes a shift from Ethereum leading as a "world computer" to merely adapting to trends like AI, where crypto-native projects are finding success independently of Ethereum. The piece posits that Ethereum's unique value in an increasingly fragmented world may be as a permissionless, global financial testing ground—a neutral platform amid geopolitical tensions. In conclusion, it asserts that Ethereum's fate mirrors that of China concept stocks: an asset born from one region (conceptually "A"), funded by another ("B"), and dependent on "B" for exit liquidity. While Ethereum's "golden age" may be over, and selling pressure from early backers will continue, it remains positioned as a critical linkage point in a divided global landscape, standing at a new, albeit uncertain, starting point.

marsbitHá 1h

Ethereum Reduced to a Chinese Concept Stock

marsbitHá 1h

AI Agents Fundamentally Transform Web3 Gaming: From the Rugpull Bakery Bot Controversy to the New Agent Paradigm in 2026

AI Agents Are Redefining Web3 Gaming: From the Rugpull Bakery Bot Controversy to the 2026 Agentic Paradigm The recent controversy in Rugpull Bakery, a competitive baking game on Abstract chain, highlighted a pivotal shift. Player complaints about unfair bot automation in Season 2 led developers to not ban them, but instead formally integrate AI agents as core gameplay in Season 3, providing official guides (skill.md, agent.json). This move signals Web3 gaming's transition into the "Agentic Gaming" era, where AI agents are sovereign entities with independent strategy and economic rights, moving beyond simple automation. By 2026, AI agent integration has evolved into three core models reshaping the ecosystem: 1. **Autonomous Competitors & Economic Entities:** Agents act as independent players. Examples include TEN Protocol's poker-playing agents, AI Arena's trainable NFT fighters, Satoshi Strike Force's "Digital Athletes" trained on player data, and Somnia's "Agentic L1" blockchain providing native infrastructure for millions of autonomous agents. 2. **Modular Infrastructure & Programmable Environments:** Games like EVE Frontier enable "server-side modding," allowing AI agents to program game world logic directly into structures like smart storage, turrets, and stargates via Smart Assemblies. Coupled with standards like ERC-8183, which enables autonomous job creation and payment between agents, in-game infrastructure gains a "commercial soul." 3. **Hybrid Companions & Dynamic Adaptive Worlds:** This model focuses on human-AI collaboration. In Parallel Colony, players guide highly autonomous AI Avatars with unique personalities and goals. Illuvium plans to use AI to transform NPCs into dynamic, context-aware entities that create personalized, emergent narratives. The conclusion is clear: blocking automation is futile. The future lies in leveraging blockchain's transparency and programmability to empower AI agents as first-class citizens. Web3 gaming is shifting from inefficient human labor to efficient algorithmic interplay and emergent intelligence, creating a "post-human" digital frontier where players become commanders and symbiotic partners in a new socioeconomic experiment.

marsbitHá 1h

AI Agents Fundamentally Transform Web3 Gaming: From the Rugpull Bakery Bot Controversy to the New Agent Paradigm in 2026

marsbitHá 1h

Trading

Spot
Futuros

Artigos em Destaque

Como comprar HYPE

Bem-vindo à HTX.com!Tornámos a compra de Hyperliquid (HYPE) simples e conveniente.Segue o nosso guia passo a passo para iniciar a tua jornada no mundo das criptos.Passo 1: cria a tua conta HTXUtiliza o teu e-mail ou número de telefone para te inscreveres numa conta gratuita na HTX.Desfruta de um processo de inscrição sem complicações e desbloqueia todas as funcionalidades.Obter a minha contaPasso 2: vai para Comprar Cripto e escolhe o teu método de pagamentoCartão de crédito/débito: usa o teu visa ou mastercard para comprar Hyperliquid (HYPE) instantaneamente.Saldo: usa os fundos da tua conta HTX para transacionar sem problemas.Terceiros: adicionamos métodos de pagamento populares, como Google Pay e Apple Pay, para aumentar a conveniência.P2P: transaciona diretamente com outros utilizadores na HTX.Mercado de balcão (OTC): oferecemos serviços personalizados e taxas de câmbio competitivas para os traders.Passo 3: armazena teu Hyperliquid (HYPE)Depois de comprar o teu Hyperliquid (HYPE), armazena-o na tua conta HTX.Alternativamente, podes enviá-lo para outro lugar através de transferência blockchain ou usá-lo para transacionar outras criptomoedas.Passo 4: transaciona Hyperliquid (HYPE)Transaciona facilmente Hyperliquid (HYPE) no mercado à vista da HTX.Acede simplesmente à tua conta, seleciona o teu par de trading, executa as tuas transações e monitoriza em tempo real.Oferecemos uma experiência de fácil utilização tanto para principiantes como para traders experientes.

286 Visualizações TotaisPublicado em {updateTime}Atualizado em 2026.04.28

Como comprar HYPE

Discussões

Bem-vindo à Comunidade HTX. Aqui, pode manter-se informado sobre os mais recentes desenvolvimentos da plataforma e obter acesso a análises profissionais de mercado. As opiniões dos utilizadores sobre o preço de HYPE (HYPE) são apresentadas abaixo.

活动图片