The stablecoin narrative is shifting from a liquidity engine toward a utility framework.
The logic is simple: As adoption matures, stablecoins are increasingly being integrated into cross-border payments, institutional transfers, DeFi applications, and 24/7 global settlement networks.
In essence, the focus is shifting from on-chain liquidity provision toward real-world financial utility.
June’s data provides a clear confirmation of this shift.
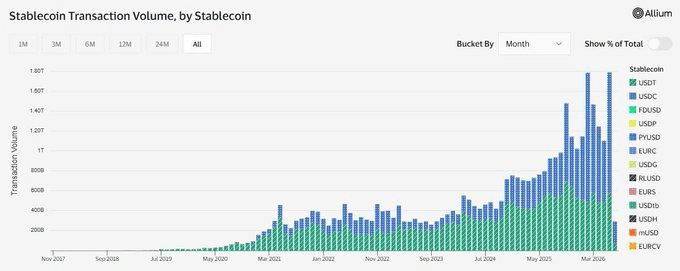
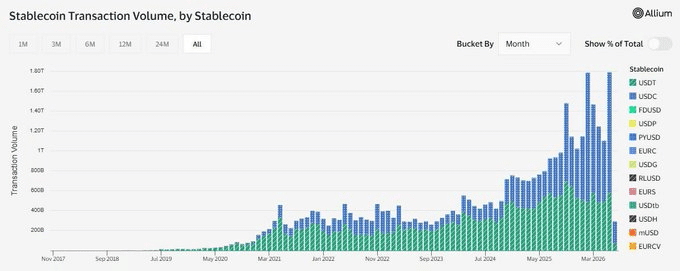
As shown in the chart below, adjusted stablecoin transaction volume reached a record $1.79 trillion during the month, representing a 63% increase from May and a 125% year-over-year surge. This acceleration highlights the growing demand for stablecoins as a settlement layer rather than merely a liquidity mechanism within crypto markets.
This transition directly increases the strategic importance of Layer 1 networks.
As stablecoin activity grows, on-chain liquidity expands, making these networks more attractive for institutions.
Toncoin [TON], for example, is seeing strong momentum among major blockchain networks, with its native stablecoin supply increasing 8% over the past week to more than $810 million. This highlights the growing competition among Layer 1 networks to capture stablecoin-driven adoption.
However, at the broader market level, the rise in stablecoin transaction volume during June occurred alongside a risk-off mood.
The market ended the month down 18%+, marking the largest monthly capital outflow since February’s 20% decline. This creates a notable divergence within the stablecoin sector, highlighting a critical trend to monitor as the market navigates shifting liquidity conditions heading into H2.
Stablecoin adoption expands as USDC and USDT face new pressure
The stablecoin market is entering a new phase, where utility is diverging from liquidity.
Over the past two months, the combined market cap of USDT and USDC has declined by nearly $11 billion, signaling a contraction in stablecoin liquidity. This trend contrasts with June’s record $1.79 trillion in stablecoin transaction volume, highlighting a growing gap between usage and capital flows.
To put this into perspective, despite higher transaction activity, the total stablecoin market cap fell 2%+ during the month, marking the largest monthly outflow since January and resulting in nearly $8 billion in stablecoin outflows. In essence, stablecoin usage is increasing, but liquidity is moving in the opposite direction.
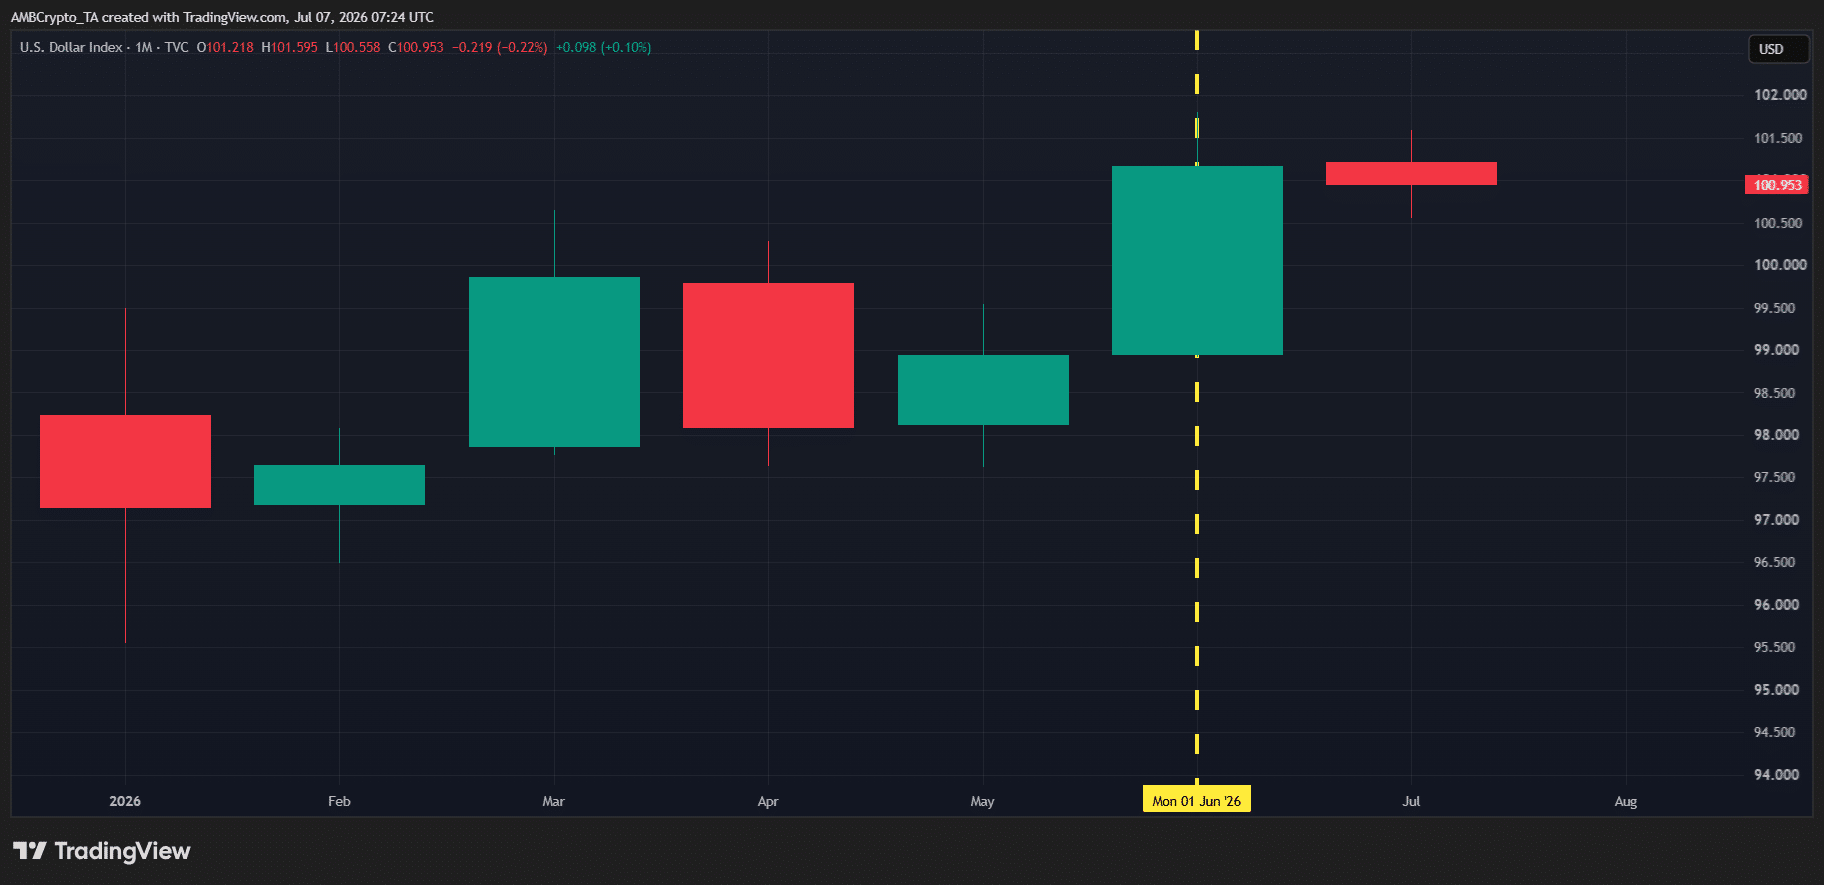
This divergence becomes more important when viewed from a macro perspective.
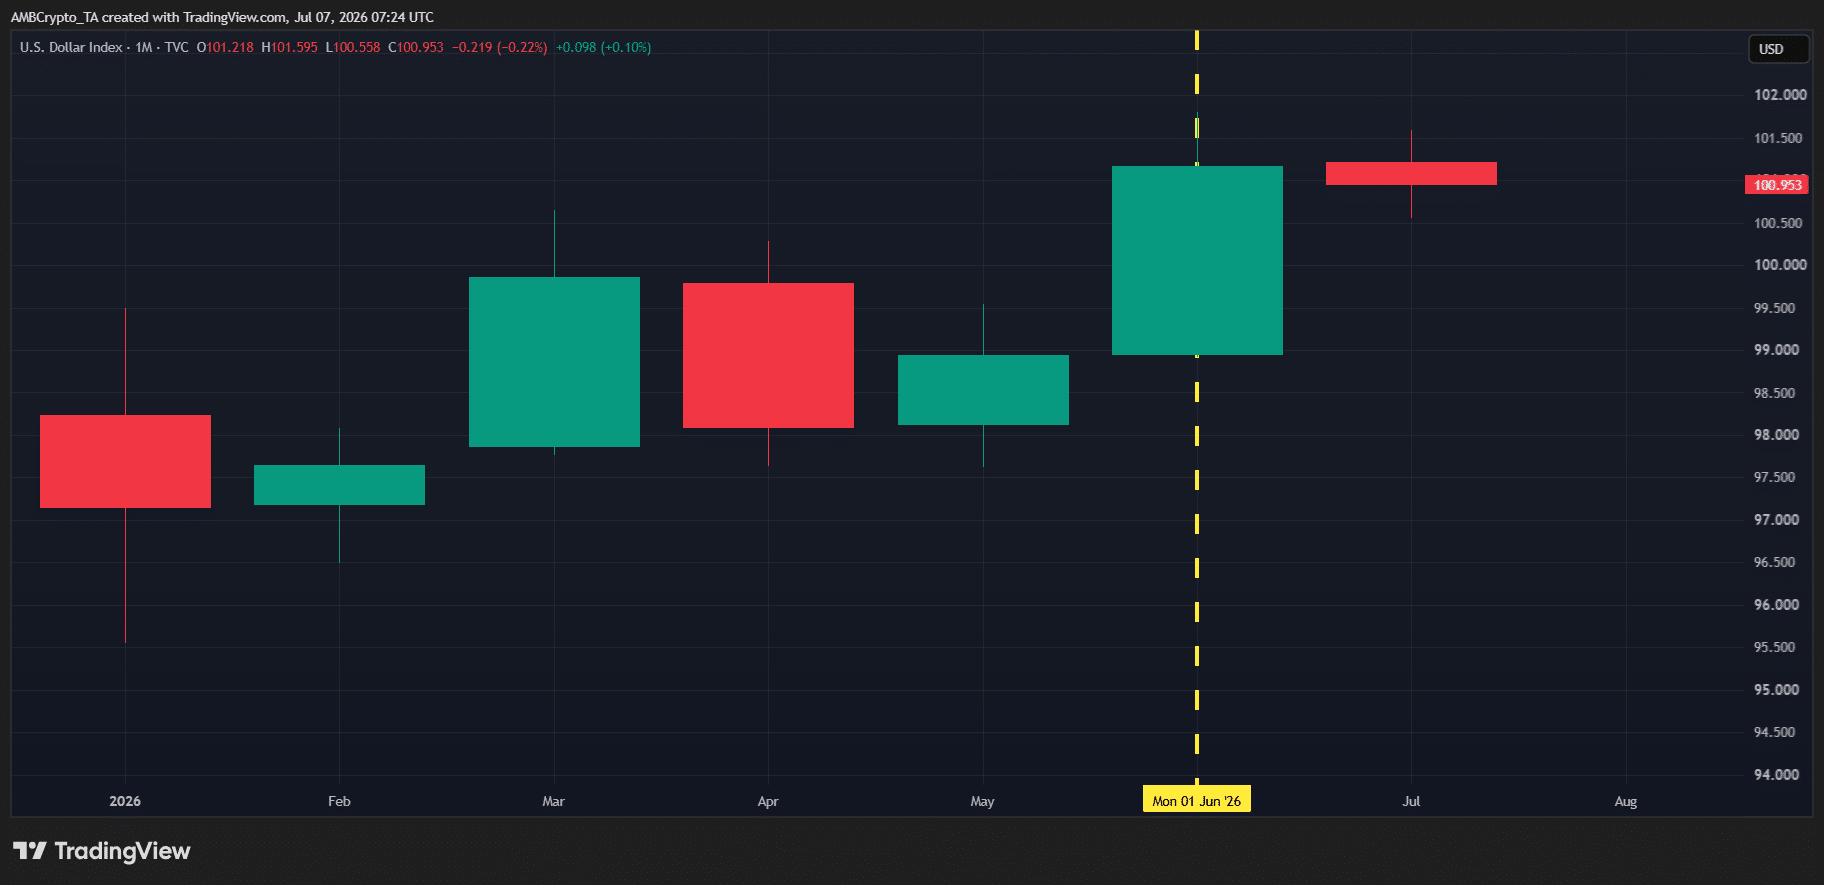
As the chart above shows, the U.S. Dollar Index (DXY) has strengthened, posting back-to-back monthly gains, with June alone rising more than 2.25%.
The stronger dollar has pressured global currencies, including the Japanese yen, which has weakened to multi-decade lows.
Against this macro backdrop, stablecoin utility could continue to strengthen as demand for dollar-based assets remains elevated.
However, the decline in USDT and USDC market cap highlights a growing gap between stablecoin usage and liquidity. If this divergence continues, it could become a key bearish factor for the crypto market heading into H2.
Final Summary
- Stablecoin activity is rising, but falling USDT and USDC market caps point to weaker liquidity.
- A stronger dollar is supporting stable demand, but lower liquidity could create risks for crypto markets.