USDT Supply Shrinks by $5.5 Billion While Stablecoin Turnover Hits Record High

cryptonews.ruPublicado em 2026-07-29Última atualização em 2026-07-29

Resumo

The supply of stablecoins has contracted for the first time in years, with total market capitalization falling 4.3% from its May peak to $308.5 billion. Despite this decline, June saw a record $1.83 trillion in adjusted transaction volume for stablecoins, a 60% increase from May. This divergence suggests a shift in usage patterns: less capital is sitting idle, while the remaining supply circulates more rapidly through payment and trading systems. Specifically, the supply of Tether's USDT decreased from approximately $189.54 billion to $184 billion between May 1 and July 29, while Circle's USDC supply fell from $77.27 billion to $72.41 billion. Part of this capital appears to have moved into tokenized Treasury products, a sector whose value has grown to over $16 billion, partly driven by regulations like the 2025 GENIUS Act that prohibit interest payments on payment-focused stablecoins. Transaction velocity is emerging as a key metric, with stablecoins now turning over about six times per month—double the rate from two years ago. USDC, despite having a smaller supply than USDT, processed about $1.21 trillion in adjusted volume in June, leading in settlement activity. While a significant portion of on-chain volume may not represent genuine economic payments, identifiable real-world payments have grown sharply, reaching an estimated $390 billion in 2025. The data indicates stablecoins are evolving from static collateral into active financial infrastructure.

The total supply of stablecoins has declined for the first time in years, but this decrease may not indicate as much about demand as it seems.

The overall market capitalization has fallen by approximately 4.3% from its May peak of $322.41 billion to $308.5 billion. In June alone, the drop amounted to $7.7 billion—the most significant monthly decline since the Terra crash in May 2022.
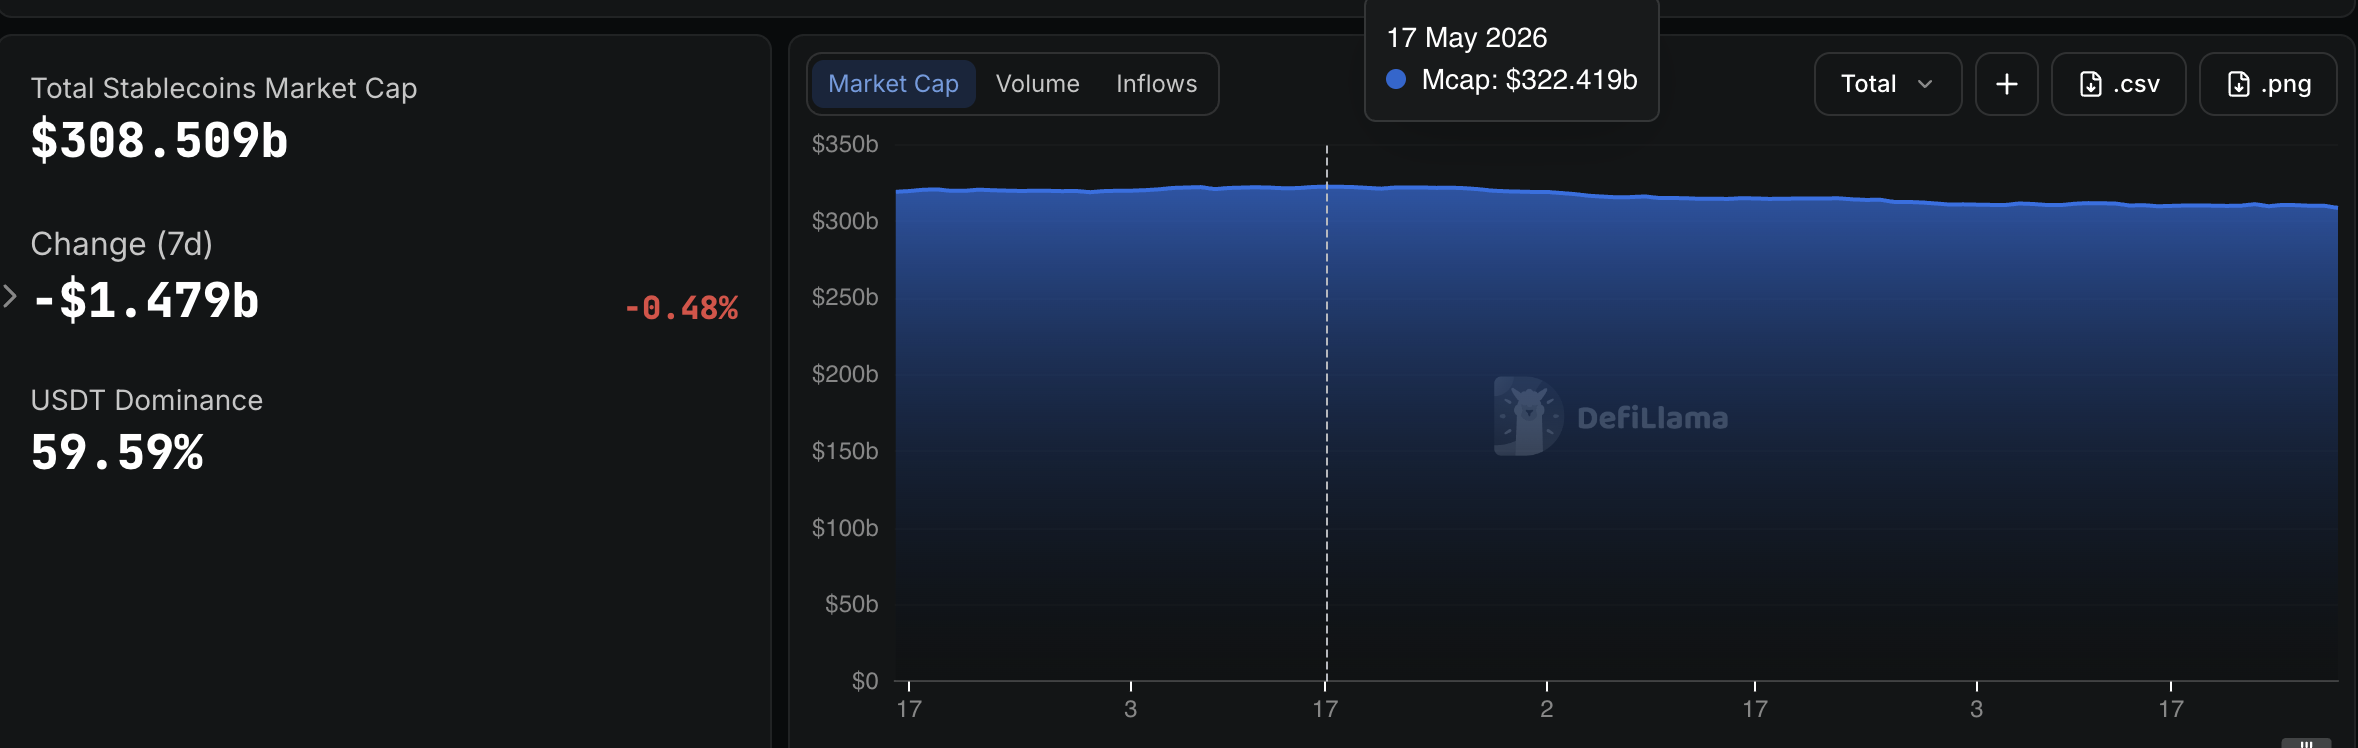
Source: Defillama

At the same time, the adjusted transaction volume for stablecoins reached a record $1.83 trillion in June. This is 60% higher than May's figure and more than double the level recorded a year ago.

This discrepancy points to a change in the nature of stablecoin usage. Fewer dollars are sitting idle, while the remaining supply is moving faster through payment, trading, and settlement systems.
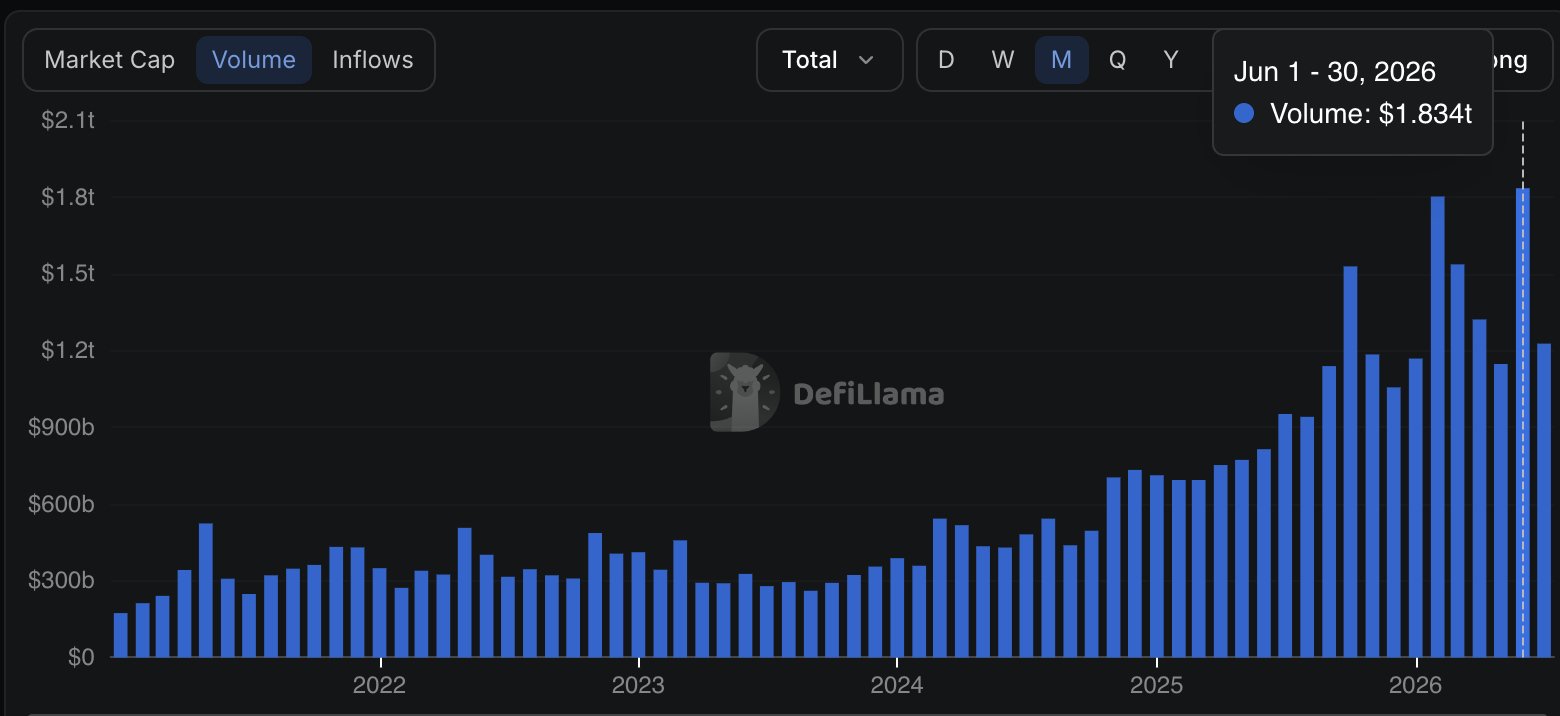
Source: Defillama

Idle Balances Move to Yield-Bearing Assets

The supply of $USDT by Tether decreased from $189.54 billion as of May 1 to approximately $184 billion as of July 29. Over the same period, the supply of $USDC by Circle dropped from $77.27 billion to $72.41 billion. This reduction remains moderate compared to the market's 26% crash in 2022.

Apparently, some capital has flowed into tokenized Treasury products, which offer yields not available for payment stablecoins. According to rwa.xyz, the volume of this sector has grown to over $16 billion compared to roughly $11 billion in March.
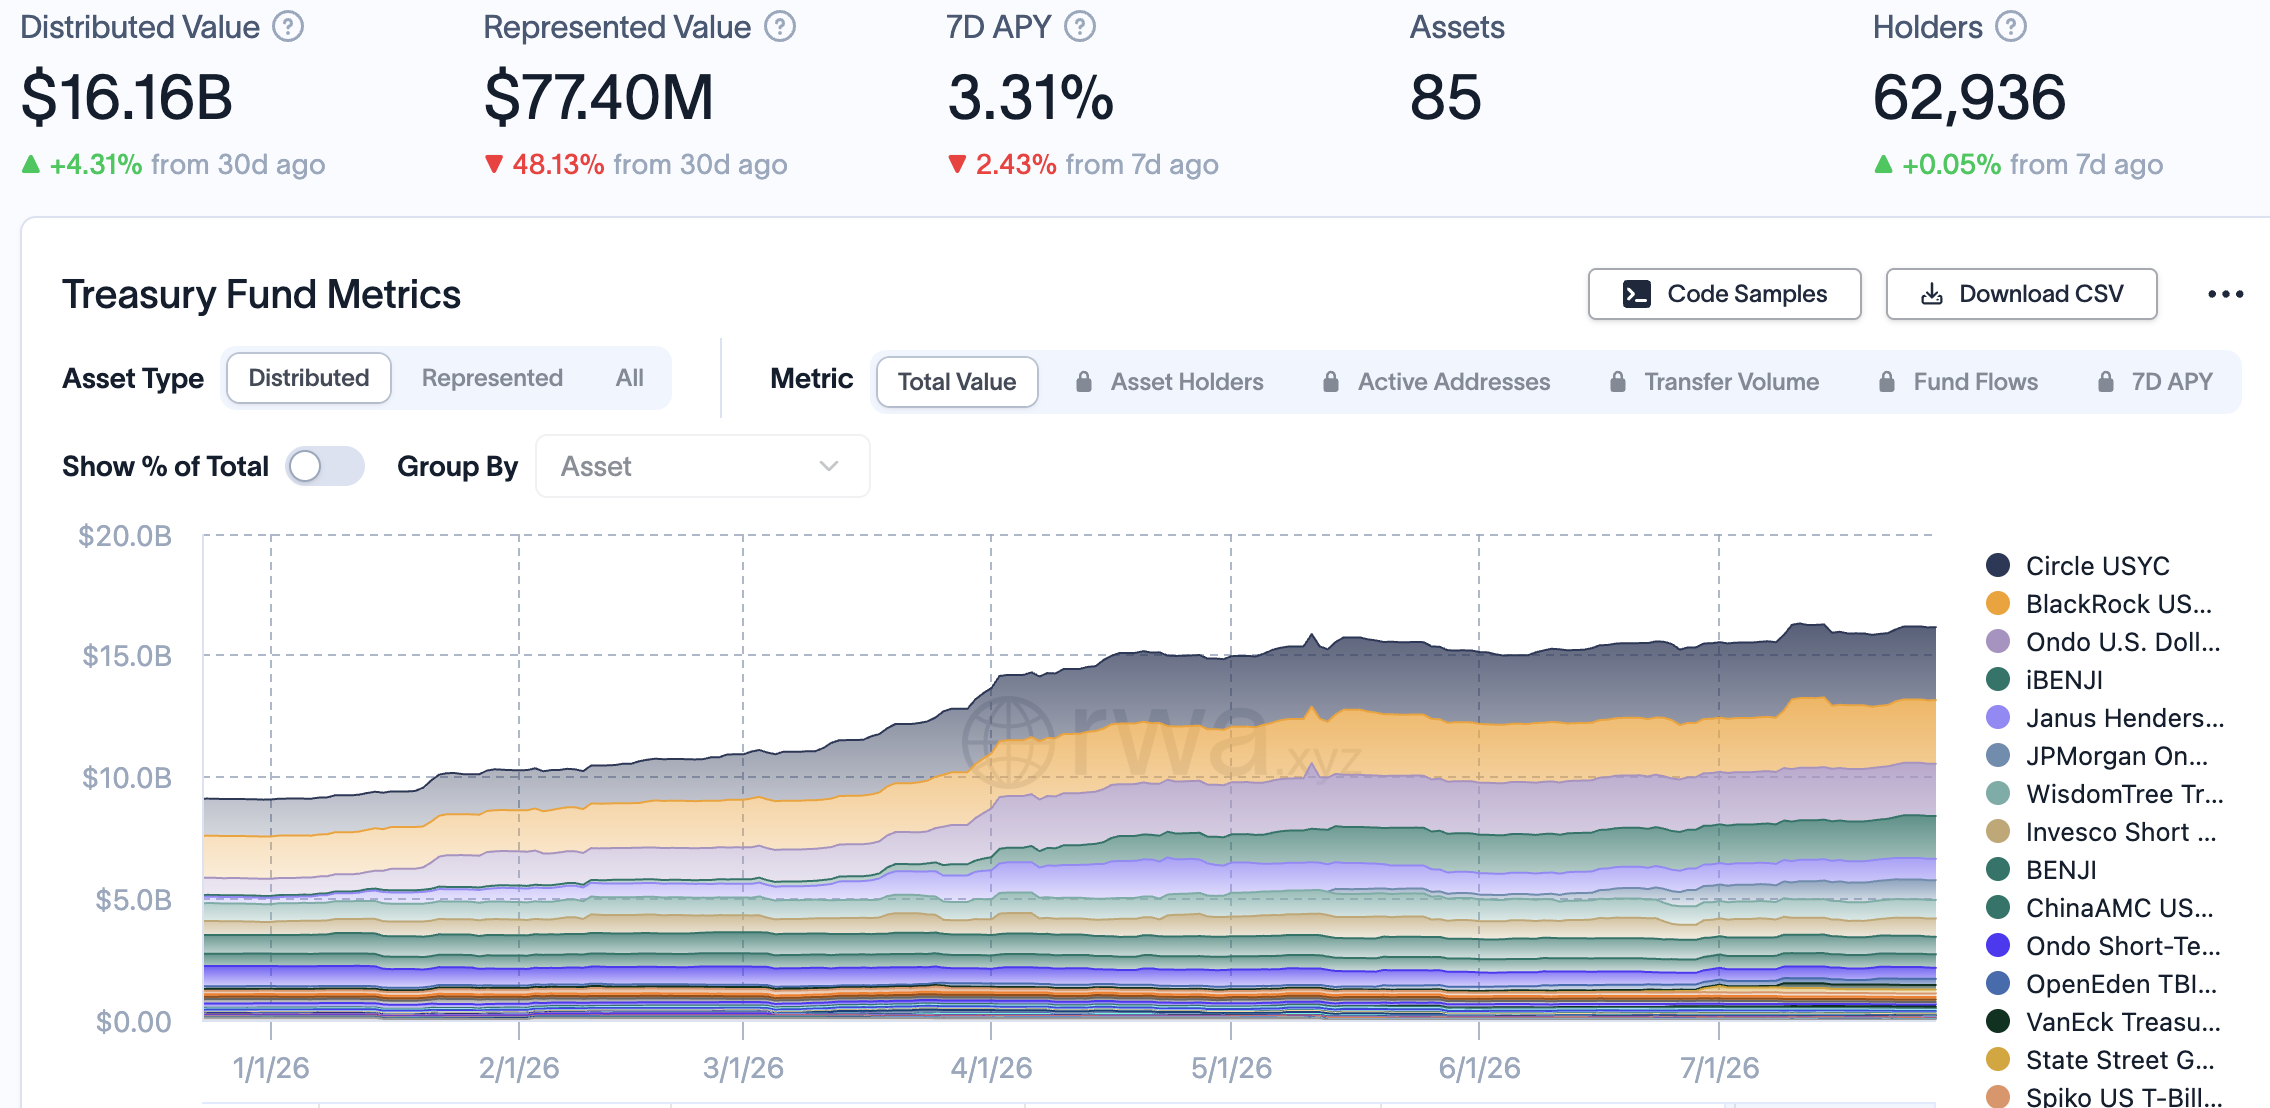
Source: rwa.xyz

The GENIUS Act, signed in July 2025, prohibits issuers from paying interest directly on payment stablecoins. This structure encourages treasurers to keep savings in tokenized funds, holding stablecoins only when payments need to be made.

Turnover Velocity Replaces Market Cap as Key Metric

According to a Standard Chartered report from March 2026, stablecoin turnover is now about six times per month. This is roughly double the rate from two years ago. Visa data also shows that each dollar in a stablecoin moves much more frequently than a dollar stored in an ordinary U.S. bank account.

$USDC has become the leading settlement asset, despite its supply being smaller than that of $USDT. In June, it processed about $1.21 trillion in adjusted volume, compared to $576 billion for $USDT.

However, not all blockchain transfers represent real economic payments. Automated activity, exchange transfers, and wash trades can inflate the raw figures.

According to a Forbes report, estimates by McKinsey and Artemis suggest that identifiable real-world payments accounted for about $390 billion in 2025. Business-to-business transactions made up $226 billion, while payroll and remittance payments were approximately $90 billion.

The share of payments is still small but has grown sharply over two years.

Stablecoin market capitalization still matters, as issuers earn interest on reserves. However, for networks, processors, and financial platforms, transaction frequency may become a more valuable metric. June data indicates that stablecoins are transforming from 'frozen' collateral into active financial infrastructure.


Perguntas relacionadas

QAccording to the article, what is the key change in the nature of stablecoin usage indicated by the data?

AThe data indicates a change in the nature of stablecoin usage: fewer dollars are sitting idle, while the remaining volume is moving faster through payment, trading, and settlement systems. This is shown by the supply shrinking while transaction turnover hits a record high.

QWhat is one major reason suggested in the article for the migration of capital away from payment stablecoins like USDT and USDC?

AOne major reason is the flow of capital into tokenized Treasury products, which offer yields not available to payment stablecoins. This was further encouraged by the GENIUS Act signed in July 2025, which prohibits issuers from paying interest directly on payment stablecoins.

QWhy does the article suggest that transaction turnover (velocity) is becoming a more valuable metric than market capitalization for certain entities?

AFor networks, processors, and financial platforms, the frequency of transactions (turnover velocity) may become a more valuable metric than market capitalization because it reflects active usage and utility within the financial infrastructure, rather than just stored value.

QWhich stablecoin processed a higher adjusted transaction volume in June, USDT or USDC, despite having a smaller supply?

AUSDC processed a higher adjusted transaction volume in June (approximately $1.21 trillion) compared to USDT ($576 billion), even though USDC's supply is smaller than that of USDT.

QWhat does the article cite as a potential factor that can inflate raw on-chain transaction figures?

AThe article states that automated activity, exchange transfers, and wash trading can inflate the raw on-chain transaction figures, meaning not all blockchain transfers represent real economic payments.

Leituras Relacionadas

E Fund "Quits Drinking"

"Yi Fang Da 'Gives Up Alcohol'" - Summary The article analyzes the recent portfolio adjustments of star fund manager Zhang Kun, focusing on his flagship funds, the Yi Fang Da Blue Chip Select and Yi Fang Da Quality Select. The key trend highlighted is a significant and ongoing reduction in exposure to the consumer sector, particularly liquor (baijiu) stocks like Kweichow Moutai and Wuliangye, which were once core holdings. This shift is driven by several factors: a downturn in the consumer sector's business cycle post-pandemic, with slowing earnings growth for major players; a change in consumer behavior towards value over premium brands; and high channel inventory pressures, especially in the liquor industry. These fundamentals have led to a prolonged phase of valuation contraction for consumer stocks. Concurrently, market capital has rotated aggressively towards the high-growth technology sector, especially AI-related chains, which have dominated fund inflows. This style shift has further diminished the attractiveness of traditional consumer "core assets" for many funds. As a result, Zhang Kun's funds have drastically cut their consumer stock allocations. For example, the Blue Chip Select's baijiu holding proportion has fallen from over 40% to around 20%, and its overall top 10 holdings concentration dropped sharply. This mirrors a broader trend in the active equity fund industry, where allocations to consumer staples have plummeted to multi-year lows while technology holdings have surged. The article concludes that while the consumer sector's valuations are now at historical lows, offering some margin of safety, the fundamental outlook remains challenging due to weak macro consumption recovery and intense internal competition. Therefore, the sector is likely to see only sporadic rebounds rather than a sustained recovery, continuing to weigh on the performance of funds still heavily invested in it. Zhang Kun's timely reduction of Korean semiconductor holdings in his Asia Select fund amid a market crash is also noted as a contrast to his domestic strategy.

marsbitHá 23m

E Fund "Quits Drinking"

marsbitHá 23m

Before the Second Attempt at Hong Kong IPO, Topstar 'Hands Out' 548 Million in Related-Party Orders

Tosda, an industrial robotics firm, is making its second attempt at a Hong Kong listing shortly after its first application lapsed. The company has undergone a significant strategic shift, pivoting away from its lower-margin intelligent energy and environmental management system (IEEMS) business to focus on core robotics and machinery. This "revenue-reduction, profit-growth" strategy saw revenue nearly halve from 2022 to 2025, but resulted in a sharp turnaround to profitability, with a 1147% year-on-year increase in Q1 2026 net profit. This restructuring involved spinning off the IEEMS business, leading to a substantial jump in related-party transactions. Following the departure of a former executive, two newly associated companies are expected to handle up to 548 million RMB worth of IEEMS orders in 2026, with Tosda acting as a platform charging a 3% management fee. While profitability has improved, several financial concerns remain. Accounts receivable collection cycles have lengthened, inventory—particularly for robots—has surged significantly despite falling revenue, and the company faces challenges in overseas market expansion. Notably, overseas business currently has a lower gross margin than domestic operations. The company was also recently reprimanded by regulators for accounting inaccuracies related to revenue recognition and bad debt provisions. The success of its strategic pivot and its second listing attempt will depend on managing these financial risks, the transparency of its new business model, and the long-term performance of its core robotics segment.

marsbitHá 33m

Before the Second Attempt at Hong Kong IPO, Topstar 'Hands Out' 548 Million in Related-Party Orders

marsbitHá 33m

Is the AI Bull Market in Jeopardy? Philadelphia Semiconductor Index Breaks Below Key Support at 11,200 Points

The Philadelphia Semiconductor Index (SOX) faces a critical technical and fundamental test. It recently breached a key short-term support level around 11,200 points—a level that held in mid-July—and closed below it. Technical indicators have deteriorated, with the 21-day moving average crossing below the 50-day, signaling bearish momentum. Should the 11,200 support fail, the next major support is the 200-day moving average. The sell-off, which saw memory chip stocks like Micron and Western Digital plunge over 10%, stems from growing concerns about the cyclicality and quality of AI demand. Market participants question the sustainability of the AI capital expenditure boom, highlighted by divergences between the capital expenditures of mega-cap tech firms and semiconductor index performance. However, some positive structural shifts are emerging. Institutional positioning has normalized, unwinding the previously crowded "long semiconductors, short Mag 7" trade, leaving cleaner positioning. Seasonal tailwinds are also approaching, as the NDX historically performs well after this period, potentially supporting a rebound if retail inflows resume. The core question is whether the SOX can hold the 11,200 support. A failure could trigger further declines toward the 200-day moving average, while a successful defense, combined with lighter positioning and seasonal support, could offer a recovery window for the sector.

marsbitHá 33m

Is the AI Bull Market in Jeopardy? Philadelphia Semiconductor Index Breaks Below Key Support at 11,200 Points

marsbitHá 33m

Trading

Spot
活动图片