
Author: Murphy
In past cycles, observing the relationship between cost basis and price action has been one of the best perspectives for identifying BTC's emergence from a bottom structure.
The logic is that when the price enters the cost range of a certain group of BTC holders, the price movement reflects the behavior of that group. Is it "sell first to avoid losses" or "continue to hold"?
If it's the former, the price will encounter resistance near the cost line; if it's the latter, the price can break through the cost resistance smoothly. If the price fluctuates above and below the cost line, it means the market is in a repeated state of entanglement and博弈 (game theory/contention).
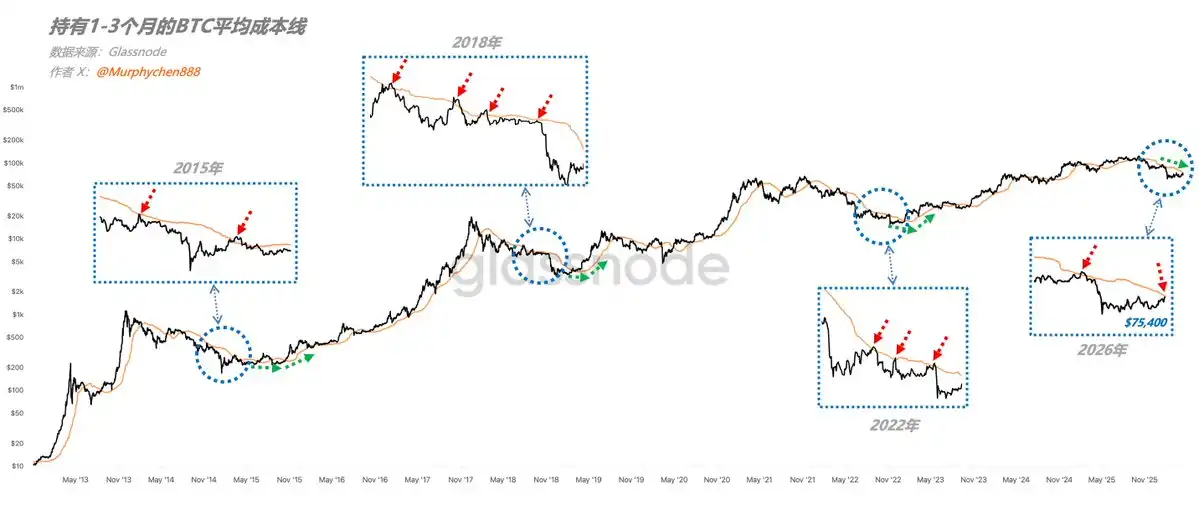
Figure 1: Average cost line for BTC held for 1-3 months
Based on long-term data research experience, I believe that among the many groups, the cost basis of short-term holders who have held for 1-3 months (1-3m_RP) is one of the most effective references (as shown by the yellow line in Figure 1).
From the chart, it can be seen that in all past bear market cycles, the 1-3m_RP has been a key resistance level for rebounds during downtrends. This is because holders of 1-3 month筹码 (chips, a term for crypto holdings) are not very firm. A large portion of them did not intend to hold long when they entered the market.
They might have originally just wanted to "get a quick profit," but ended up getting trapped and were forced to hold for 1-3 months. When the price rebounds and gives them a chance to break even, they will sell and exit without hesitation.
Therefore, we saw in 2015, 2018, and 2022, every time BTC rebounded to the yellow line and encountered resistance, it would pull back again; rebound again, encounter resistance again, pull back again......
Of course, there were also many false breakouts during this process, indicating that after some holdings started to show a profit, they "sold first to avoid losses," which then led more holdings to "follow suit," resulting in a false breakout.
Ultimately, this is a manifestation of investors' lack of confidence in the market trend.
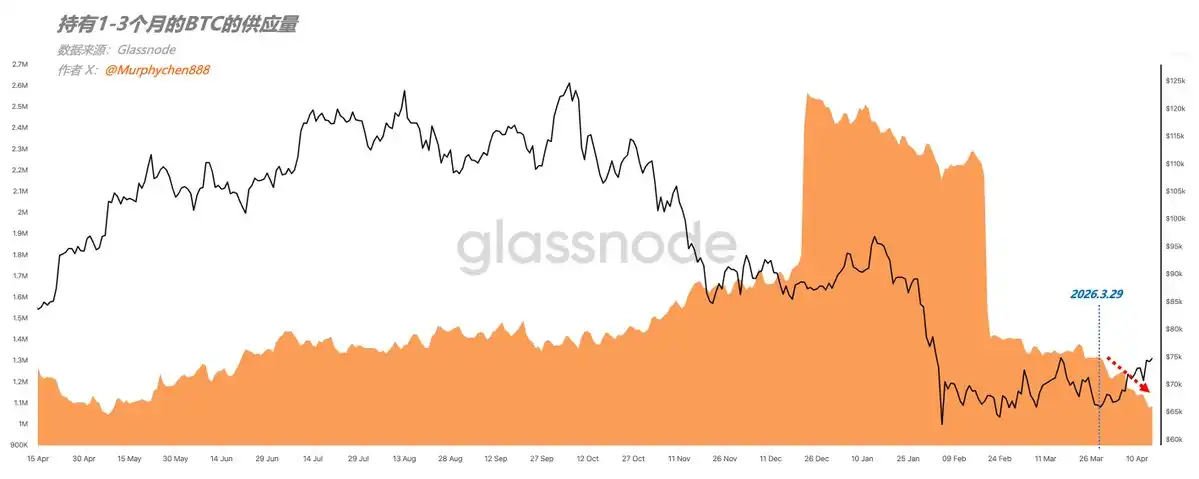
Figure 2: Supply of BTC held for 1-3 months
For example, looking at the change in the supply of BTC held for 1-3 months in Figure 2, there has been a clear downward trend after March 29th. This indicates that these holdings have decreased.
There are 2 possibilities for the decrease:
- 1. Because they continued to be held, they were reclassified into a longer-term holding group.
- 2. Because they were sold, they were reclassified into a shorter-term holding group.
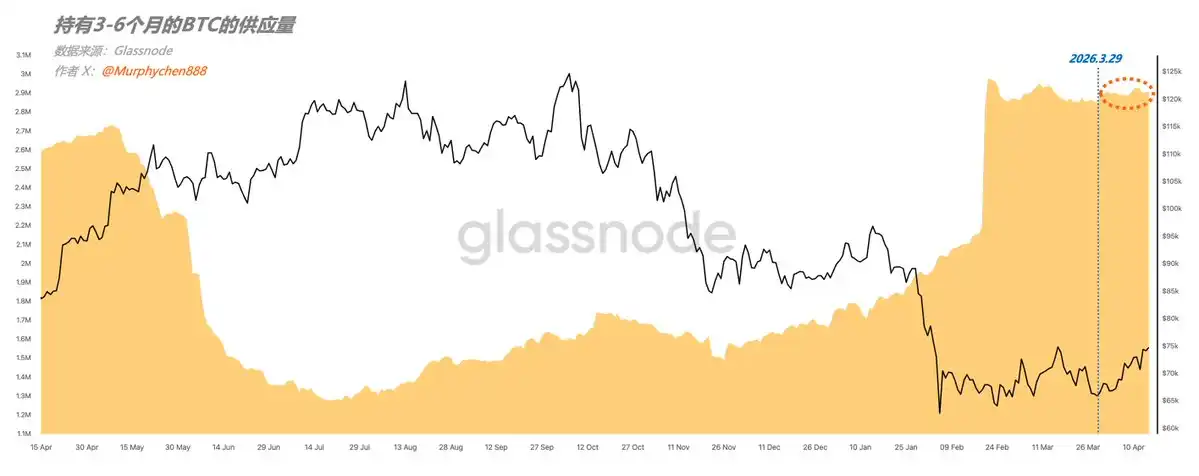
Figure 3: Supply of BTC held for 3-6 months
Looking again at Figure 3, the supply of BTC held for 3-6 months did not increase significantly after March 29th. This proves it is case 2, meaning the 1-3 month BTC was sold during the rebound, and currently there are 1.09 million left.
🚩 Now that the logic is explained, let's return to the present:
As of April 15th, the 1-3m_RP is approximately at $75,400, and the price of BTC is also right around this level. This is the second time in this downtrend that BTC has rebounded close to this resistance level.
The previous time was during January 13th - January 19th; a slight breakout triggered selling pressure and led to a continued pullback. Will it be the same this time?
Judging from past data, I believe the possibility is high; after all, in the past 3 cycles, there has never been a case where the trend successfully reversed on the second challenge.
Of course, from a rational perspective, we cannot do "path presetting." Objectively speaking, another scenario is also possible:
BTC could break through the yellow line, but thereafter encounter a larger resistance level above, namely the STH-RP (Short-Term Holder Realized Price), currently around $81,000, with 2.31 million BTC (far greater than the 1-3m holdings).
If it encounters resistance here, then BTC might experience fluctuations around the yellow line, meaning the market needs time to digest the selling pressure and begin cautiously choosing a direction.
As time passes, the yellow line will slowly start to turn, similar to the position marked by the green dashed line in Figure 1. That would mean the market has moved out of the bottom structure and entered the "bear-bull transition period."
Probability-wise, scenario 1 (second encounter with yellow line resistance) is more likely, but scenario 2 (fluctuating around the yellow line) is not entirely impossible. So we need to observe patiently, and even if there is a temporary breakout, we must judge whether it is true or false.
In any case, the direction of the yellow line is still downward and cannot suddenly turn upward. This requires a relatively long transition process, and this process is the best time for us to make decisions.