Accumulation Across the Entire Market, BTC May Challenge the $86,000 Resistance Zone?

marsbitPublicado em 2026-08-27Última atualização em 2026-08-27

Resumo

Record-breaking short liquidations ignited a roughly 26% rebound in Bitcoin from the August lows. Unlike previous leverage-driven squeezes, this rally is supported by substantial buy-side demand. U.S. spot ETFs recorded their strongest weekly inflows of the year, with $2.23 billion, while bitcoin continued to flow out of exchanges. On-chain data shows all wallet cohorts are simultaneously accumulating coins, confirming broad-based buying. Leverage has been effectively cleared post-squeeze, with bitcoin-denominated futures open interest contracting. The funding rate has hovered around neutral, indicating the move was driven more by short covering than new speculative longs. A key challenge lies ahead: a significant supply wall in the $81k to $86k range. This zone is defined by the cost basis of long-term holders, concentrated sell-side order book liquidity, and pending short liquidation clusters. Market structure appears top-heavy, with large-cap assets outperforming smaller ones, a pattern typical of early-cycle rallies. Bitcoin has also decoupled from equities during this move. Cycle indicators have risen from a prolonged "cool" phase, positioning the market in an early stage, far from historical top readings. The path forward hinges on whether this overhead supply can be absorbed. A sustained close above ~$83.3k with continued ETF inflows would signal strength. Conversely, a break below the ~$70k short-term holder cost basis, and ultimately the ~$62k-$65k support floor, ...

Author: Glassnode

Compilation: AididiaoJP, Foresight News

Core Summary

  • Record short liquidations triggered a rebound; Bitcoin faces a test in the $81,000 to $86,000 supply concentration zone.
  • ETFs recorded a weekly net inflow of $2.23 billion; all market cohorts are accumulating synchronously, providing clear capital support.
  • Leverage unwound as the market churns; the $81,000-$86,000 range becomes the key resistance band overhead.

Introduction

A historically large short liquidation event ignited a rebound of approximately 26% from the mid-August low. Unlike past short-term squeezes driven solely by leverage, this rally has been backed by substantial buying pressure: U.S. spot ETFs recorded their strongest weekly inflows of the year, Bitcoin continued to flow out of exchanges, and all wallet size cohorts on-chain showed synchronized accumulation. At present, whether the rebound can extend to the January high depends crucially on whether the supply-concentrated zone between $81,000 and $86,000 can be effectively breached.

The Liquidation Storm: History's Largest Short Squeeze Ignites the Rebound

Record Single-Day Short Liquidations

In dollar terms, August 19, 2026, saw the largest single-day short liquidation volume since data began in 2019. During the entire squeeze window, short liquidations accounted for 85% of total liquidations. It should be noted that our data covers major centralized exchanges but excludes Hyperliquid, so the actual total liquidation value is higher than our statistics.

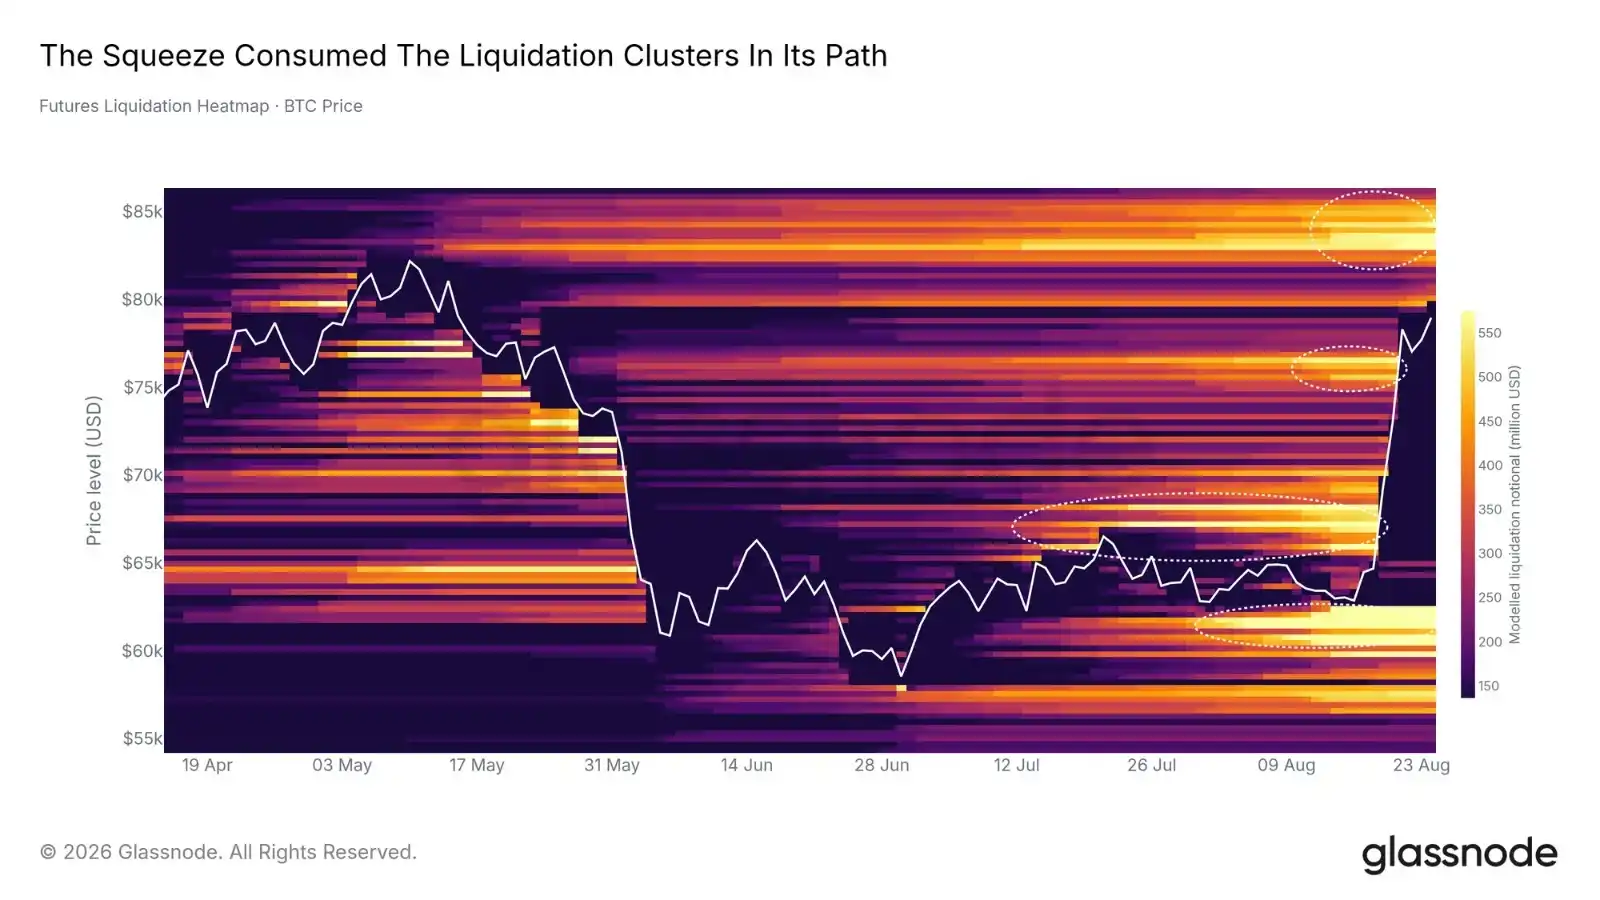
The liquidation heatmap clearly shows how price action consumed this "fuel." Clusters of simulated liquidation levels along the price path were triggered one by one during the rebound, digesting roughly 86% of the liquidation orders along the way. The remaining orders are distributed at both ends: a dense cluster of short liquidation orders sits above in the $82,000-$86,000 range, while residual long liquidation orders linger below in the $60,500-$62,400 area.
Significant Leverage Unwinding

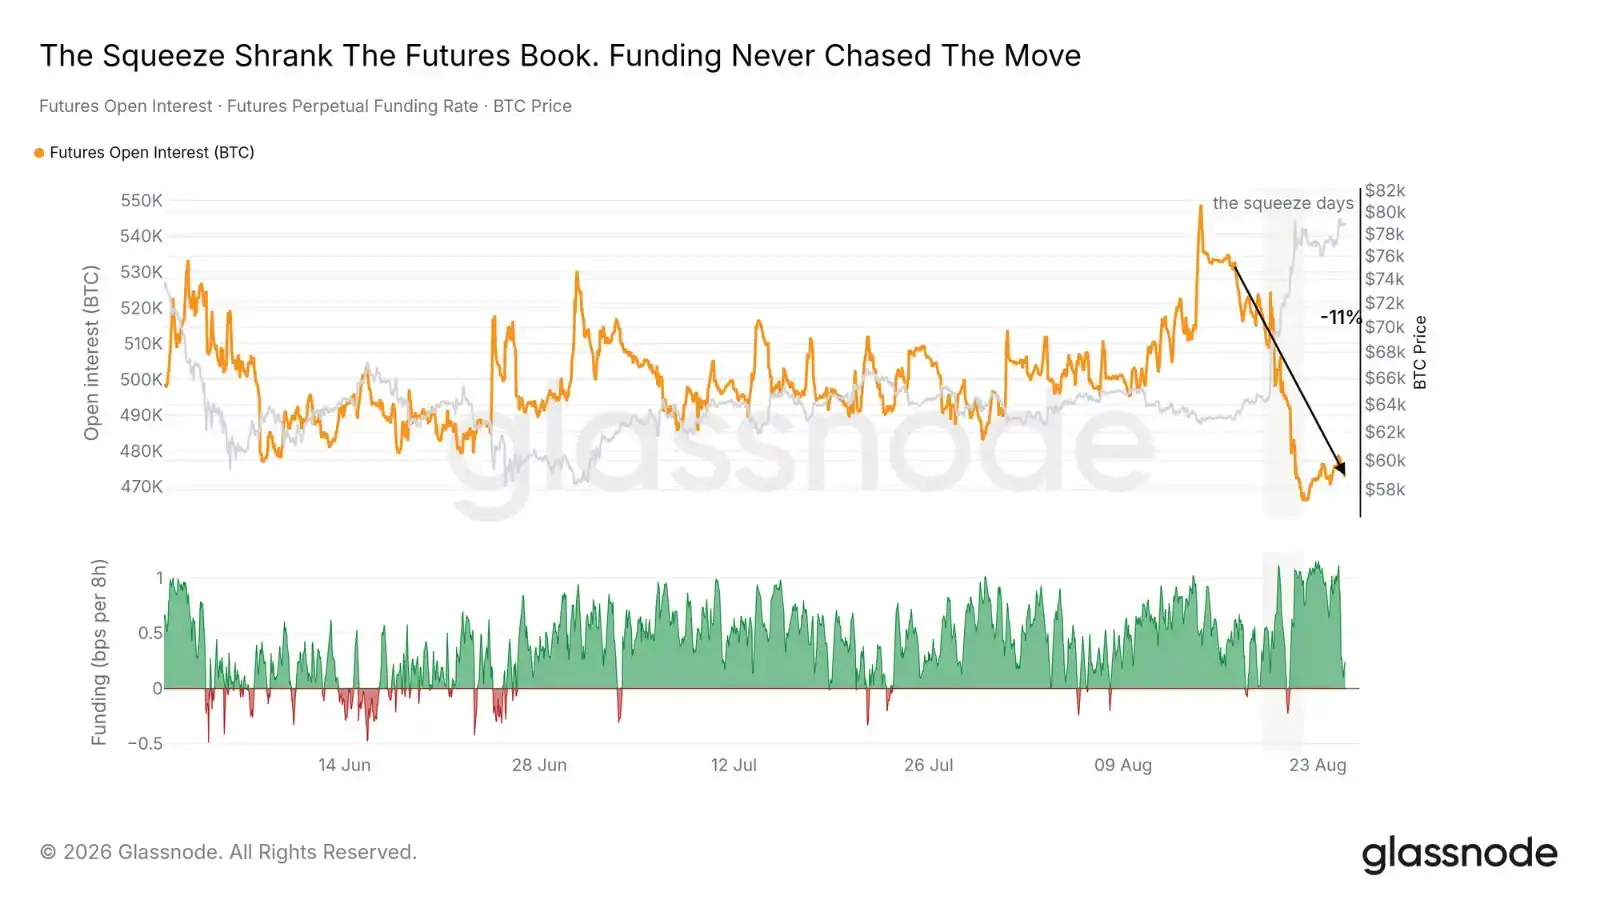
This squeeze effectively cleared leverage from the market it passed through. Measured in Bitcoin terms, futures open interest contracted by 11% during the window. The expansion in dollar-denominated nominal size was entirely due to price appreciation—meaning the liquidated short positions were not quickly replaced by new contracts.

Perpetual swap funding rates also confirm this. Throughout the rebound, funding rates fluctuated mostly around the neutral baseline, occasionally turning negative. This indicates the rally was not driven by new long speculation but rather a passive unwinding triggered by concentrated stop-loss executions. If Bitcoin-denominated open interest begins to expand again alongside rising funding rates, it would be the first warning sign of renewed leverage influx.
Capital Flow Validation: Real Money Backs the Rebound

ETF Channel Reactivated

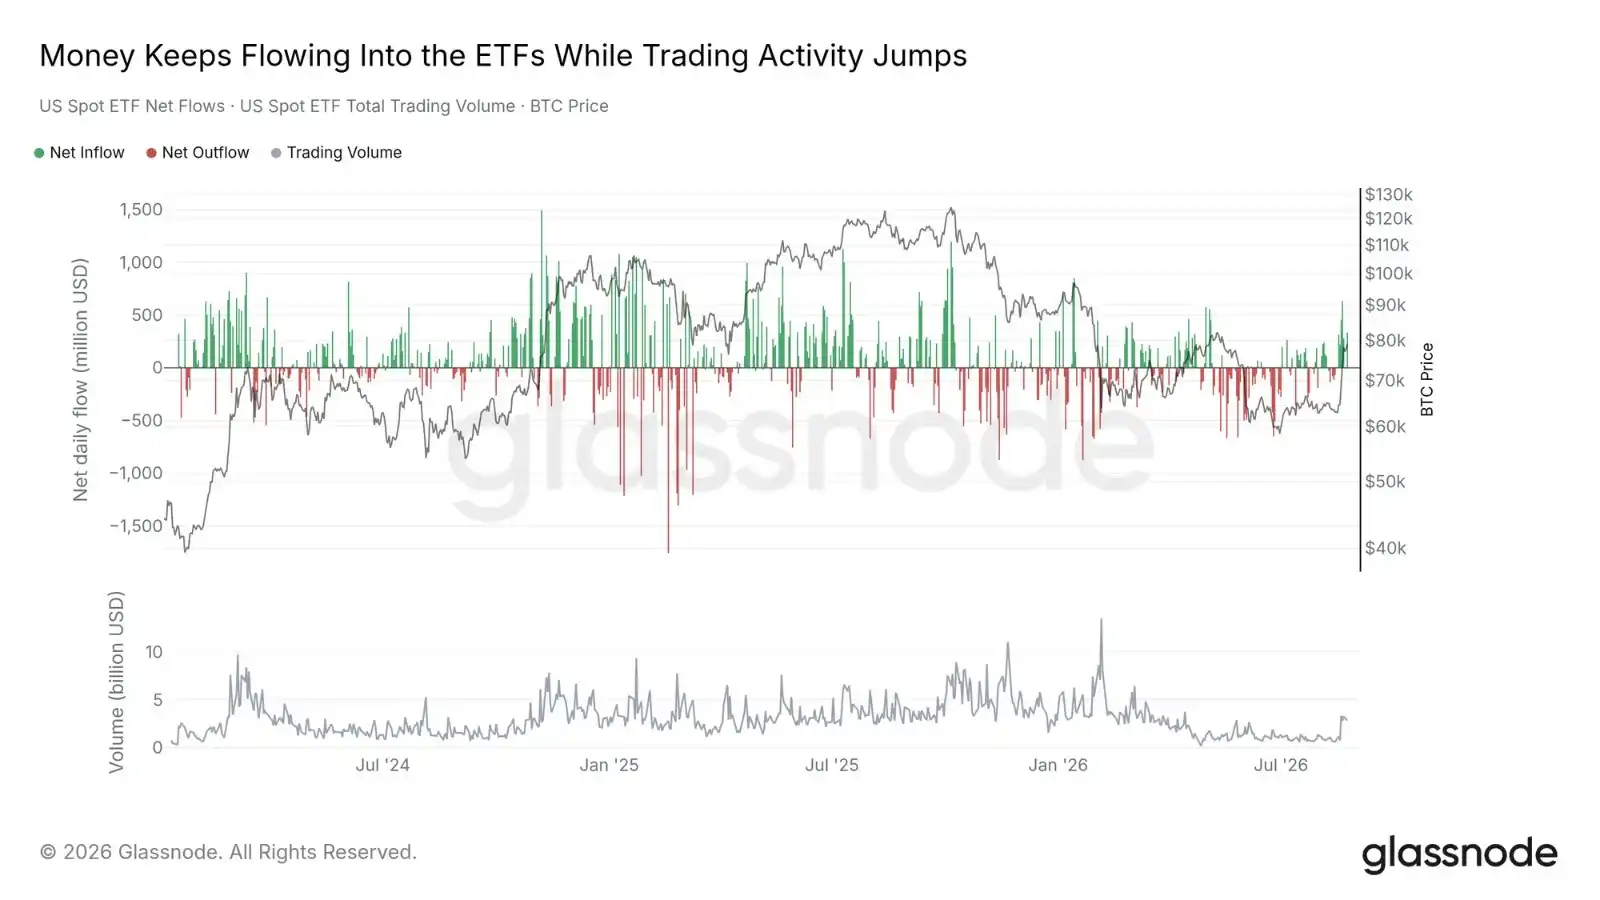
U.S. spot Bitcoin ETFs achieved net inflows of $2.23 billion during the squeeze window, with not a single day of outflows, marking the strongest weekly net absorption record for the year. The largest single-day subscription size during this period was the highest since January 14, 2026. The price also reclaimed the short-term holder cost basis during the rebound.

Trading activity recovered somewhat but remains far from historical peaks: the average daily ETF trading volume during the squeeze week was approximately $2.4 billion, roughly half the levels seen during the January-February peak period and about one-third lower than last August.
On-Chain Supply Shifts Up the Size Ladder

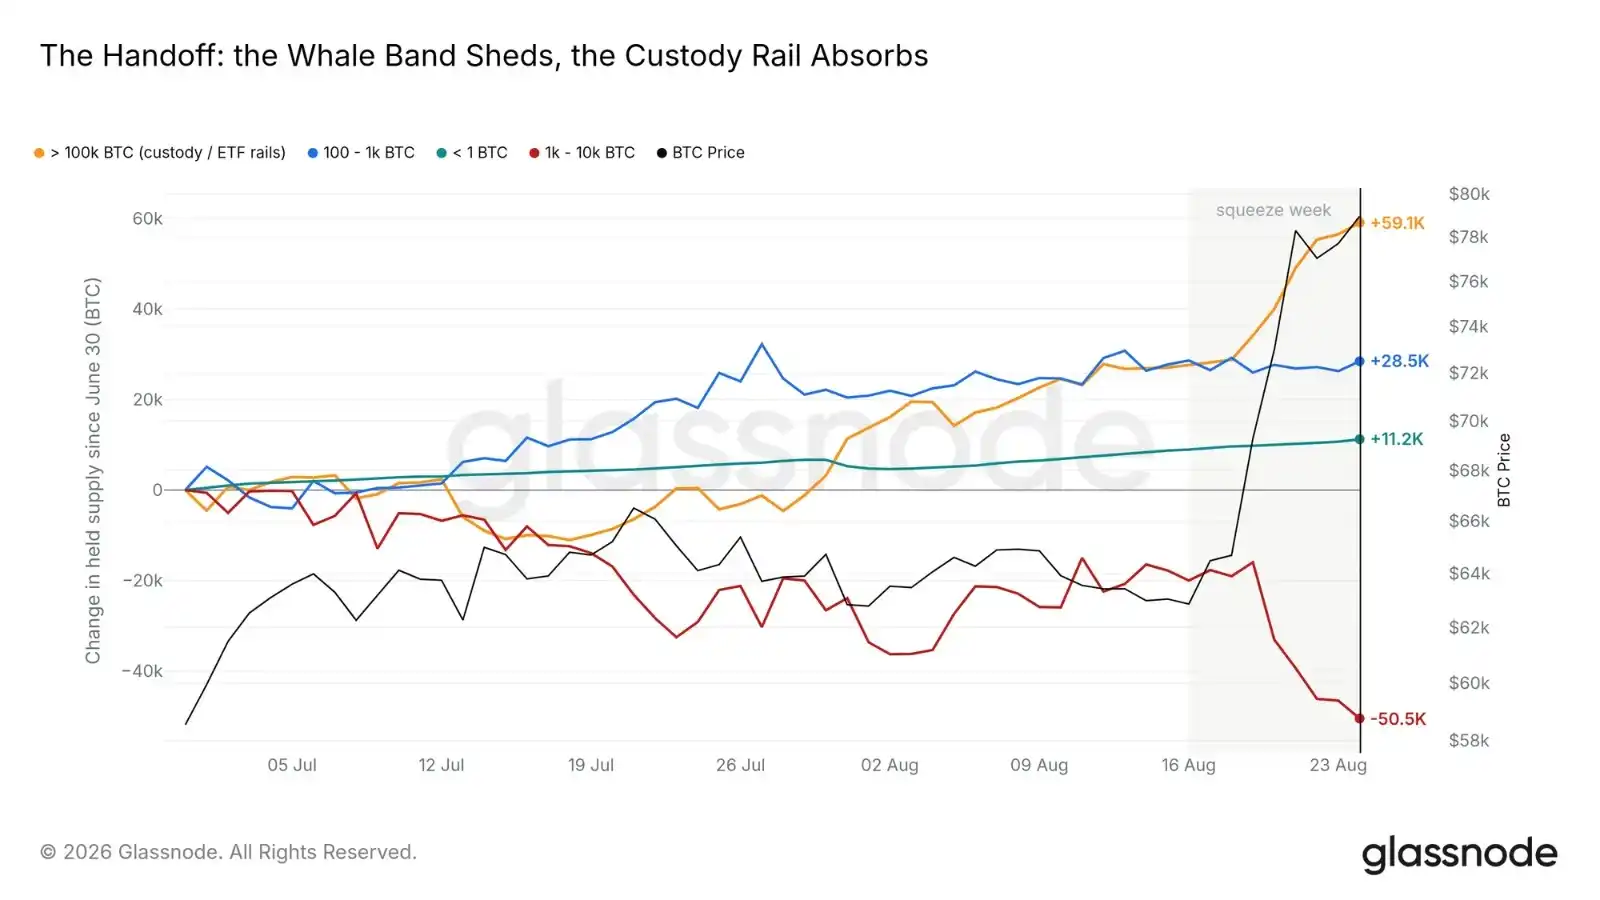
Since the low on June 30, 2026, entities holding 1,000-10,000 BTC have cumulatively reduced their holdings by approximately 50,500 BTC. Meanwhile, the largest cohort (holding over 100,000 BTC, primarily comprising exchanges, custodians, and ETF wrapper products) absorbed about 59,100 BTC during the same period. Capital is flowing up the size ladder from mid-sized and smaller whales toward large custodial institutions.

This trend intensified during the squeeze week: the custodial cohort increased holdings by approximately 31,500 BTC within the window, a magnitude comparable to the weekly ETF net subscriptions (though not a direct coin-for-coin match). BTC flowing from distressed whale wallets is appearing on institutional custodial channels in similar size.
Synchronized Accumulation Across All Market Cohorts

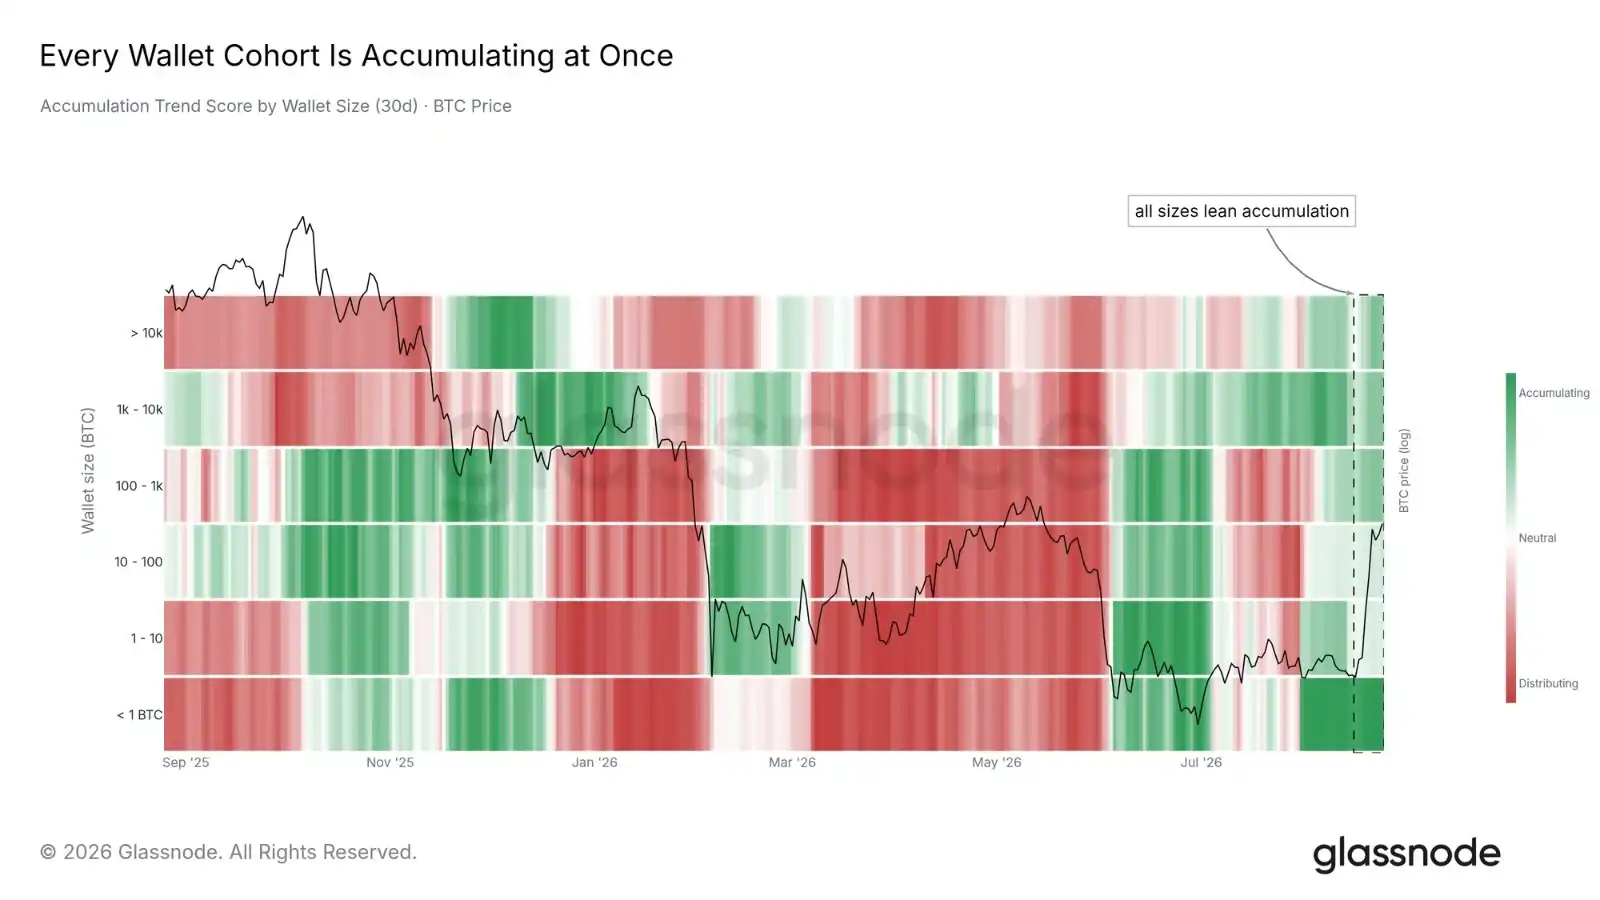
The breadth of buying behavior confirms the authenticity of capital inflows. The 30-day accumulation trend score shows that all six wallet size cohorts are at or above the 0.5 neutral threshold. This state has persisted for 20 days since August 5, marking the longest period of synchronized accumulation across all cohorts since the 22-day record in late 2024.

The squeeze day itself was primarily driven by large wallet accumulation, while smaller cohorts had been gradually building positions throughout August. If the score for any cohort falls back below 0.5, it would be the first signal of a crack in market breadth, indicating that the buying pressure supporting this rebound is narrowing.
Rebound Structure: Cycle Positioning and Cross-Asset Performance

Cycle Indicators Exit the Cooling Zone

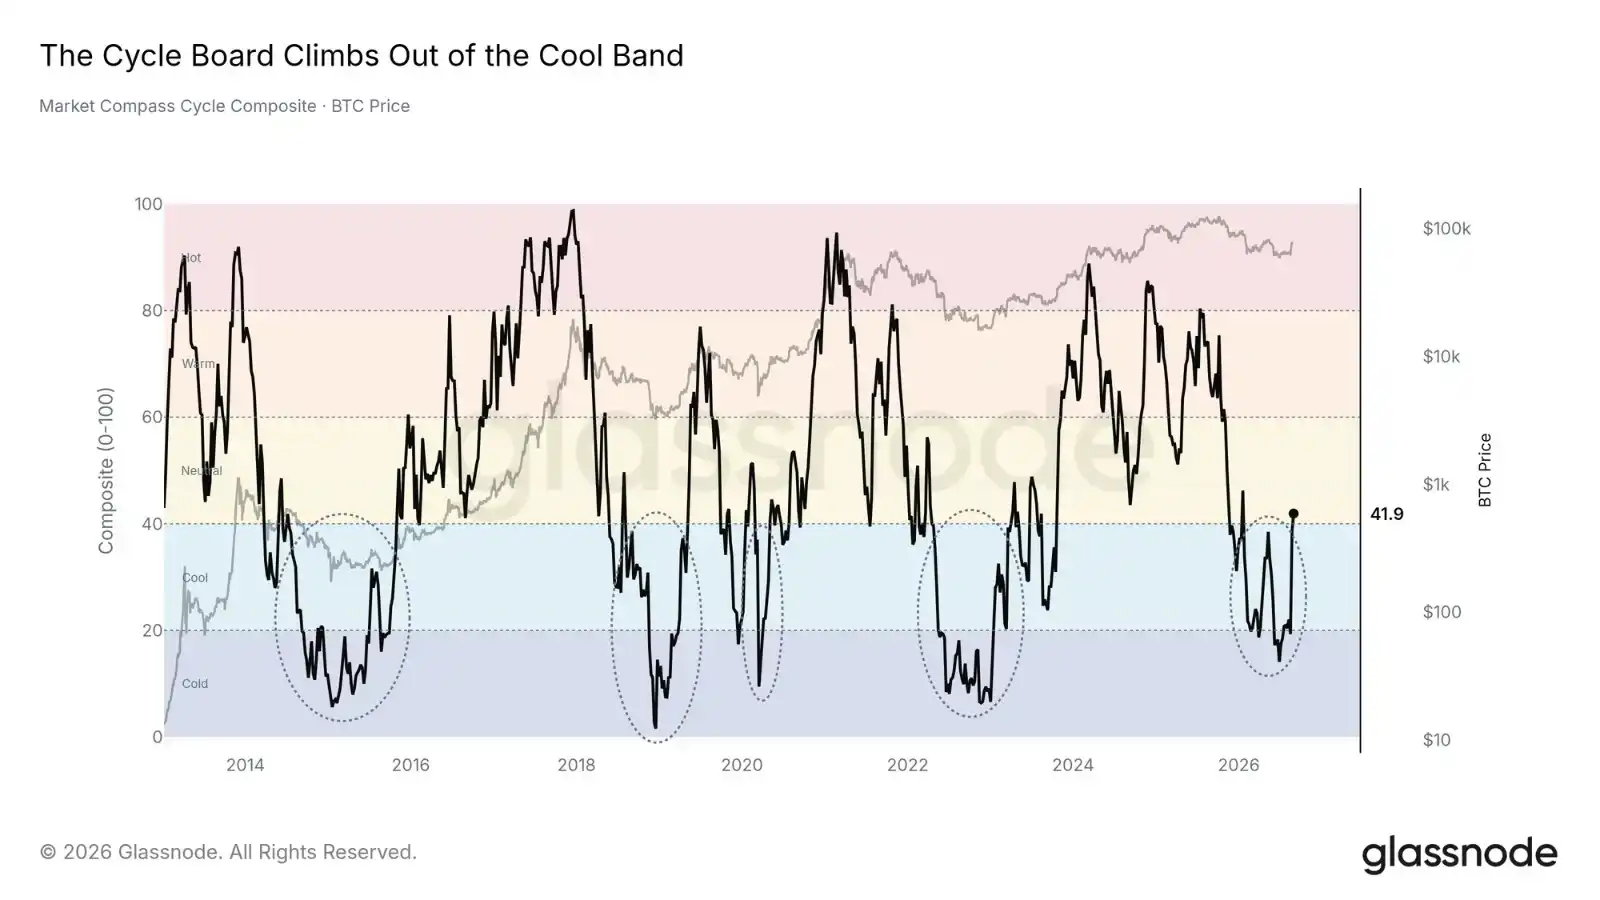
The Cycle Composite Indicator (the median of 45 on-chain cycle metrics) has rebounded to the 40 neutral boundary, after spending a prolonged seven months in the "Cold" to "Cool" range.

The five rings on the chart mark similar extended periods of low readings in history: 2014-2015, 2018-2019, 2020, 2022-2023, and the current cycle. Each corresponded to the low regions of their respective cycles. This indicator does not predict the speed of the rebound but positions the current market action in the early stages of a cycle, far from the readings seen in past top regions.
Rebound Structure Shows "Top-Heavy" Characteristic

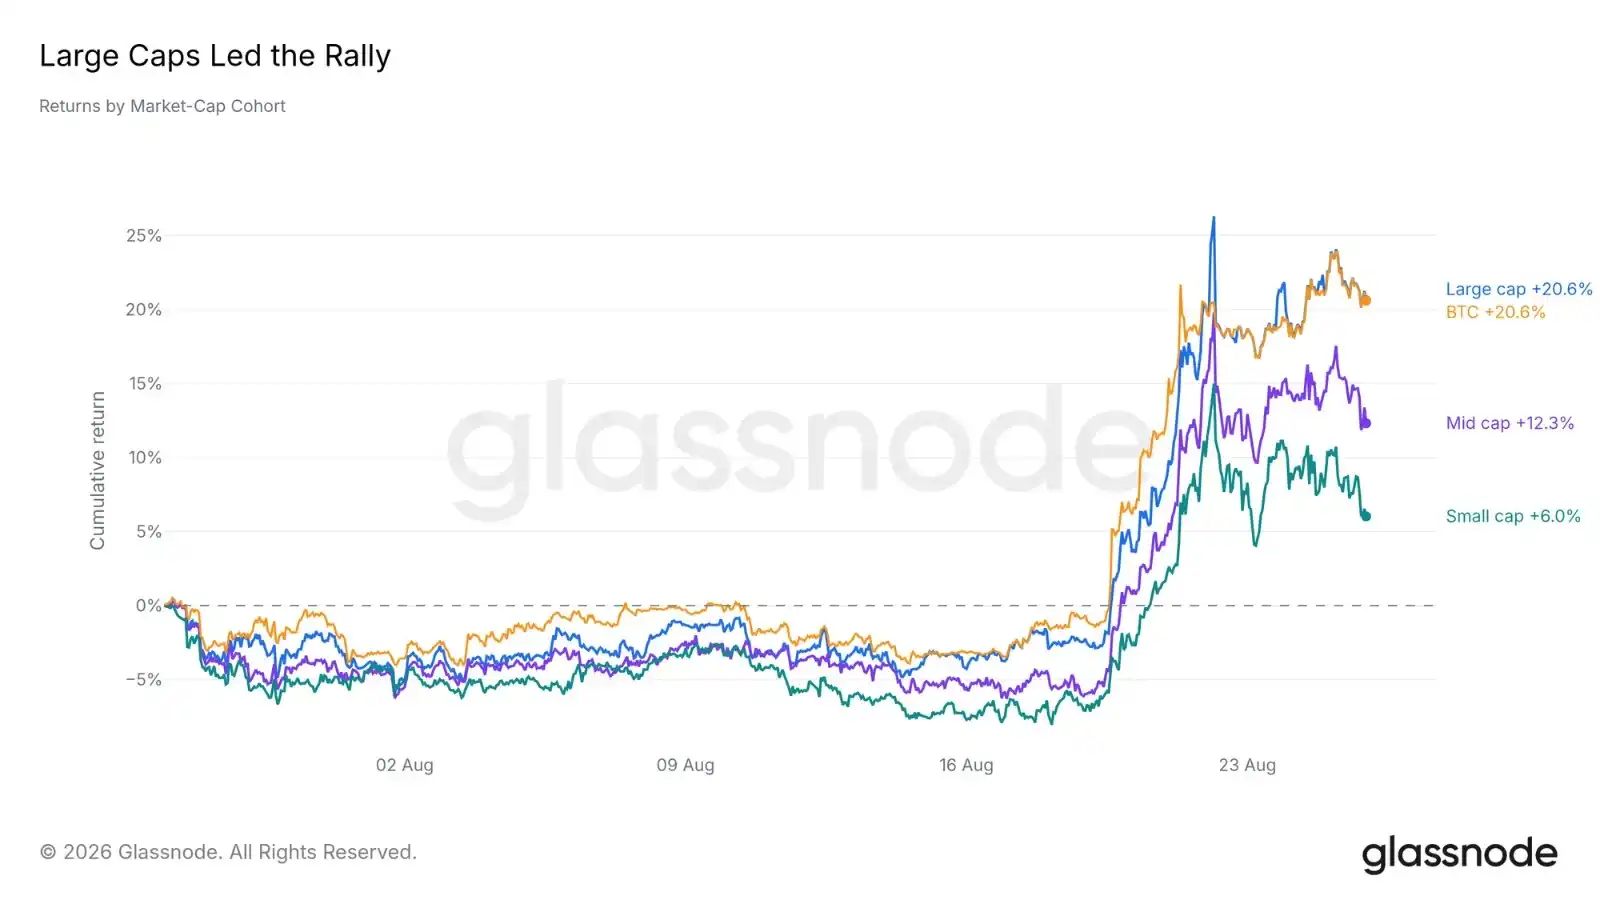
Looking across assets, the breadth of the rally is relatively narrow. Over the past month, the large-cap cohort averaged returns of about 20.6%, roughly in line with Bitcoin; while the small-cap cohort gained only about 6.0%. The smaller the market capitalization, the less capital inflow it received.

This is a typical structure for an early-stage rebound—the most liquid assets get allocated first. If smaller and mid-cap cohorts can catch up later, the rally will diffuse to a broader range; until then, this remains a market led by large-cap coins, with Bitcoin at the forefront.
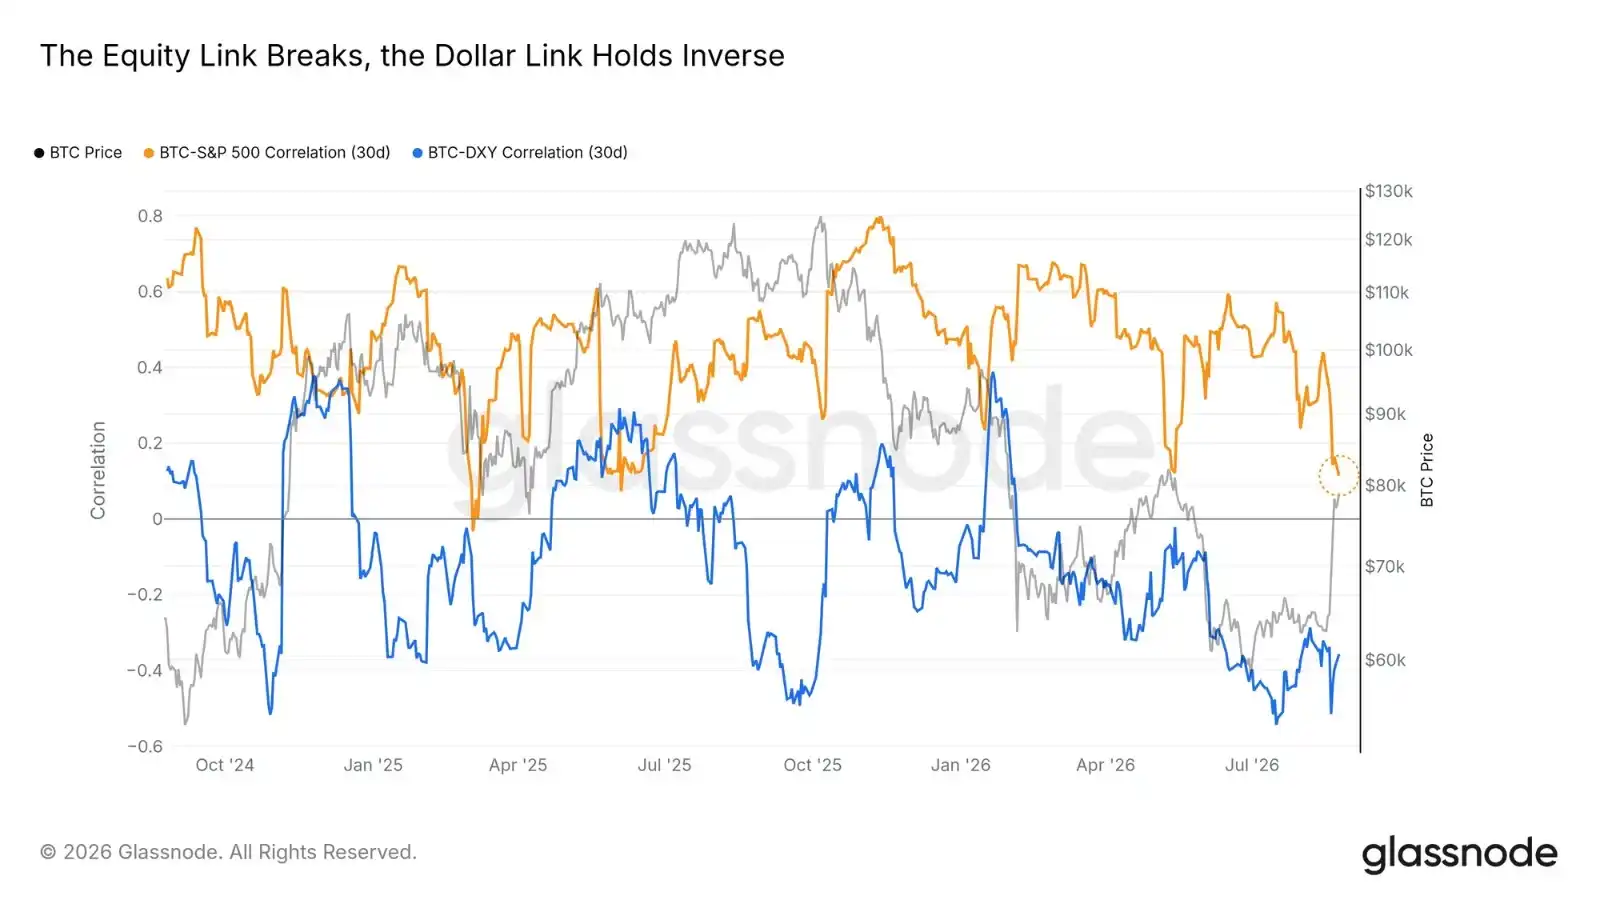
Significant Decoupling from U.S. Stocks

This rebound has diverged from macro trends. During the squeeze window, Bitcoin rose about 25%, while the S&P 500 index fell 1.7%. Their one-month rolling return correlation plunged to near zero. The negative correlation with the U.S. dollar remained intact.

Similar rapid decouplings in 2025 reverted to the mean within weeks on two occasions, so a structural shift cannot yet be asserted—the quarterly-window correlation has only just begun to turn downward. However, a rebound completed against a backdrop of stock market weakness is clearly not a "stock beta" play; its true driving force is capital flowing into the crypto market itself.
Overhead Resistance: The $81,000-$86,000 Supply-Concentrated Zone

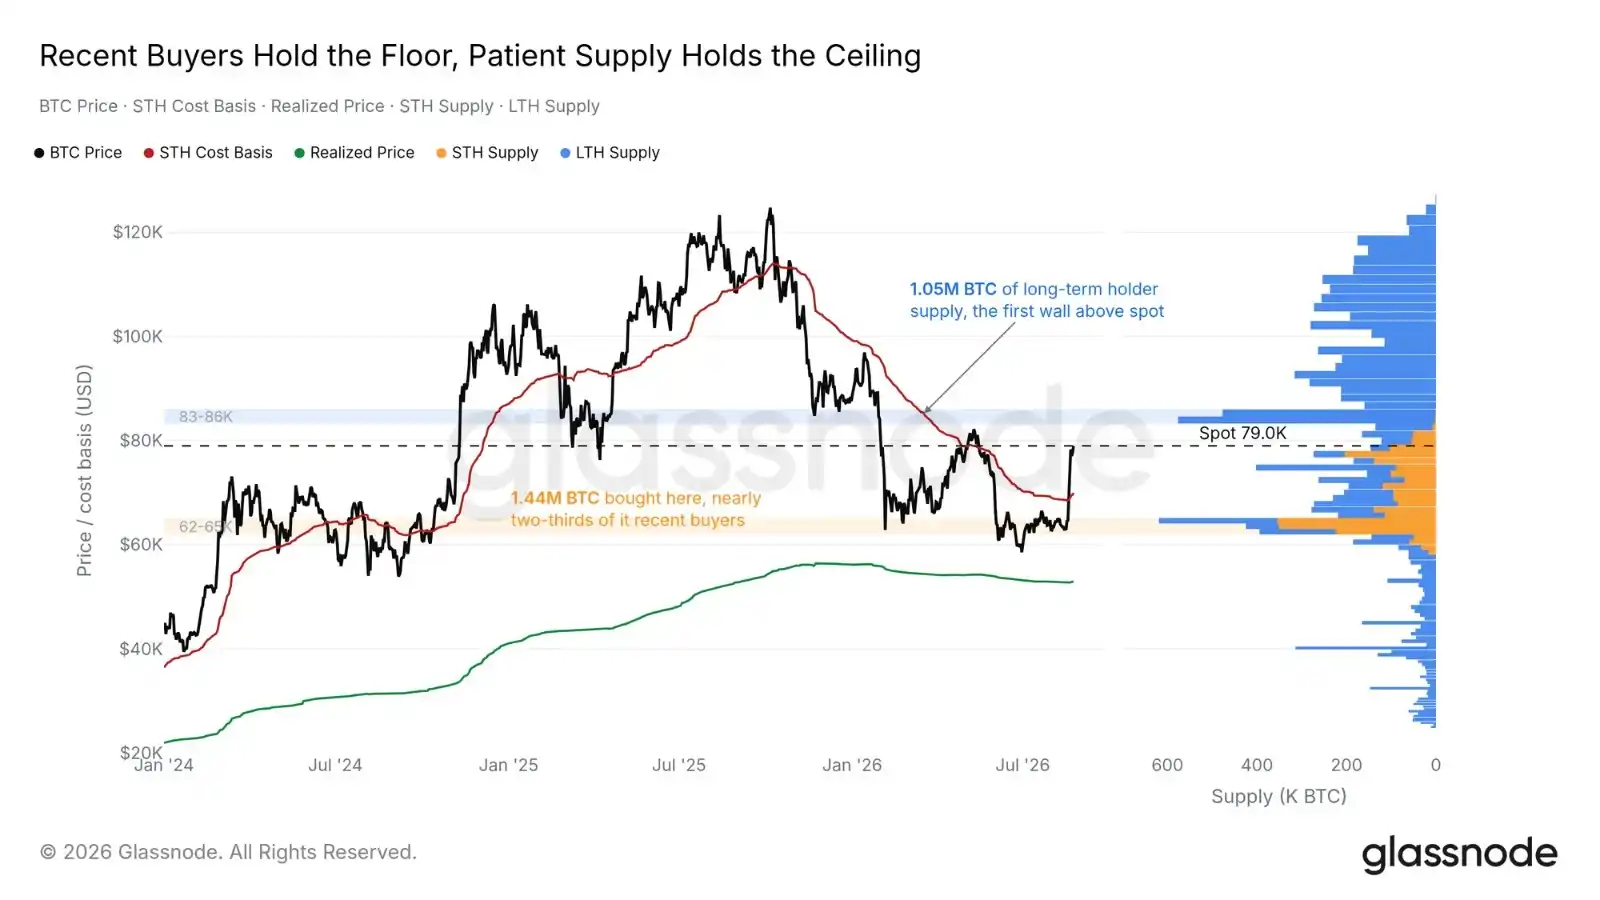
Cost Basis: A Floor and Ceiling Coexist

On-chain cost distribution now sandwiches the price. Below, buyers who entered during the June-August bottom hold a cost basis in the $62,000-$65,000 range, with nearly two-thirds belonging to short-term holders—recent buyers inclined to defend their cost line. Above, the first major supply structure sits between $83,000 and $86,000, almost entirely comprised of long-term holders who experienced the full decline.

The current spot price resides in the gap between. The short-term holder cost basis has recovered to around $70,000 (below the price). An assault on the $83,000-$86,000 zone would test whether long-term holders choose to sell near their break-even point.
Sell-Side Orders Regroup Overhead

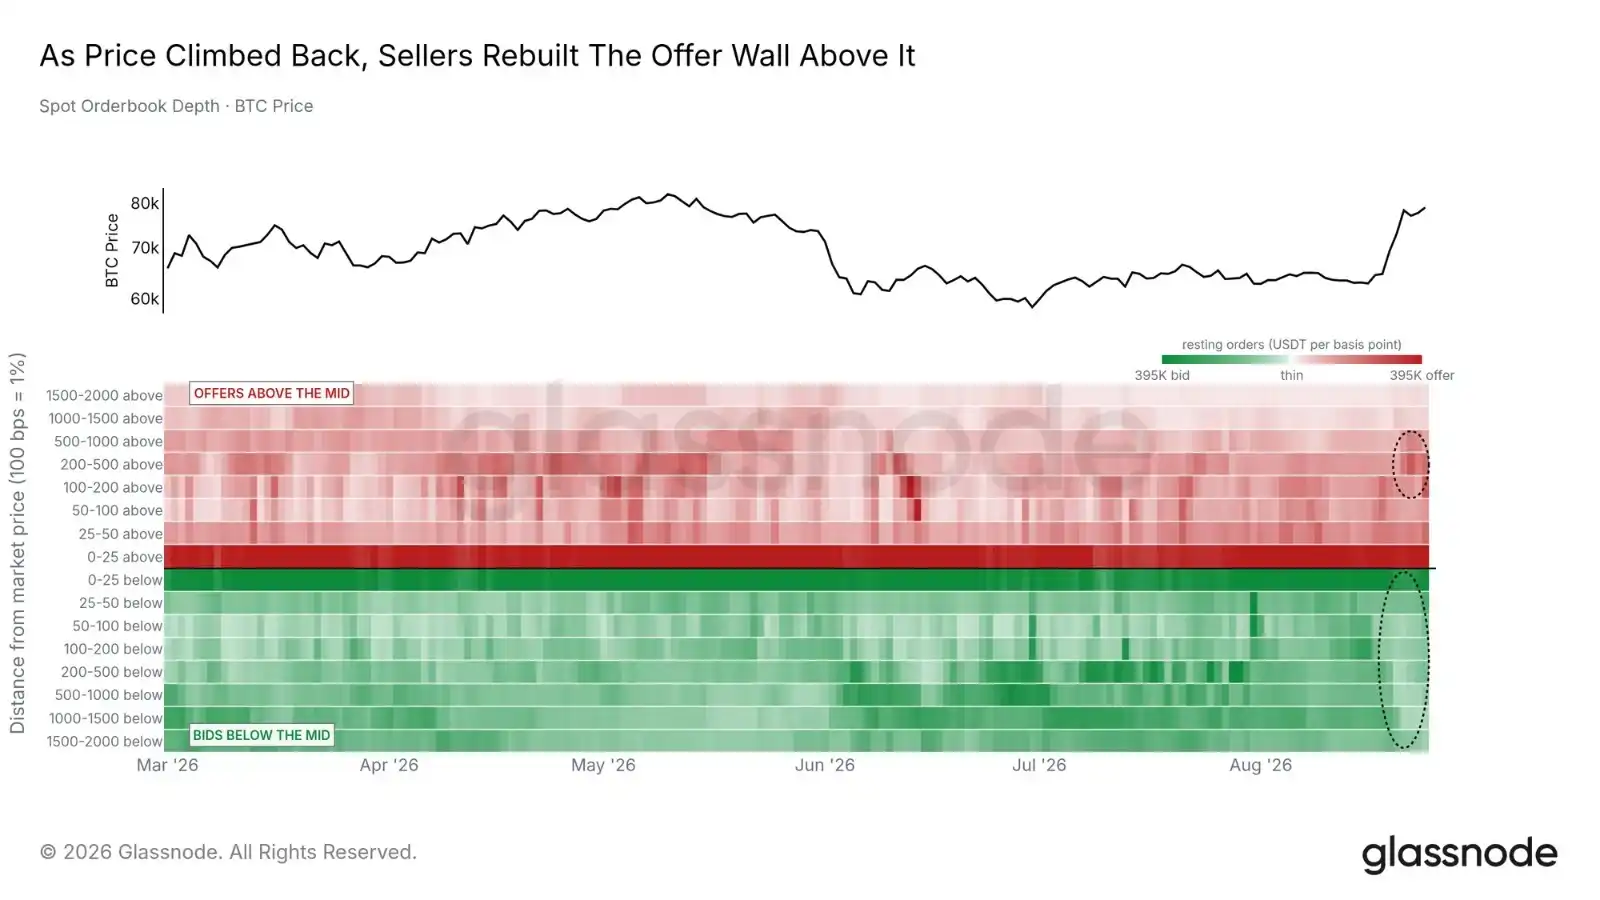
As prices rose, sell orders reappeared on the order books above. Static sell orders in the +100 to +1000 basis point range above the mid-price grew by about 41% in the last five days of the window. Meanwhile, buy-side depth across the visible order book thinned by approximately 32% in the last seven days. Static orders can be canceled instantly, so the order book reflects zones of seller willingness—currently, sellers prefer to place orders above.

This regrouping of sell orders points to the same zone as several independent metrics: the first self-custodied cost basis plateau begins at $80,800, market maker gamma turns negative at $82,300, existing liquidation orders extend to $86,000, and a wall of patient supply fills the $83,000-$86,000 range. All overhead structures we track are currently concentrated between $81,000 and $86,000—this is the true test for the rebound's sustainability.
Options Market Pricing: Stability Expected

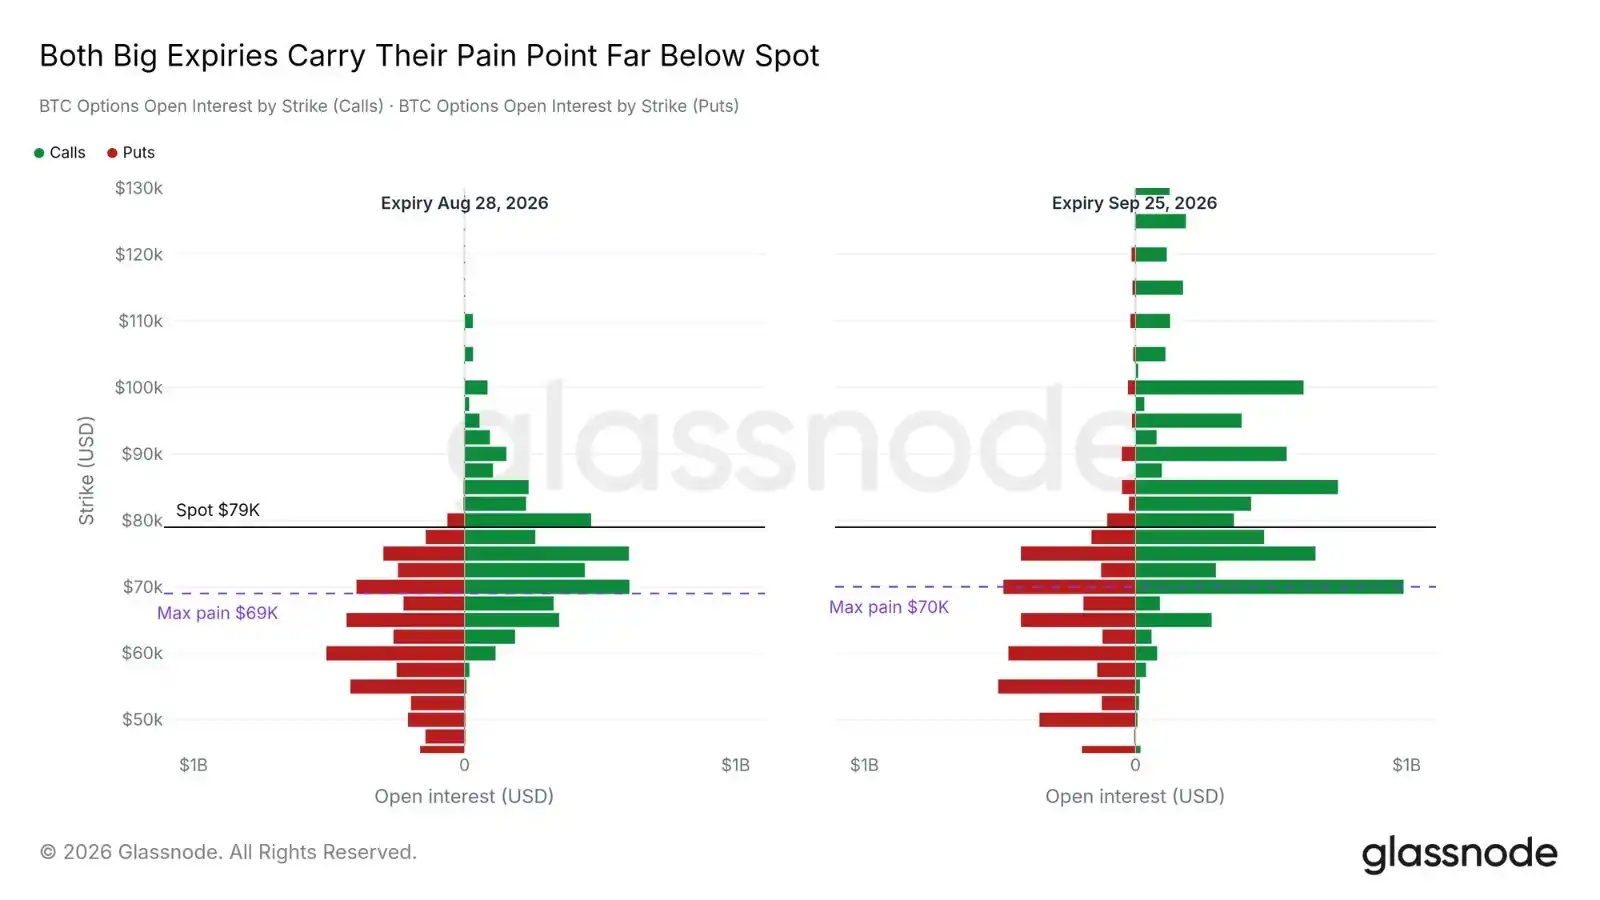
The options market indicates patient expectations. The two most concentrated upcoming monthly expiries—this Friday with about $10.4 billion in notional value and the September quarterly expiry with about $13.7 billion—have their respective max pain points significantly below the spot price. Max pain (the strike price where the largest number of options expire worthless) is at $69,000 and $70,000, respectively, while spot is around $79,000. Below lies a concentration of puts, above a concentration of calls.

The forward distribution is relatively flat. For expiries up to September 25, 2026, about 70% of the strike prices imply outcomes within the $69,000 to $89,700 range, with the median only a few hundred dollars above spot. The options market's base-case scenario prices in stability within the current supply wall: neither expecting a breakout above the $86,000 zone, nor a retreat back to the floor below.
Conclusion

The largest short liquidation event in our data records initiated this rebound; sustained ETF subscriptions, active on-chain buying, and net exchange outflows provided the capital needed for continuation; cycle indicators still position the market in an early stage. This is a typical profile for a phased rally.

Confirmation signals would come from above: a sustained close above $83,300, coupled with continuing ETF inflows, would indicate the supply wall is being absorbed rather than respected. Weakness signals would first manifest with a loss of the $70,000 short-term holder cost basis, followed by the $62,000-$65,000 floor zone defended by recent buyers. A return to the $62,900 squeeze starting point would completely erase the entire move.


Criptomoedas em alta

Perguntas relacionadas

QWhat triggered the recent Bitcoin rally according to the article?

AThe rally was triggered by an unprecedented, record-breaking short squeeze event, where a massive amount of short positions were liquidated, sparking a 26% rebound from the mid-August lows.

QWhat key price zone is identified as the major supply and resistance area for Bitcoin's upward movement?

AThe key resistance and supply-dense zone is identified as the $81,000 to $86,000 range. A successful and sustained break above this area is crucial for the rally to continue towards the January highs.

QHow did US spot Bitcoin ETFs perform during the short squeeze window, and why is it significant?

AUS spot Bitcoin ETFs recorded net inflows of $2.23 billion during the short squeeze window, with no single day of outflows. This marked the strongest weekly inflow of the year and provided substantial, real capital backing for the rally, confirming genuine institutional buying interest.

QWhat does the 'Accumulation Trend Score' data reveal about market breadth during this rally?

AThe 30-day Accumulation Trend Score data shows that all six wallet size cohorts were at or above the neutral threshold of 0.5, indicating a synchronized accumulation of Bitcoin across all market participant groups—from small to large holders. This widespread buying confirms the breadth and authenticity of the market's strength.

QAccording to the article, what are the key signals for confirming a continuation of the rally versus a potential failure?

AA bullish confirmation signal would be a sustained close above $83,300 combined with continued ETF inflows, showing the supply wall is being absorbed. A bearish failure signal would be a loss of the $70,000 support (Short-Term Holder cost basis), followed by a break below the $62,000-$65,000 floor defended by recent buyers. A drop back to the $62,900 squeeze starting point would invalidate the entire rally.

Leituras Relacionadas

Trading

Spot

Artigos em Destaque

O que é BITCOIN

Compreender o HarryPotterObamaSonic10Inu (ERC-20) e a Sua Posição no Espaço Cripto Nos últimos anos, o mercado de criptomoedas assistiu a um aumento na popularidade das moedas meme, cativando não apenas os traders, mas também aqueles que procuram envolvimento comunitário e valor de entretenimento. Entre estes tokens únicos está o HarryPotterObamaSonic10Inu (ERC-20), um projeto intrigante que mistura referências culturais no tecido das criptomoedas. Este artigo explora os principais aspetos do HarryPotterObamaSonic10Inu, examinando os seus mecanismos, a sua ética orientada pela comunidade e o seu envolvimento com o vasto panorama cripto. O que é o HarryPotterObamaSonic10Inu (ERC-20)? Como o nome sugere, o HarryPotterObamaSonic10Inu é uma moeda meme construída na blockchain Ethereum, classificada sob o padrão ERC-20. Ao contrário das criptomoedas tradicionais, que podem enfatizar a utilidade prática ou o potencial de investimento, este token prospera no valor de entretenimento e na força da sua comunidade. O projeto visa promover um ambiente onde utilizadores envolvidos possam reunir-se, partilhar ideias e participar em atividades inspiradas por diversos fenómenos culturais. Uma característica notável do HarryPotterObamaSonic10Inu é a zero taxa sobre transações. Este elemento atraente visa encorajar a negociação e o envolvimento da comunidade, isento de encargos adicionais que podem desencorajar os traders de pequena escala. A oferta total da moeda está fixada em mil milhões de tokens, uma cifra que marca a sua intenção de manter uma circulação substancial dentro da comunidade. Criador do HarryPotterObamaSonic10Inu (ERC-20) As origens do HarryPotterObamaSonic10Inu estão um pouco envoltas em mistério; os detalhes sobre o criador permanecem desconhecidos. O desenvolvimento deste token carece de uma equipa identificável ou de um plano explícito, o que não é raro no setor das moedas meme. Em vez disso, o projeto surgiu de forma orgânica, com o seu progresso a depender fortemente do entusiasmo e da participação da sua comunidade. Investidores do HarryPotterObamaSonic10Inu (ERC-20) No que diz respeito a investimentos externos e apoios, o HarryPotterObamaSonic10Inu também permanece ambíguo. O token não lista quaisquer fundações de investimento conhecidas ou apoio organizacional significativo. Em vez disso, o “sangue vital” do projeto é a sua comunidade de base, que informa o seu crescimento e sustentabilidade através da ação coletiva e do envolvimento no espaço cripto. Como Funciona o HarryPotterObamaSonic10Inu (ERC-20)? Como uma moeda meme, o HarryPotterObamaSonic10Inu opera principalmente fora dos quadros tradicionais que muitas vezes governam o valor dos ativos. Existem vários aspetos distintivos que definem como o projeto funciona: Transações Sem Taxas: Sem taxas sobre transações, os utilizadores podem comprar e vender o token livremente, sem a preocupação de custos ocultos. Envolvimento da Comunidade: O projeto prospera na interação da comunidade, aproveitando plataformas de redes sociais para criar entusiasmo e facilitar a participação. Discussões, partilha de conteúdo e envolvimento são elementos cruciais que ajudam a expandir o seu alcance e a fomentar a lealdade entre os apoiantes. Sem Utilidade Prática: Deve ser notado que o HarryPotterObamaSonic10Inu não oferece utilidade concreta dentro do ecossistema financeiro. Em vez disso, é classificado como um token principalmente para entretenimento e atividades comunitárias. Referência Cultural: O token incorpora de forma inteligente elementos da cultura popular para atrair interesse, conectando-se tanto com entusiastas de memes como com seguidores de criptomoedas. HarryPotterObamaSonic10Inu exemplifica como as moedas meme operam de forma diferente de projetos de criptomoedas mais tradicionais, entrando no mercado como construções sociais inovadoras em vez de ativos utilitários. Linha do Tempo do HarryPotterObamaSonic10Inu (ERC-20) A história do HarryPotterObamaSonic10Inu é marcada por vários marcos notáveis: Criação: O token surgiu de um meme viral, capturando a imaginação de muitos entusiastas de criptomoedas. Datas específicas de criação não estão disponíveis, sublinhando a sua ascensão orgânica. Listagem em Exchanges: O HarryPotterObamaSonic10Inu conseguiu entrar em várias exchanges, permitindo um acesso e negociação mais fáceis pela comunidade. Iniciativas de Envolvimento da Comunidade: Atividades contínuas direcionadas a melhorar a interação comunitária, incluindo concursos, campanhas em redes sociais e geração de conteúdo por fãs e defensores. Planos de Expansão Futura: O roteiro do projeto inclui o lançamento de uma coleção de NFTs, mercadorias e um site de eCommerce relacionado aos seus temas culturais, envolvendo ainda mais a comunidade e tentando adicionar mais dimensões ao seu ecossistema. Pontos-Chave sobre o HarryPotterObamaSonic10Inu (ERC-20) Natureza Orientada pela Comunidade: O projeto prioriza a contribuição coletiva e a criatividade, assegurando que o envolvimento dos utilizadores está na vanguarda do seu desenvolvimento. Classificação como Moeda Meme: Representa o epítome da criptomoeda baseada em entretenimento, destacando-se dos veículos de investimento tradicionais. Sem Afiliação Direta com o Bitcoin: Apesar da semelhança no nome do ticker, o HarryPotterObamaSonic10Inu é distinto e não tem qualquer relação com o Bitcoin ou outras criptomoedas estabelecidas. Foco na Colaboração: O HarryPotterObamaSonic10Inu é projetado para criar um espaço de colaboração e partilha de histórias entre os seus detentores, proporcionando uma via para a criatividade e o fortalecimento da comunidade. Perspectivas Futuras: A ambição de expandir além da sua premissa inicial para NFTs e mercadorias delineia um caminho para o projeto potencialmente entrar em avenidas mais mainstream dentro da cultura digital. À medida que as moedas meme continuam a capturar a imaginação da comunidade cripto, HarryPotterObamaSonic10Inu (ERC-20) destaca-se devido aos seus laços culturais e abordagem centrada na comunidade. Embora possa não se encaixar no molde típico de um token orientado para utilidade, a sua essência reside na alegria e camaradagem fomentadas entre os seus apoiantes, destacando a natureza em evolução das criptomoedas em uma era cada vez mais digital. À medida que o projeto continua a desenvolver-se, será importante observar como as dinâmicas comunitárias influenciam a sua trajetória no panorama em constante mudança da tecnologia blockchain.

2.4k Visualizações TotaisPublicado em {updateTime}Atualizado em 2024.12.03

O que é BITCOIN

Como comprar BTC

Bem-vindo à HTX.com!Tornámos a compra de Bitcoin (BTC) simples e conveniente.Segue o nosso guia passo a passo para iniciar a tua jornada no mundo das criptos.Passo 1: cria a tua conta HTXUtiliza o teu e-mail ou número de telefone para te inscreveres numa conta gratuita na HTX.Desfruta de um processo de inscrição sem complicações e desbloqueia todas as funcionalidades.Obter a minha contaPasso 2: vai para Comprar Cripto e escolhe o teu método de pagamentoCartão de crédito/débito: usa o teu visa ou mastercard para comprar Bitcoin (BTC) instantaneamente.Saldo: usa os fundos da tua conta HTX para transacionar sem problemas.Terceiros: adicionamos métodos de pagamento populares, como Google Pay e Apple Pay, para aumentar a conveniência.P2P: transaciona diretamente com outros utilizadores na HTX.Mercado de balcão (OTC): oferecemos serviços personalizados e taxas de câmbio competitivas para os traders.Passo 3: armazena teu Bitcoin (BTC)Depois de comprar o teu Bitcoin (BTC), armazena-o na tua conta HTX.Alternativamente, podes enviá-lo para outro lugar através de transferência blockchain ou usá-lo para transacionar outras criptomoedas.Passo 4: transaciona Bitcoin (BTC)Transaciona facilmente Bitcoin (BTC) no mercado à vista da HTX.Acede simplesmente à tua conta, seleciona o teu par de trading, executa as tuas transações e monitoriza em tempo real.Oferecemos uma experiência de fácil utilização tanto para principiantes como para traders experientes.

5.0k Visualizações TotaisPublicado em {updateTime}Atualizado em 2026.06.02

Como comprar BTC

O que é $BITCOIN

OURO DIGITAL ($BITCOIN): Uma Análise Abrangente Introdução ao OURO DIGITAL ($BITCOIN) OURO DIGITAL ($BITCOIN) é um projeto baseado em blockchain que opera na rede Solana, com o objetivo de combinar as características dos metais preciosos tradicionais com a inovação das tecnologias descentralizadas. Embora partilhe um nome com o Bitcoin, frequentemente referido como “ouro digital” devido à sua percepção como uma reserva de valor, o OURO DIGITAL é um token separado projetado para criar um ecossistema único dentro da paisagem Web3. O seu objetivo é posicionar-se como um ativo digital alternativo viável, embora os detalhes sobre as suas aplicações e funcionalidades ainda estejam em desenvolvimento. O que é o OURO DIGITAL ($BITCOIN)? OURO DIGITAL ($BITCOIN) é um token de criptomoeda explicitamente projetado para uso na blockchain Solana. Em contraste com o Bitcoin, que fornece um papel amplamente reconhecido como armazenamento de valor, este token parece focar em aplicações e características mais amplas. Aspectos notáveis incluem: Infraestrutura Blockchain: O token é construído na blockchain Solana, conhecida pela sua capacidade de lidar com transações de alta velocidade e baixo custo. Dinâmicas de Oferta: O OURO DIGITAL tem um fornecimento máximo limitado a 100 quatrilhões de tokens (100P $BITCOIN), embora os detalhes sobre o seu fornecimento circulante ainda não tenham sido divulgados. Utilidade: Embora as funcionalidades precisas não estejam explicitamente delineadas, existem indicações de que o token poderia ser utilizado para várias aplicações, potencialmente envolvendo aplicações descentralizadas (dApps) ou estratégias de tokenização de ativos. Quem é o Criador do OURO DIGITAL ($BITCOIN)? Neste momento, a identidade dos criadores e da equipa de desenvolvimento por trás do OURO DIGITAL ($BITCOIN) permanece desconhecida. Esta situação é típica entre muitos projetos inovadores no espaço da blockchain, particularmente aqueles alinhados com finanças descentralizadas e fenómenos de moedas meme. Embora tal anonimato possa fomentar uma cultura orientada pela comunidade, intensifica as preocupações sobre governança e responsabilidade. Quem são os Investidores do OURO DIGITAL ($BITCOIN)? As informações disponíveis indicam que o OURO DIGITAL ($BITCOIN) não tem apoiantes institucionais conhecidos ou investimentos proeminentes de capital de risco. O projeto parece operar num modelo peer-to-peer focado no apoio e adoção da comunidade, em vez de rotas de financiamento tradicionais. A sua atividade e liquidez estão principalmente situadas em exchanges descentralizadas (DEXs), como a PumpSwap, em vez de plataformas de negociação centralizadas estabelecidas, destacando ainda mais a sua abordagem de base. Como Funciona o OURO DIGITAL ($BITCOIN) A mecânica operacional do OURO DIGITAL ($BITCOIN) pode ser elaborada com base no seu design de blockchain e nas características da rede: Mecanismo de Consenso: Ao aproveitar o exclusivo proof-of-history (PoH) da Solana combinado com um modelo de proof-of-stake (PoS), o projeto assegura uma validação eficiente das transações, contribuindo para o alto desempenho da rede. Tokenomics: Embora mecanismos deflacionários específicos não tenham sido extensivamente detalhados, o vasto fornecimento máximo de tokens implica que pode atender a microtransações ou casos de uso de nicho que ainda estão por definir. Interoperabilidade: Existe o potencial para integração com o ecossistema mais amplo da Solana, incluindo várias plataformas de finanças descentralizadas (DeFi). No entanto, os detalhes sobre integrações específicas permanecem não especificados. Cronologia de Eventos Chave Aqui está uma cronologia que destaca marcos significativos relacionados ao OURO DIGITAL ($BITCOIN): 2023: O lançamento inicial do token ocorre na blockchain Solana, marcado pelo seu endereço de contrato. 2024: O OURO DIGITAL ganha visibilidade ao tornar-se disponível para negociação em exchanges descentralizadas como a PumpSwap, permitindo que os utilizadores o negociem contra SOL. 2025: O projeto testemunha atividade de negociação esporádica e potencial interesse em envolvimentos liderados pela comunidade, embora não tenham sido documentadas parcerias ou avanços técnicos notáveis até ao momento. Análise Crítica Forças Escalabilidade: A infraestrutura subjacente da Solana suporta altos volumes de transações, o que pode aumentar a utilidade do $BITCOIN em vários cenários de transação. Acessibilidade: O potencial preço de negociação baixo por token pode atrair investidores de retalho, facilitando uma participação mais ampla devido a oportunidades de propriedade fracionada. Riscos Falta de Transparência: A ausência de apoiantes, desenvolvedores ou um processo de auditoria publicamente conhecidos pode gerar ceticismo em relação à sustentabilidade e confiabilidade do projeto. Volatilidade do Mercado: A atividade de negociação depende fortemente do comportamento especulativo, o que pode resultar em volatilidade significativa dos preços e incerteza para os investidores. Conclusão O OURO DIGITAL ($BITCOIN) surge como um projeto intrigante, mas ambíguo, dentro do ecossistema em rápida evolução da Solana. Embora tente aproveitar a narrativa do “ouro digital”, a sua divergência do papel estabelecido do Bitcoin como reserva de valor sublinha a necessidade de uma diferenciação mais clara da sua utilidade pretendida e estrutura de governança. A aceitação e adoção futuras dependerão provavelmente da abordagem da atual opacidade e da definição mais explícita das suas estratégias operacionais e económicas. Nota: Este relatório abrange informações sintetizadas disponíveis até outubro de 2023, e desenvolvimentos podem ter ocorrido além do período de pesquisa.

545 Visualizações TotaisPublicado em {updateTime}Atualizado em 2025.05.13

O que é $BITCOIN

Discussões

Bem-vindo à Comunidade HTX. Aqui, pode manter-se informado sobre os mais recentes desenvolvimentos da plataforma e obter acesso a análises profissionais de mercado. As opiniões dos utilizadores sobre o preço de BTC (BTC) são apresentadas abaixo.

活动图片