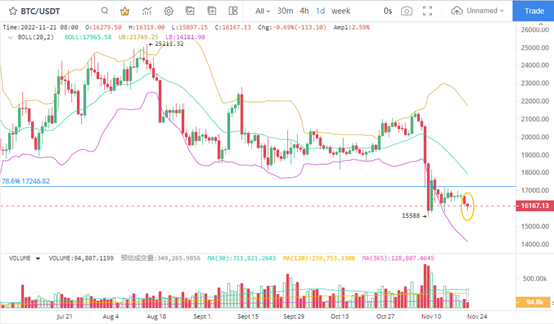
【重磅解读】 粉丝代币CHZ释放抛压,BTC长期投资者仍然出逃

jinjin说币Publicado em 2022-11-21Última atualização em 2022-11-22

Resumo

BTC价格继续调整,粉丝代币CHZ表现低迷。

1、BTC重新测试低点支撑

BTC价格在日K线图中第二次出现回落表现,价格以及达到了最低15815美元附近,迹象测试前期15588美元的支撑效果。从BTC反弹后回落表现来看,价格走势仍然较弱。日线级别的成交量并不高,使得近期的行情仍然处在弱势整理阶段,并且不排除收盘价会达到新低的情况出现。

压力位方面,BTC仍然在斐波那契78.6%对应的17246美元以下运行,因此可继续关注BTC反弹的压力位表现。仍然预判价格会维持压力位下方运行。
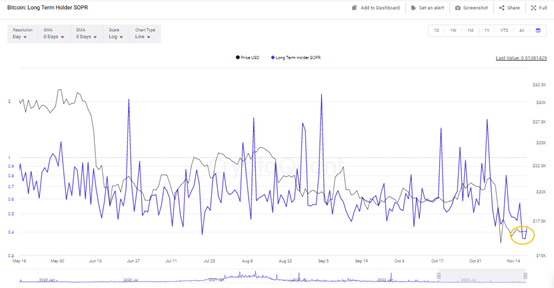
2、BTC 长期投资者继续出逃

随着调整的深入,BTC持币时间在155个交易日以上的投资者继续出逃,并且是以亏损状态下转账BTC。据此判断,BTC价格颓势还未结束,至少抛压仍然维持在高位运行。

SOPR占比数值在11月17日和18日达到了0.370和0.367,长期投资者亏损空间在60%以上。因此,在长期投资者持续换手的情况下,BTC价格近期机会减少。长期投资者的SOPR指标达到3年来最低水平,行情仍然以调整为主。
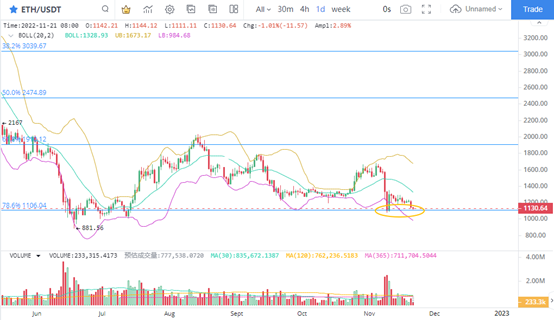
3、ETH短线回撤到支撑位

与BTC不同的是,ETH价格回撤期间达到了支撑线附近,斐波那契78.6%对应的1106美元支撑较强,已经成为价格短线走强的其实点位。实际上,ETH价格以及处在了半年来的低点附近,因此进一步破位前,首先要突破支撑线才行。目前来看,ETH价格走势较弱,但是跌幅仍然可控。因此可继续关注支撑线附近的交易机会。
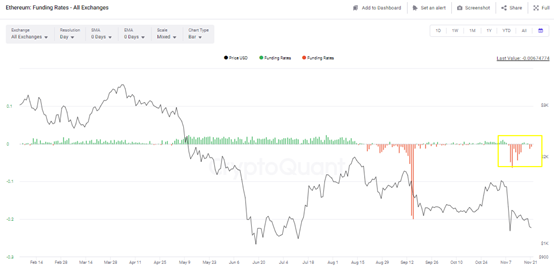
4、ETH融资利率仍然低迷

ETH融资利率低位运行,数值上看,近期仍然维持在0以下的区域。这表明,经过了前期充分的下跌调整以后,多空实力已经在近期得到体现,多头并未积极抄底,预示着ETH价格近期维持底部区域运行。从绝对数值上看,ETH半年来的融资利率曾经得到9月15日的-0.199,也达到了11月10日的0.062。
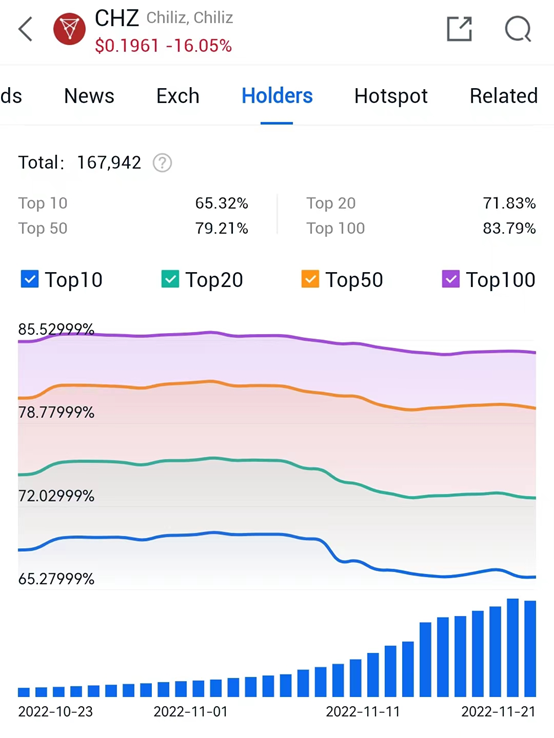
5、 CHZ主力表现低迷

粉丝代币CHZ 短线价格表现相对低迷,同时持币前10到持币前100的主力中,这部分主力持币稳中有降低迹象。据此判断,CHZ价格走势上仍旧表现为大幅度回撤。尽管如此,仍旧有迹象表明投资者在积极买入,融资利率达到了0.0309%,为年内最高值,就很能说明问题。考虑到价格处在0.2美元以下的区间低位,可积极关注低吸机会。

Leituras Relacionadas

Bitcoin Trading Strategy Breakdown: Celebrity Predictions and Classic Models All Fail, Only These Four Indicators Remain

Analysis of Bitcoin Trading Strategies: Why Celebrity Forecasts and Classic Models Fail, Leaving Only These Four Reliable Indicators This analysis examines the failure of common Bitcoin prediction methods and identifies four reliable indicators for constructing a trading strategy. The author reviewed all major BTC prediction approaches from 2017-2025, categorizing them into three groups: celebrity price targets (consistently over-optimistic), analytical models like Stock-to-Flow (broken post-2022), and on-chain signals. The key finding is that more data often creates confusion, not clarity. The strategy discards unreliable elements: celebrity predictions (incentivized to be extreme), pure models (invalidated by post-ETF market changes), and the Fear & Greed Index used alone (too many false signals). Four reliable indicators were selected: 1. **MVRV Z-Score:** Accurately identifies cycle bottoms when entering its green zone (e.g., 2018, 2020, 2022). Note: Its ability to call tops is now ineffective post-2024. 2. **SOPR (28-day MA):** Consistently signals bottoms when below 1.0, indicating holders are selling at a loss. 3. **ETF Net Flow:** A crucial post-2024 metric showing institutional momentum (e.g., sustained inflows = buying). 4. **Macro Liquidity (Fed policy & M2):** Sets the overall directional bias (e.g., bullish during easing cycles). The core strategy involves waiting for a multi-signal共振 (resonance). For example, a bottom signal requires MVRV in the green zone + SOPR < 1.0. A top signal requires overheated on-chain data + sustained ETF outflows. Macro policy sets the overall direction. The Fear & Greed Index is only used as a weighted confirmatory signal, never alone. Action is only taken when three or more indicators align. The author automated this into a monitoring system that sends Telegram alerts only when signals trigger. As of the article's date (April 15, 2026), the system showed a strong bottom signal: extreme fear (F&G=12), MVRV in the buy zone, and SOPR < 1.0. The only contrary signal was weak ETF flows. Historically, such triple on-chain共振 has preceded 100%+ returns. The conclusion emphasizes building a personal framework over relying on external predictions, allowing for iterative improvement and customization based on individual risk tolerance.

marsbitHá 1h

Bitcoin Trading Strategy Breakdown: Celebrity Predictions and Classic Models All Fail, Only These Four Indicators Remain

marsbitHá 1h

Trading

Spot
Futuros
活动图片