USDT Dominance, a measure of the crypto market cap held in Tether, has been on the rise since mid-August. This was a signal that market participants preferred to hold the stablecoin rather than a crypto asset. Bitcoin has held on to the $19k support in recent weeks, but it too steadily approached the lows of a four-month range.
""
Indirectly, it was also a signal of the bearish sentiment across the market. News of inflation and rising interest rates chokes money supply to risk-on assets such as Bitcoin, and recovery could be months or even years away.
""
Bollinger bands signal a massive squeeze in progress
Source: TradingView
""
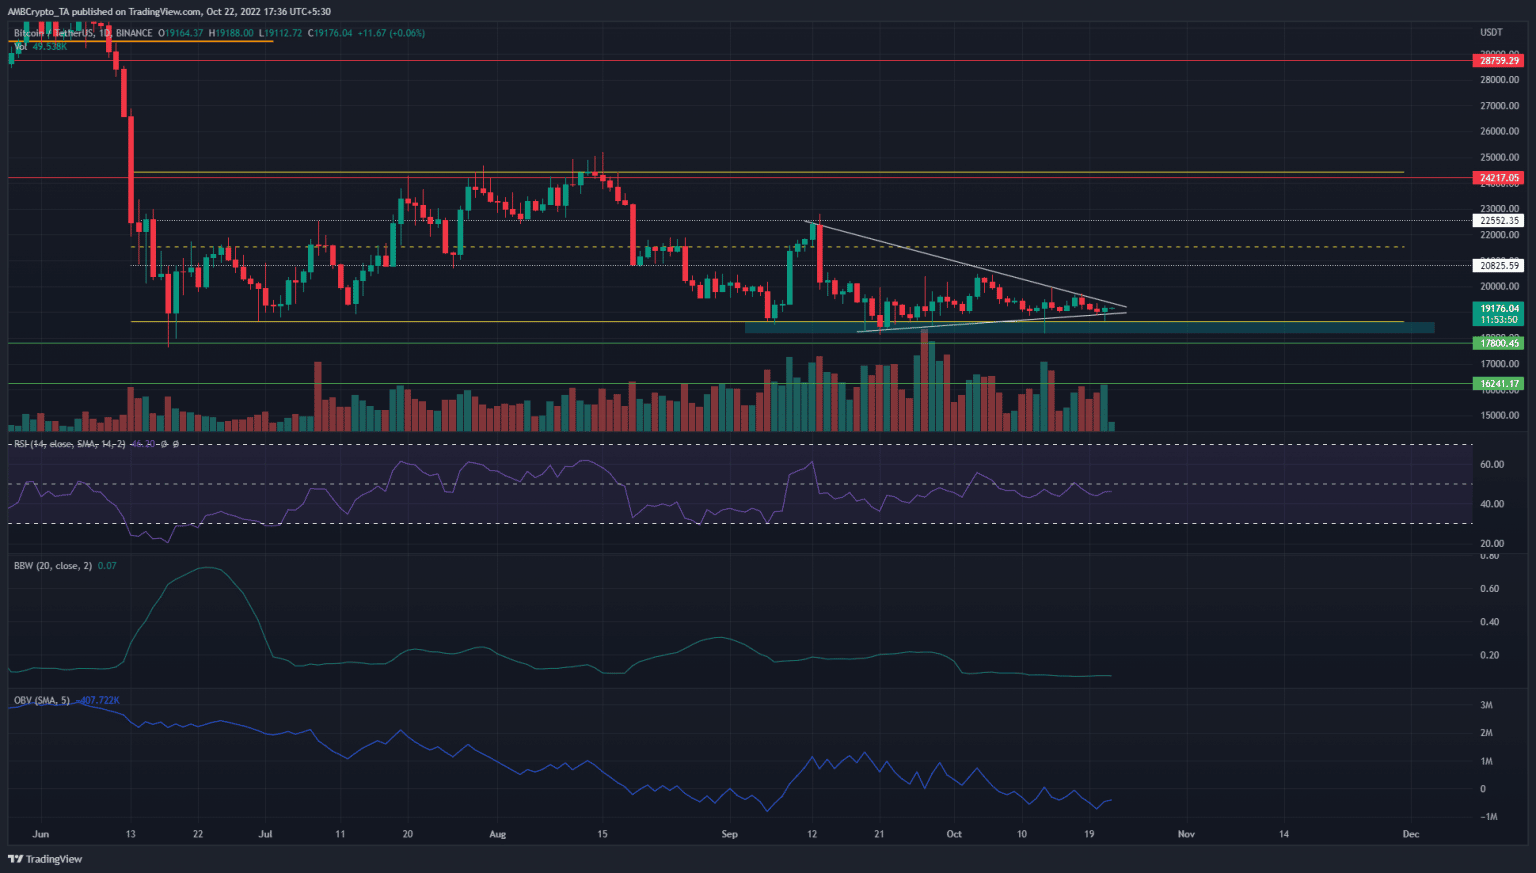
Since June, BTC has traded within a range from $24.4k to $18.6k. The lows of this long-term range have been tested multiple times since September. Each retest yielded a weaker response than the preceding one.
""
This would likely see buyers exhausted in the upcoming retests, and BTC could crash right through the support levels at $17.8k and $17k. How much further south can it go? It was a scary thought for the bulls, but $16.2k could become a feasible target.
""
The Relative Strength Index (RSI) has faced resistance at neutral 50 and was simply unable to climb above it in recent weeks. The On-Balance Volume (OBV) was also in decline since mid-September and showed selling pressure has been the more dominant force.
""
The Bollinger Bands width indicator reached a low of 0.07 on the daily chart, a value it previously reached in October 2020. While that was followed by a slow, massive rally, the current contraction of Bitcoin could have a different flavor.
""
Exchange supply reached new lows
Source: Santiment
""
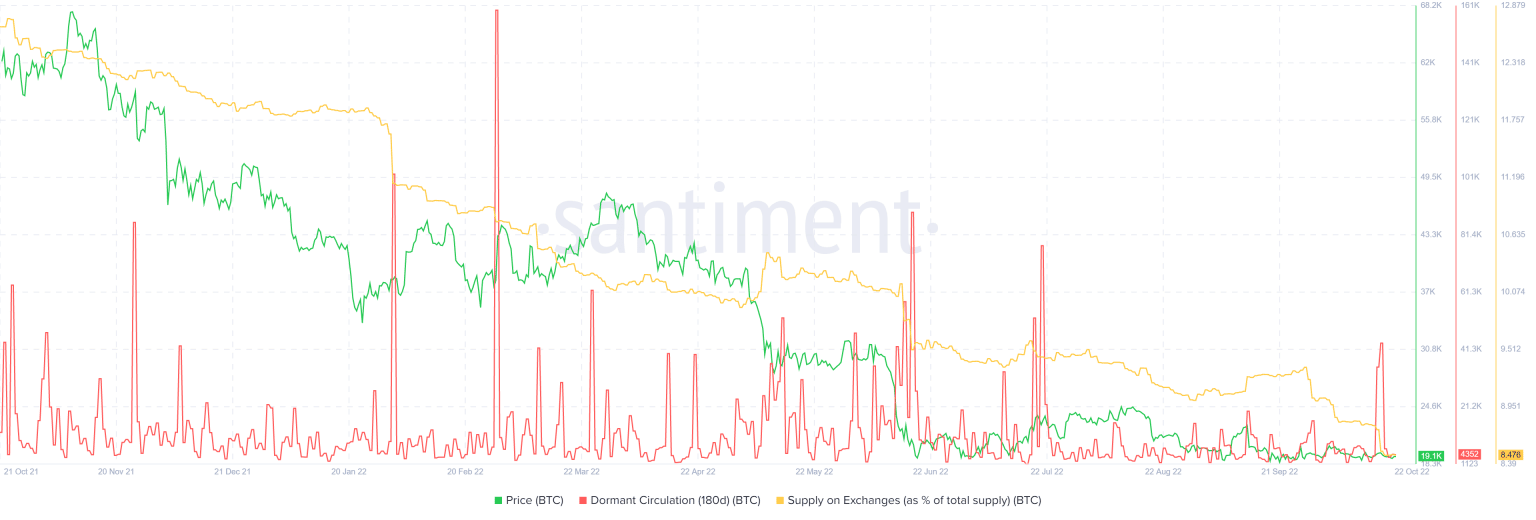
The Supply on Exchanges metric has been falling all year. This showed coins were moved out of exchanges and onto private, likely cold wallets. This was likely a sign of accumulation. The last time the exchange % had been this low was back in November 2018.
""
The dormant circulation saw a large spike a few days ago. The same chart showed this to be a BTC move off the exchanges. Since July, the dormant circulation has been rather minimal for the most part and did not witness huge surges.
Hash rate on the rise, but profitability isn’t
Source: Blockchain.com
""
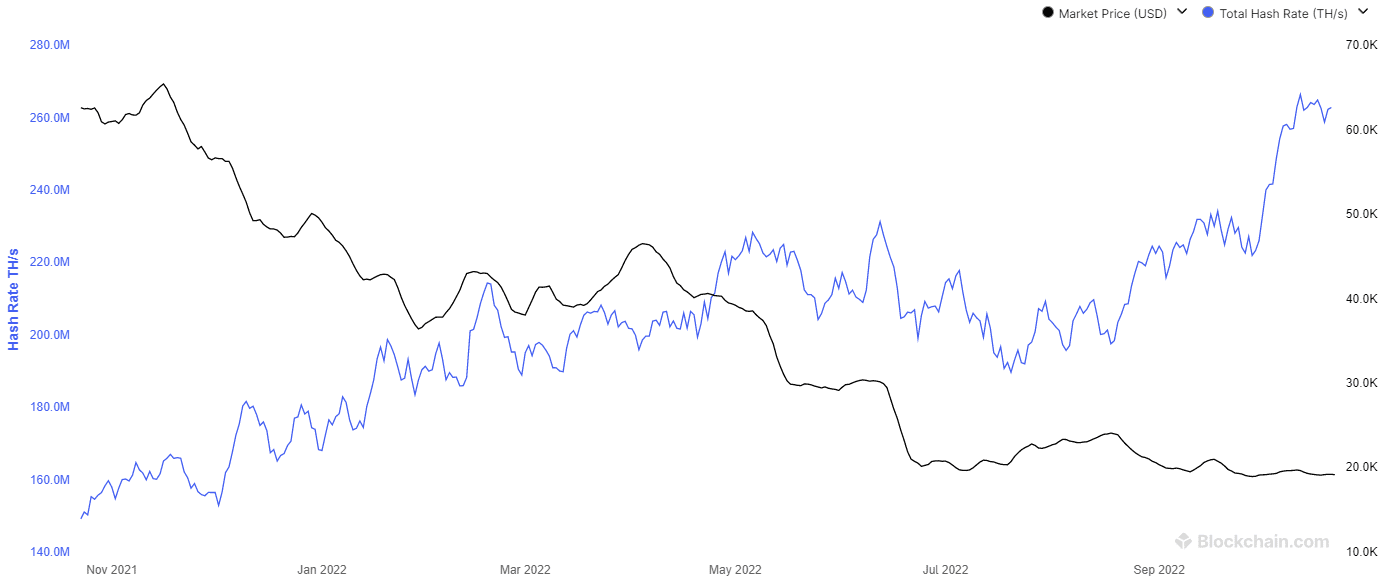
Throughout all these months, the Bitcoin hash rate has gone higher. This was a positive outcome, as the network was more secure against 51% attacks. At the same time, the BTC miner profitability also declined. It stood near the lows from October 2020 at USD 0.066/day per 1THash/s.
""
Will miners eventually cave in and be forced to sell their BTC? Or has the accumulation in recent years much reduced the risk of another miner capitulation event? Only time would tell, but one way or another, something has to give.