1. BTC short line is in the stage of preparation
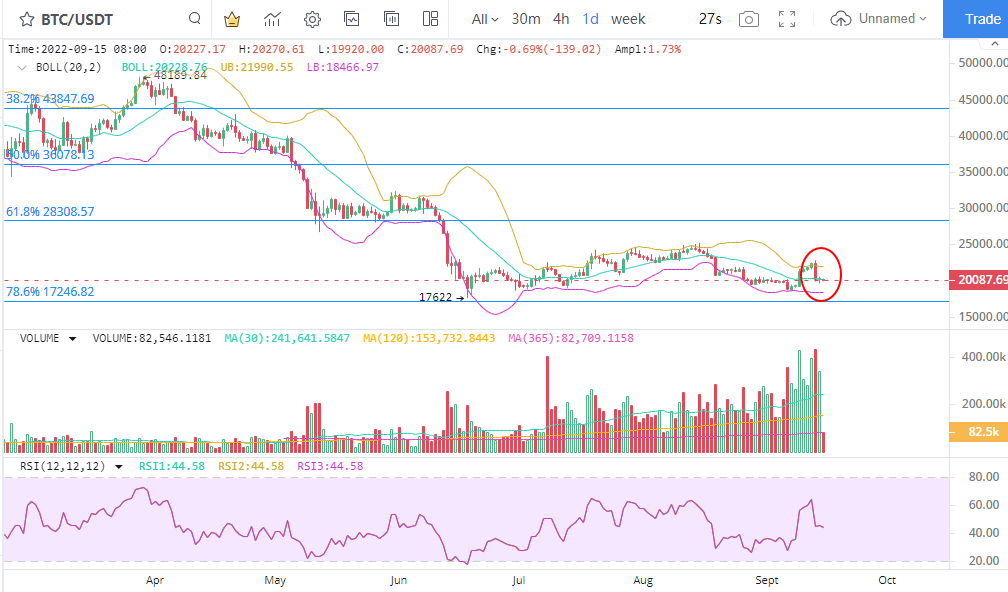
The BTC price continued to fluctuate in areas with intensive transactions. In the short term, the price fluctuation space is small, and it is still in the stage of energy continuation. Therefore, BTC operation will remain stable in the short term. At present, the spot trading volume in the recent two weeks is very high, making BTC in the price range with relatively concentrated currency holding costs. Therefore, typical buying and selling signals will not appear until BTC successfully leaves the range.
Judging from the concentration of the main players holding coins, the concentration of Jujing's holding coins has decreased to the low point within the year, which means that there are more opportunities for the market to retreat downward.
2. BTC's address of holding coins drops
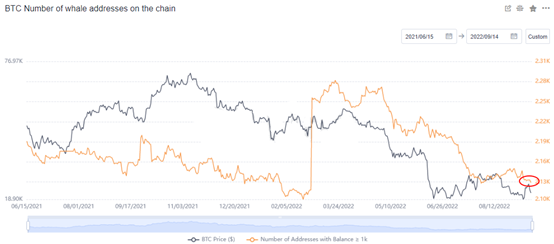
From the changes in the number of whale addresses of BTC, the recent decline in the number of whale addresses shows that the main investors have been in the currency issuing stage, and the signs of selling are growing. The number of BTC addresses dropped from 2282 at the beginning of the year to 2119 on September 14, a decrease of 163. A total of 163000 BTCs were transferred. From this perspective, BTC does not have the basis for a sustained rebound.
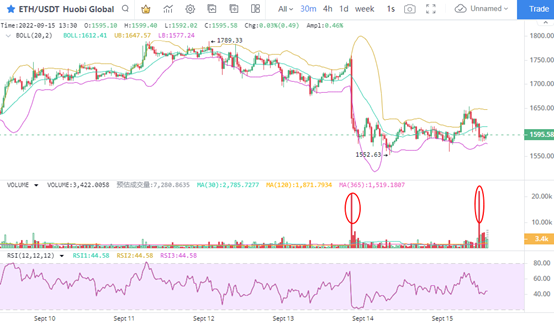
3. ETH scaling back
After the price continued to fall on September 13, the shock of ETH never ended. Especially when the trading volume has two consecutive pulse peaks, the main force has a strong impact on ETH. It is worth noting that the two impulse trading volumes both occurred during the ETH price pullback period, indicating that short sellers actively traded ETH, making the market more uncertain. After the large-scale decline, ETH will maintain its large-scale performance for a short period of time. Next, ETH is still under great rebound pressure, and the whole point of USD 1600 has become an important pressure line.
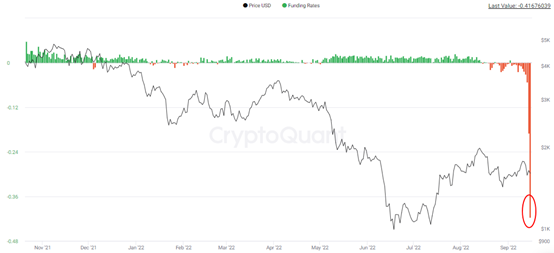
4. ETH financing interest rate plummeted
In terms of contracts, ETH's financing interest rate dropped significantly, to the lowest level in a year. The financing interest rate from September 13 to September 15 dropped to -0.053, -0.189 and -0.441. Among them, -0.189 and -0.441 are financing interest rates under abnormal conditions, which have never occurred since October 2019. According to this judgment, ETH's short-term contract trading initiative is obviously in the short side, and the bulls have no intention of bottoming at the low side, which makes ETH continue to be dumped one-sided. The bearish signal is very significant.
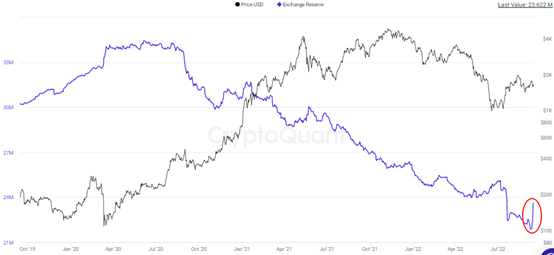
5. ETH flows into the exchange in large quantities
In terms of spot trading, the number of ETH flowing into the exchange remained at a high level. Since September 9, the number of ETHs flowing into the exchange has increased to 23.62 million in September, an increase of 1.76 million ETHs. At $1650, it is worth $2.9 billion. Compared with the flow of ETH in the past year, it is now the strongest flow of ETH. Considering that the number of ETH in the exchange is small, the impact on the price will increase significantly in the near future after the number of ETH flowing into the exchange explodes.