Bitcoin price has been defeated by the bears after it traded around the $20,000 mark for quite some time. Over the last 24 hours, the coin fell by 2.1% and in the past week Bitcoin price lost close to 5% of its value.
At the current moment, the coin was trading at the $19,000 price level.
The price of the asset has been directly tied to the U.S Federal Reserve hiking the interest rates. Bitcoin similarly continued to face selling pressure on its chart.
The technical outlook continued to demonstrate a fall in buying strength.
The price of the asset currently has been demonstrating consolidation on its chart. If the coin continues to display minimum price action, Bitcoin price could again drop to the $18,000 zone.
There is a tight zone within which the coin has been trading and without the help of the buyers, a move above the current resistance zone seems unlikely.
In such as case, the asset could travel south in a matter of the text trading sessions.
Bitcoin Price Analysis: One Day Chart
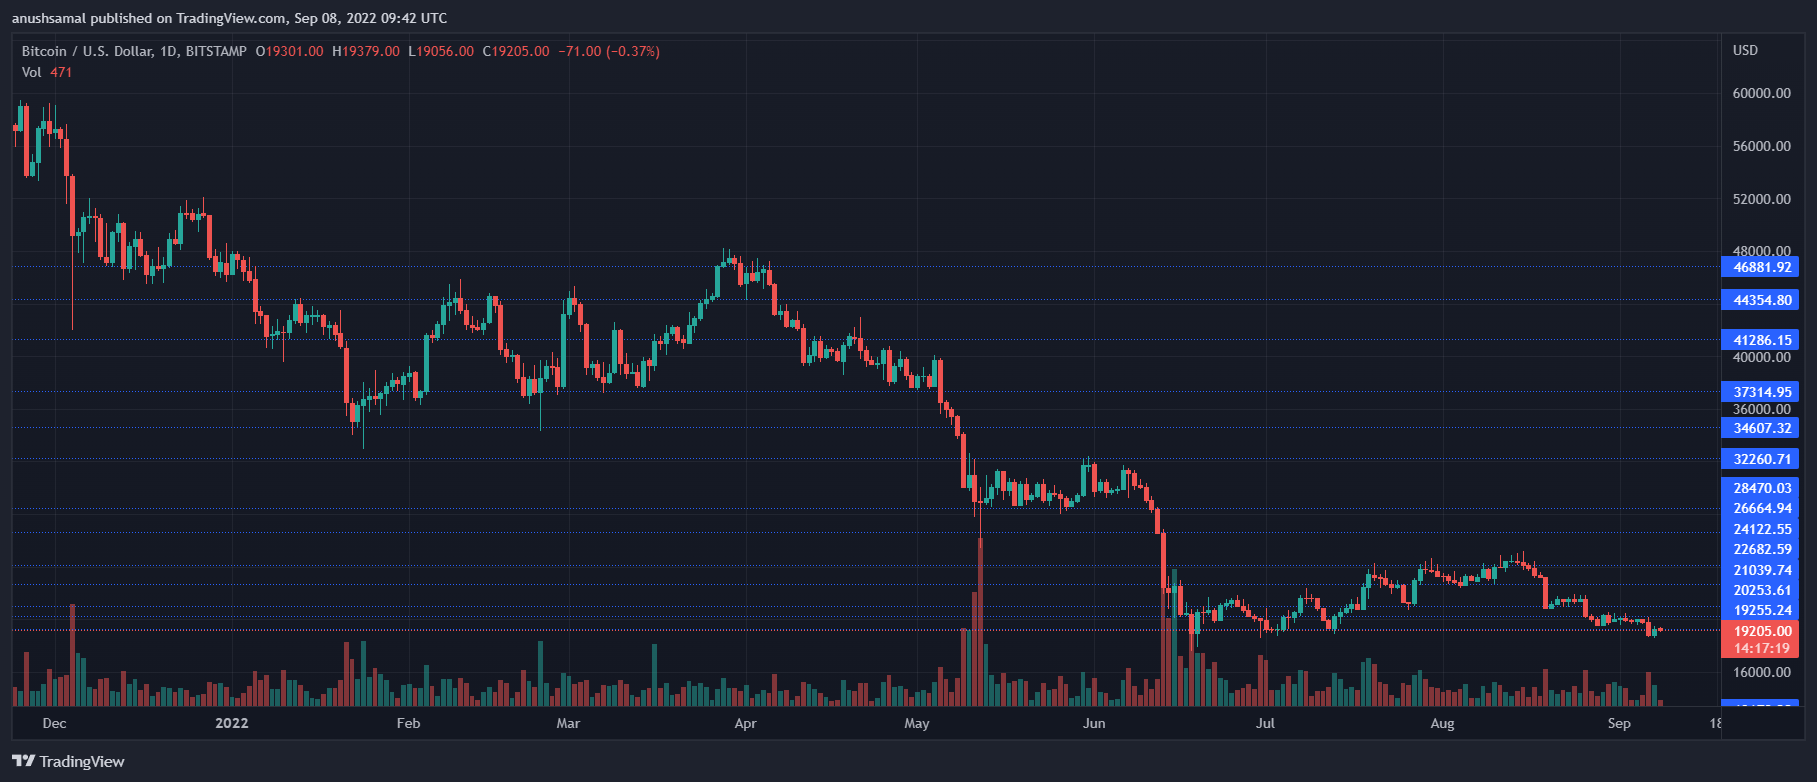
Bitcoin was priced at $19,100 on the one-day chart | Source: BTCUSD on TradingView BTC was trading for $19,100 at the time of writing. After trading around the $20,000 price level for a considerable period of time, the selling pressure intensified.
Overhead resistance for the coin stood at $20,200 but in between Bitcoin could make a stop at $19,600. A move above the $20,200.
If the coin continues to move down due to selling pressure, it could break below the $18,000 price mark and fall to trade near $15,000.
A move above the $24,000 price level can also help Bitcoin price rally to $30,000. The amount of Bitcoin traded fell significantly in the last session indicating an increase in selling strength.
Technical Analysis
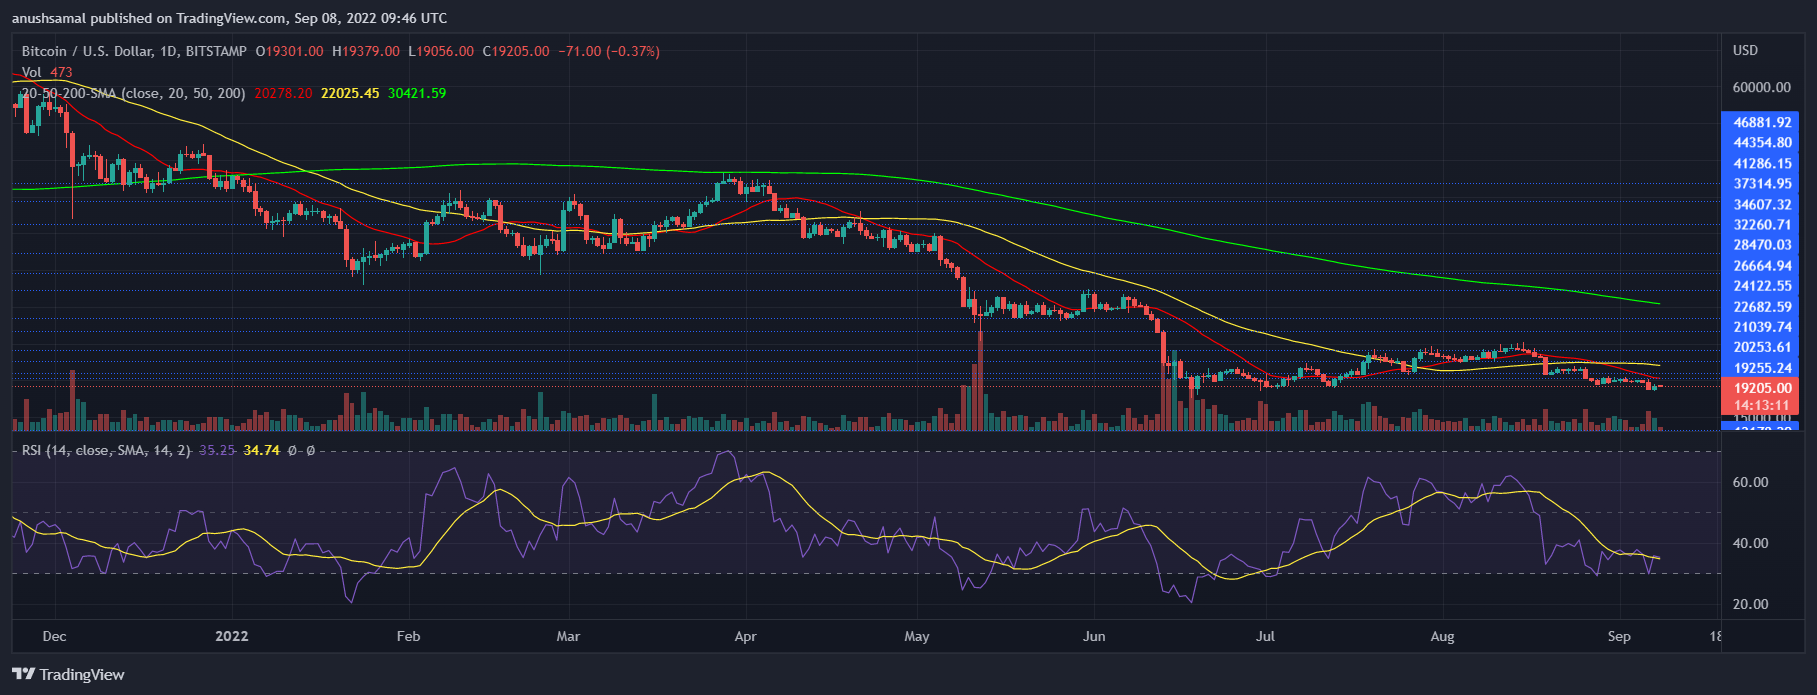
Bitcoin displayed a fall in buying strength on the one-day chart | Source: BTCUSD on TradingView BTC noted a sharp fall in demand on its one-day chart. This meant that demand for the coin above the $19,000 price level was high.
A move above the $19,000 price mark could again bring the demand back for the coin which could increase the influx of buying strength.
The Relative Strength Index was below the half-line and was quite close to the oversold zone. There was a tiny uptick however, that didn’t mean buyers were back.
Bitcoin price moved below the 20-SMA line and that signalled that sellers were driving the price momentum in the market.
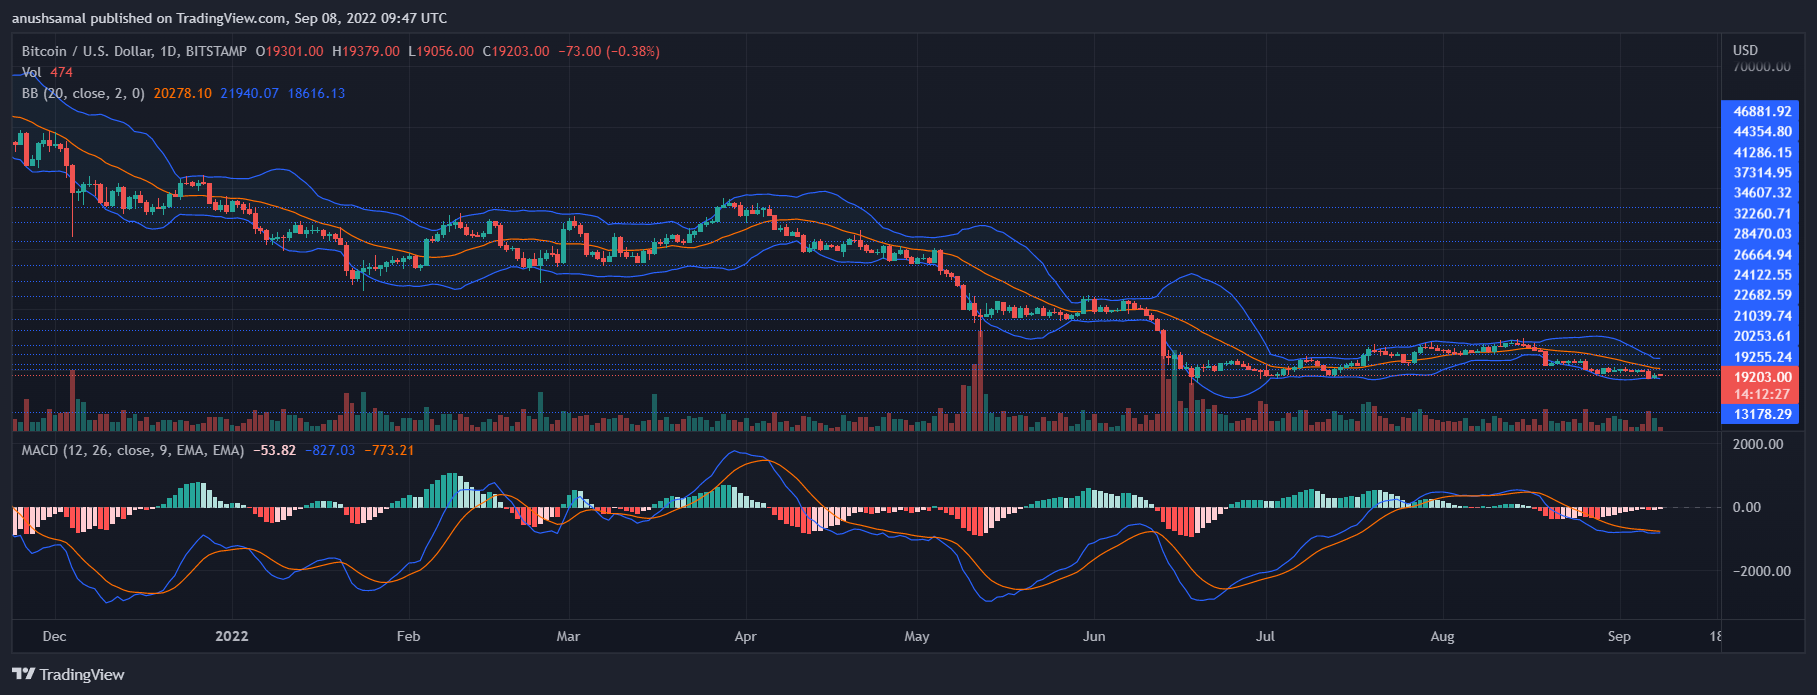
Bitcoin flashed sell signal on one-day chart | Source: BTCUSD on TradingView The coin’s other technical indicators have also pointed towards bearishness on the chart.
Moving Average Convergence Divergence underwent a bearish crossover and displayed red bars under the half-line which was a sell signal for the coin.
Bollinger Bands read the price volatility and chance of a price fluctuation. The bands have tightened and that is a sign of incoming price volatility or an explosive price movement.
Once, the Bitcoin price rises above the 20-SMA then the coin might briefly move north on its chart.