Bitcoin Consolidates for Next Move, HYPE Restarts Bearish Trend | Guest Analysis

Odaily星球日报Publicado em 2026-07-20Última atualização em 2026-07-20

Resumo

Bitcoin fluctuates around the key resistance zone of $65,700-$67,300 after rebounding from the $57,820 low. A break above this area could shift the short-term structure to a stronger bullish logic; otherwise, a daily-level correction may resume. The medium-term outlook remains bearish, with a 20% short position held. Short-term trading involves 30% capital for price differential opportunities, with prepared plans (A: shorting near resistance; B: testing long near $57,820 support) based on model signals. A previous short-term long trade yielded a 3.45% profit. HYPE continues its correction from the $72.97 high, with focus on the $62-$63.5 resistance area. The 4-hour chart analysis suggests the downtrend is not over, and new lows below $58.16 are likely. The strategy is to consider light short positions (under 30% allocation) if price rallies to the $62-$63.5 zone and shows reversal signals, with strict stop-loss discipline. General reminder: Always set initial stop-losses, move them to breakeven at +1% profit, and trail them to lock in gains. Market conditions change rapidly; this analysis is for personal trading log purposes only and not investment advice.

This week, Bitcoin continued its rebound above the low of $57,820, with the price approaching the critical resistance zone of $65,700~$67,300. The battle between bulls and bears has entered a white-hot stage—if the rebound is rejected and falls back within this zone, a daily-level correction may resume; if it breaks through effectively, the short-term structure will shift to a stronger bullish logic. HYPE extended its correction from the high of $72.97, with this week's focus on the battle outcome in the $62~$63.5 zone. The medium-term view remains bearish-dominated, while short-term operations should strictly follow model signals, dynamically switching between Plan A and B.

Summary of This Week's Core Trading Views:

  • BTC Multi-Timeframe Structure Analysis (Detailed in Part 1)
  • BTC Weekly Market Forecast & Medium/Short-term Trading Strategies (Detailed in Part 2)
  • HYPE Hourly Chart Structure Analysis (Detailed in Part 3)
  • HYPE Weekly Market Forecast & Short-term Trading Strategies (Detailed in Part 4)

Market Verification of Last Week's Trading Strategies & Core Views:

  • BTC Market Forecast Verification: Last week's article clearly stated that Bitcoin's daily chart entered a short-term consolidation pattern. The subsequent market movement confirmed our prediction.
  • BTC Short-term Trading Performance: One short-term long trade (1x leverage) on Bitcoin was completed last week, achieving a profit of approximately 3.45%. (Detailed in Part 5)
  • HYPE Market Forecast Verification: Last week's article clearly stated: If prices rebound early in the week but fail to break the previous high of $72.97, it would signal a reversal of the prior uptrend, indicating a daily-level correction starting from the high of $72.97. The current market movement is highly consistent with our judgment.

一、Bitcoin Multi-Timeframe Structure Analysis

1、Bitcoin Daily Chart Structure Analysis: (Based on post-May 6th price action)
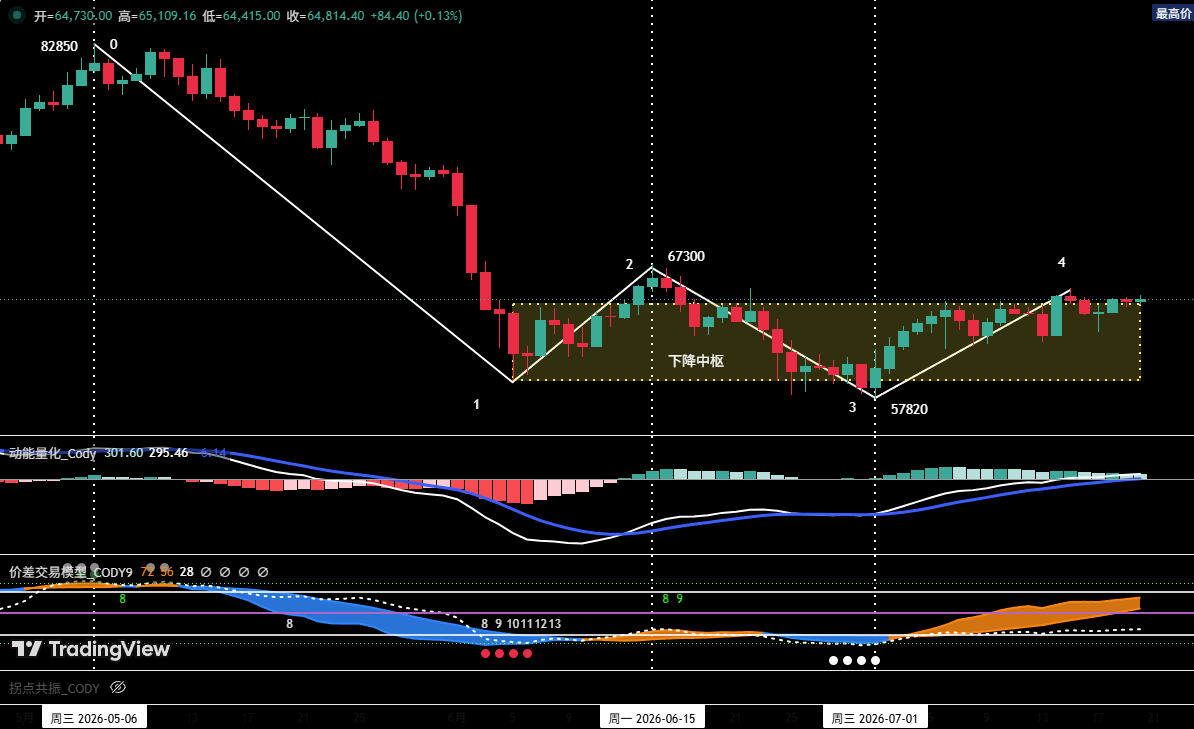
Figure 1 Bitcoin Daily Candlestick Chart

1 As shown in (Figure 1): The corrective move starting from the May 6th high of $82,850 has formed a four-segment corrective structure on the daily chart: (0-1), (1-2), (2-3), (3-4).

2 After touching the low of $57,820 on July 1st, the market is currently in the (3-4) rebound segment. The rebound high has reached $65,600, with the price approaching the key resistance around $65,700. Currently, this rebound segment may not be over, and the recent high of $65,600 is likely not the terminal point "Endpoint 4".

3 If the (3-4) rebound segment shows clear signs of exhaustion and adjustment upon encountering resistance in the $65,700~$67,300 zone, then the first daily-level segment (i.e., wave a) of the rebound starting from the July 1st low of $57,820 may have concluded.

2、In-Depth Analysis of Bitcoin Hourly Chart Structure: (Using 4-hour as analysis cycle)
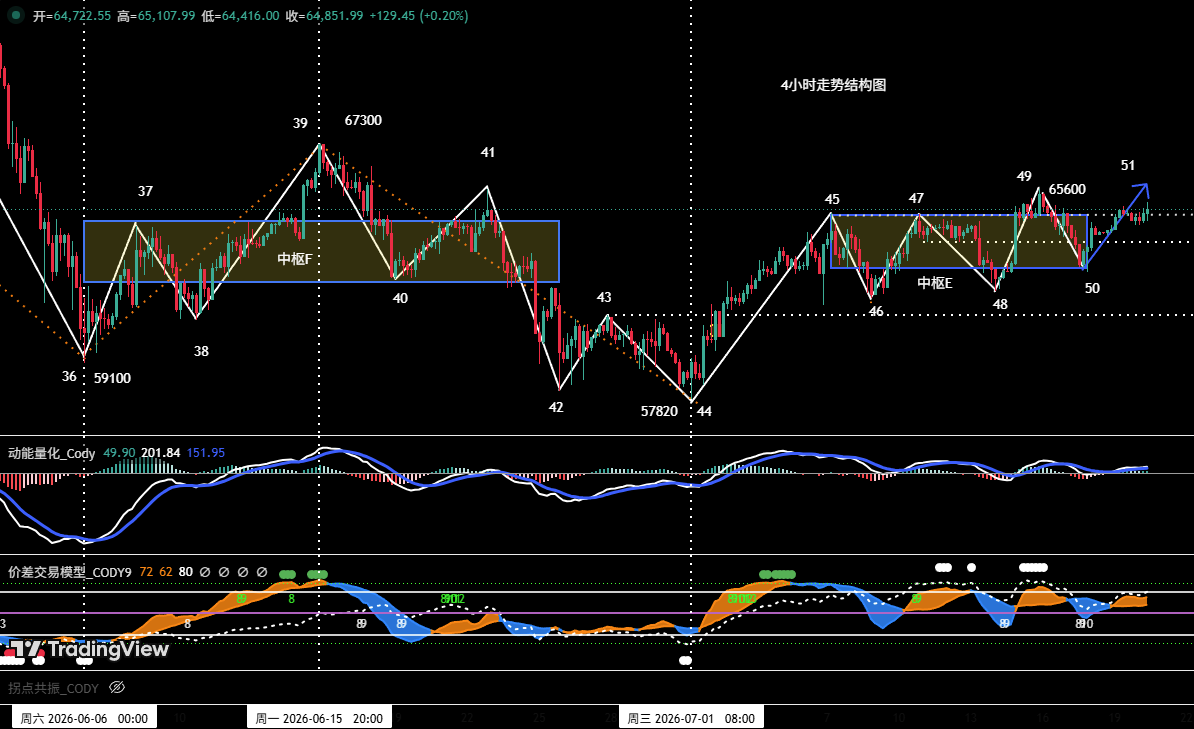
Figure 2 Bitcoin 4-Hour Candlestick Chart

1 In the 4-hour chart, the rebound from the July 1st low of $57,820 has clearly presented a seven-segment structure from (44-45) to (50-51). Among them: segments (45-46), (46-47), (47-48), (48-49), (49-50) overlap, forming a "five-segment" consolidation zone E.

2 Based on the current structure analysis, the price is currently in the (50-51) rebound segment.

  • If the price effectively breaks above the $65,700 resistance and the rebound continues, the probability of this segment upgrading into the breakout leg from the consolidation zone increases significantly. At that point, its momentum should be compared with the entry leg (44-45). If a momentum divergence forms between them when "Endpoint 51" terminates, the rebound starting from "Endpoint 44" (~$57,820) may end, with a high probability of a subsequent correction.
  • If the rebound fails to effectively break above the $65,700 resistance, the price is likely to remain in range-bound consolidation in the short term.

二、Bitcoin Weekly Market Forecast & Trading Strategies

1、BTC Weekly Market Forecast:

Core View for the Week: Focus on the test results when the price rebounds to the key resistance zone of $65,700~$67,300.

2、Core Resistance Levels:

  • First Resistance Zone: $65,700~$67,300 area (Previous significant resistance)
  • Second Resistance Zone: $69,500~$71,000 area (Previous significant resistance)

3、Core Support Levels:

  • First Support Level: Around $64,700 (Previous important support)
  • Second Support Zone: $60,950~$62,000 area (Previous important support)
  • Third Support Level: Around $57,820 (Previous important support)

4、Weekly Trading Strategies (Excluding sudden news impacts)

1 Medium-term Strategy:
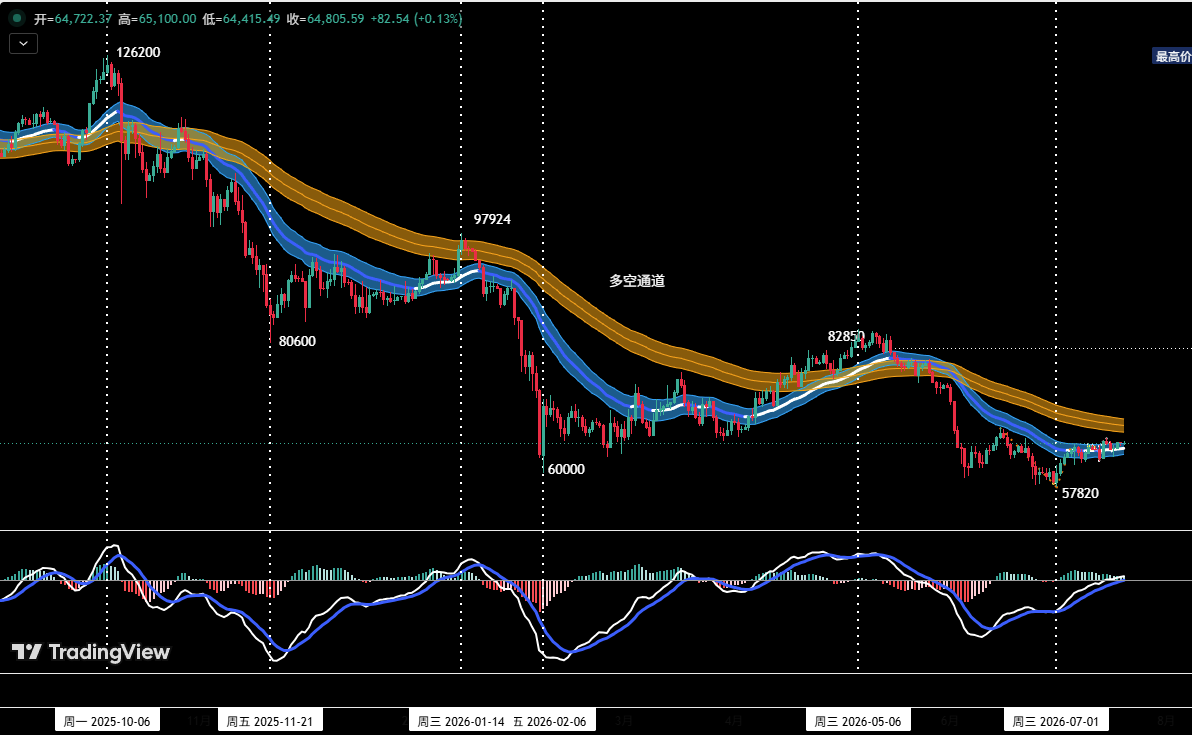
Figure 3 Bitcoin Daily Candlestick Chart: (Position Monitoring Model)

Position Monitoring Model: As shown in (Figure 3), the current price has effectively broken below the "Bull-Bear Channel," confirming a shift to a bearish-dominated market structure.

  • Current medium-term bearish positions are maintained at around 20%.
  • If the price shows signs of exhaustion upon rebounding to the $65,700~$67,300 zone, combined with top signals from the proprietary quantitative model, consider increasing medium-term bearish positions to within 50%.

2 Short-term Strategy:

Utilize 30% of capital, set stop-losses, and look for "spread" trading opportunities based on support and resistance levels. (Using 30-minute/60-minute as the operation cycle)

3 In short-term operations, to dynamically respond to complex market changes, we have prepared two specific contingency plans: A and B.

Plan A: Tentative Short at Strong Resistance Zone

  • Entry: If the price encounters resistance upon rebounding to the $65,700~$67,300 zone, combined with top signals from the quantitative model, consider establishing a short position of around 30%.
  • Risk Control: Set an initial stop-loss.
  • Exit: Gradually close the position to realize profits when the price adjusts near important support levels, combined with model signals.

Plan B: Light Long Test at Strong Support Zone

  • Entry: After the price is rejected from the $65,700~$67,300 zone and falls back, if signs of stabilization appear above the previous low of $57,820, combined with bottom signals from the quantitative model, consider establishing a long position of around 30%.
  • Risk Control: Set an initial stop-loss.
  • Exit: Gradually close the position to realize profits when the price rebounds near important resistance levels, combined with model signals.

三、HYPE Hourly Chart Structure Analysis
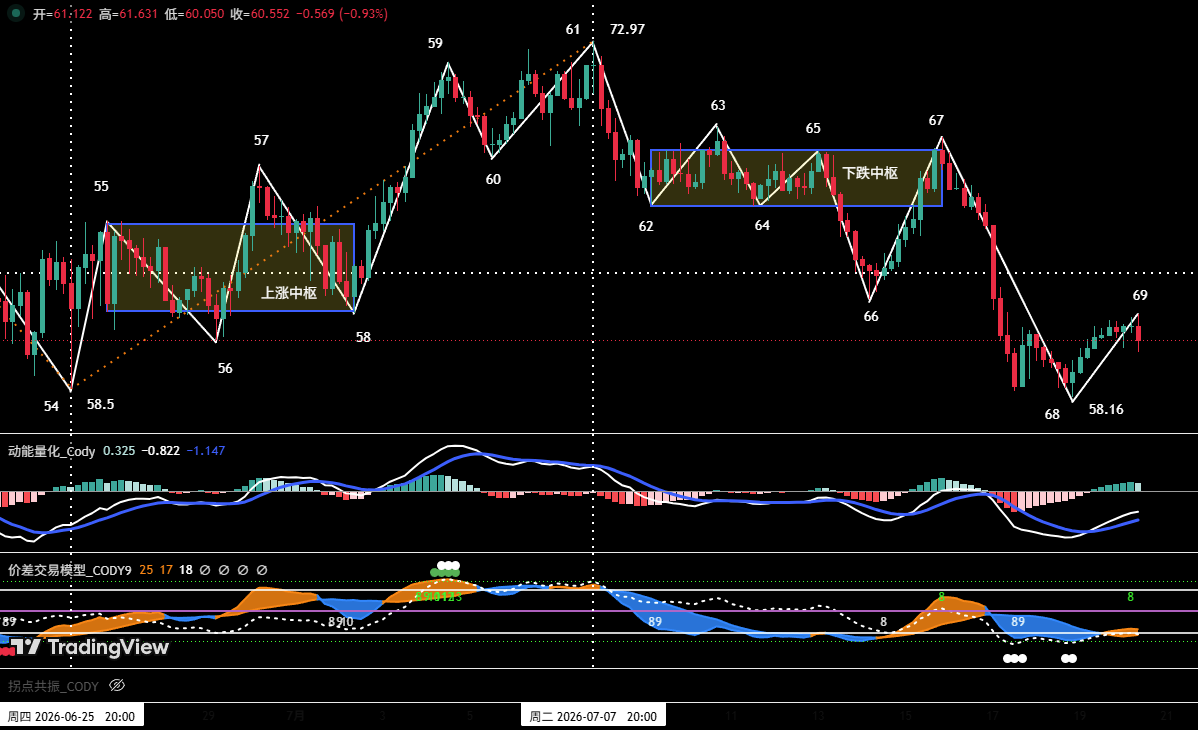
Figure 4 HYPE 4-Hour Candlestick Chart

1. As shown in (Figure 4), the correction in HYPE starting from the July 7th high of $72.97 (Endpoint 61) can be subdivided into an eight-segment corrective structure on the 4-hour chart. Segments 62-63, 63-64, 64-65, 65-66, 66-67 overlap, forming a "five-segment" bearish consolidation zone.

2. Last week's review pointed out: When the market subsequently ran the (62-63) rebound segment, if "Endpoint 63" failed to break the previous high "Endpoint 61" ($72.97), it would mean the end of the daily uptrend from "Endpoint 54 to Endpoint 61," and the market would start a daily-level correction from "Endpoint 61." The market corrected as expected last week, falling from "Endpoint 63 to Endpoint 68," with a maximum decline of approximately 16.17%.

3. Based on the 4-hour chart analysis:

Comparing the momentum of the breakout leg (67-68) with the entry leg (61-62), the downward momentum of the breakout leg is significantly stronger than the former. This suggests a lower probability that "Endpoint 68" ($58.16) is the low of this correction. The market is currently in the (68-69) rebound segment, after which prices may potentially test new lows.

四、HYPE Weekly Market Forecast & Short-term Trading Strategy: (07.20~07.26)

1、HYPE Weekly Market Forecast:

1 Core Resistance Levels:

  • First Resistance: $62~$63.5 area
  • Second Resistance: $68~$69.5 area
  • Third Resistance: Around $72.97

2 Core Support Levels:

  • First Support: Around $58.16
  • Second Support Zone: $52~$55 area

Core HYPE View for the Week: Monitor the test results when the price rebounds to the $62~$63.5 zone.

2、HYPE Weekly Short-term Trading Strategy:

If the price shows clear adjustment signals upon rebounding to near $62~$63.5 or higher resistance areas, investors may consider entering light short positions. Strict stop-loss discipline is required, with position size controlled within 30%.

五、Bitcoin Short-term Trade Review

We strictly followed the operation plan and the trading signals issued by our proprietary "Spread Trading Model" and "Momentum Quantitative Model," completing one short-term (long) trade last week, achieving a total trading profit of approximately 3.45%.

1、Short-term Trade Record: (See Table 1)

Bitcoin Short-term Trade Details Summary: (Leverage ×1)
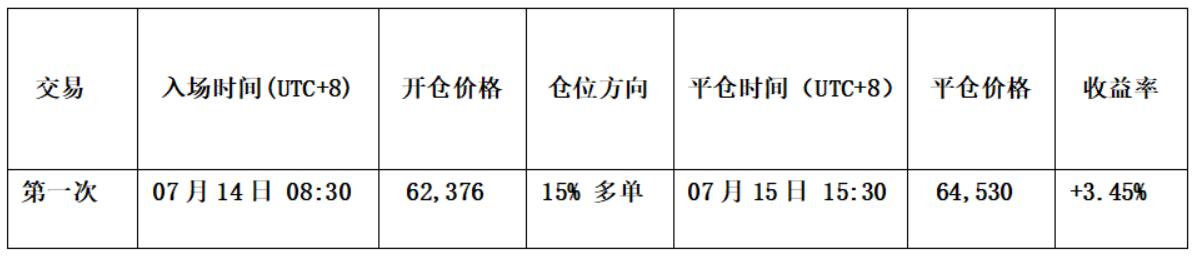
Table 1

2、Short-term Trade Review: (See Figure 5)

Entry Strategy:

a. When the price adjusted above $61,000, signs of stabilization appeared, and the candlesticks formed a "bottom reversal" pattern.

b. The "Momentum Quantitative Model" formed a bullish divergence signal.

c. After the "Spread Trading Model" triggered a strong bottom warning signal (white dot + red dot), the signal band (orange-yellow) in the chart broke above the horizon line (purple-red), issuing a bottoming rebound signal.

Therefore, we established a 15% long position at $62,376.

Exit Strategy:

a. When the price showed signs of exhaustion upon rebounding near $65,700, forming a "top reversal" candlestick pattern.

b. After the "Spread Trading Model" continuously triggered top warning signals (white dot + green dot), the signal band (blue) in the chart broke below the skyline (green), forming a top resonance signal with the "Momentum Quantitative Model."

Therefore, we closed the entire position around $64,530.

Summary: This trade successfully yielded a profit of approximately 3.45%.

3、Short-term Trade Schematic
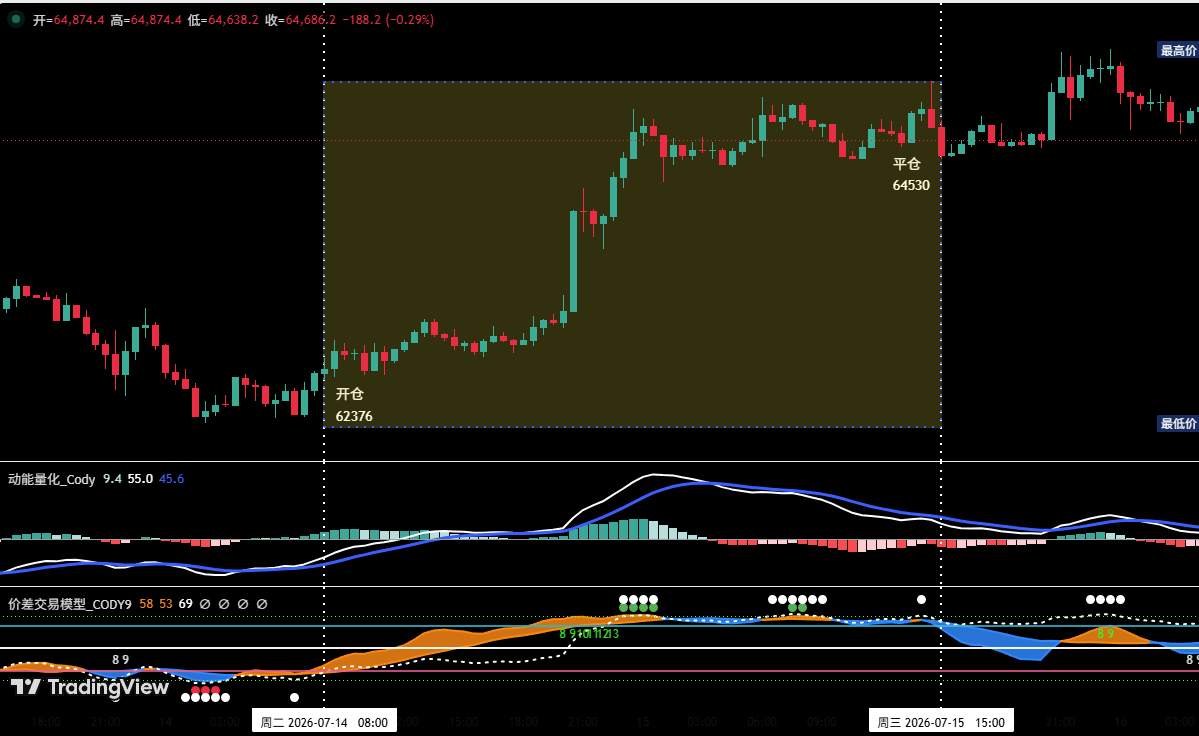
Figure 5 BTC 30-Minute Candlestick Chart: (Momentum Quantitative Model + Spread Trading Model)

六、Special Instructions:

  1. Upon Entry: Immediately set an initial stop-loss.
  2. When Profit Reaches 1%: Move the stop-loss to the entry price (breakeven point) to ensure capital safety.
  3. When Profit Reaches 2%: Move the stop-loss to the 1% profit level.
  4. Continuous Tracking: Thereafter, for every additional 1% profit, move the stop-loss up by 1% accordingly, dynamically protecting and locking in profits.

Financial markets are ever-changing. All market analysis and trading strategies require dynamic adjustment. All views, analytical models, and operational strategies mentioned in this article are derived from personal technical analysis and are solely for personal trading log purposes. They do not constitute any investment advice or basis for operation. The market carries risks; invest with caution. Do not make decisions based solely on this content.


Criptomoedas em alta

Perguntas relacionadas

QAccording to the technical analysis, what is the key resistance zone for Bitcoin (BTC) this week, and what are the two potential market outcomes based on a test of this zone?

AThe key resistance zone for Bitcoin this week is $65,700–$67,300. If the price faces resistance and falls back in this area, a daily-level adjustment may resume. Conversely, if it breaks through this resistance effectively, the short-term structure will shift to a stronger bullish logic.

QWhat is the core trading strategy for HYPE this week as outlined in the article?

AThe core strategy for HYPE is to monitor the test result when the price rebounds to the $62–$63.5 area. If the price shows a clear reversal signal near this resistance zone (or a higher one), investors can consider opening a light short position with strict stop-loss discipline, keeping the position size within 30%.

QDescribe the two specific operational plans (Plan A and Plan B) prepared for Bitcoin's short-term trading.

APlan A (Tentative Short at Strong Resistance): If BTC price meets resistance in the $65,700–$67,300 zone and shows topping signals from the quantitative model, open a short position of about 30% with an initial stop-loss. Close the position for profit near important support levels combined with model signals. Plan B (Light Long at Strong Support): If the price falls back after testing the $65,700–$67,300 resistance and shows signs of stabilization above the previous low of $57,820, combined with quantitative model bottom signals, open a long position of about 30% with an initial stop-loss. Close the position for profit near important resistance levels combined with model signals.

QWhat was the profit percentage and main rationale for the Bitcoin short-term long trade conducted last week, as detailed in the trade review?

ALast week's Bitcoin short-term long trade achieved a profit of approximately 3.45%. The main rationale for opening the long position at $62,376 was: price stabilization above $61,000 forming a 'bottoming' candlestick pattern, a kinetic energy bottom divergence signal from the 'Dynamic Quantitative Model', and a strong bottom warning signal (white + red dots) from the 'Spread Trading Model' where the signal band broke above the baseline, indicating a potential rebound.

QWhat is the overall medium-term market structure view for Bitcoin based on the 'Position Monitoring Model' shown in Figure 3?

AAccording to the Position Monitoring Model (Figure 3), Bitcoin's price has effectively broken below the 'Bull-Bear Channel', confirming that the market structure has shifted to a bear-dominated pattern. Therefore, the medium-term view maintains a bearish-dominant mindset. A medium-term short position of about 20% is currently held, with consideration to increase it to within 50% if the price rebounds to the $65,700–$67,300 zone and shows signs of stagnation combined with proprietary quantitative model top signals.

Leituras Relacionadas

human.tech Launches Clean SDK for Privacy-First Web3 Apps

human.tech has launched the Clean SDK, a toolkit enabling developers to build privacy-first Web3 applications with transparent accountability. Released alongside Aztec's version 5, the SDK provides components for integrating zero-knowledge identity verification, sanctions screening, and private transactions, without developers handling sensitive user data or building compliance infrastructure from scratch. It uses zero-knowledge proofs and programmable verification to allow apps to confirm user legitimacy and sanctions compliance while keeping identities confidential. The first application built on the SDK, Shield, a privacy bridge to Aztec, also launched. It allows users to transfer assets privately while proving a unique human is behind each transfer and that funds have passed sanctions checks, as verified by a May 2026 audit. The SDK offers three core verification techniques: Proof of Innocence (sanctions screening against 23 sources), Proof of Personhood (simpler verification via Human Passport), and Proof of Clean Hands (higher-assurance zero-knowledge government ID checks). This allows apps to authenticate users and transactions without exposing personal data. Designed for Aztec builders, the SDK lets developers add programmable privacy to decentralized apps, eliminating the need to create their own verification and ZK infrastructure. Shield demonstrates its practical use for private bridges, but the SDK aims to enable a wider ecosystem of private, accountable financial apps and services. The launch addresses growing demand for infrastructure that balances privacy and accountability. The SDK avoids traditional identity databases, storing encrypted data off-chain, screening at both entry and exit points, and including a gated disclosure mechanism for legal requests. human.tech's products, including the Clean SDK, focus on using zero-knowledge technology to enable verifiable personhood and privacy in digital systems.

TheNewsCryptoHá 28m

human.tech Launches Clean SDK for Privacy-First Web3 Apps

TheNewsCryptoHá 28m

Unlocking $100 Million in Liquidity? Pump.fun's New Policy Tests the 5-Minute Pump Technique

Pump.fun, a popular meme coin launchpad, has introduced a new standard mechanism called BOOST. It aims to address a significant capital efficiency issue: when a newly launched token graduates from its initial bonding curve to a liquidity pool (LP), roughly 20% of its liquidity becomes permanently locked as "dead liquidity," estimated to waste over $100 million annually. Instead of locking these funds permanently, BOOST repurposes them. Upon a token's migration, approximately 20% of the settlement funds (e.g., 17.6 SOL or ~$2516 USDC) are used to buy back the token on the open market over a 5-minute period via a Time-Weighted Average Price (TWAP) mechanism. All purchased tokens are immediately burned. This creates a brief, systematic buy pressure immediately after migration, potentially generating a short-term price surge ("pump") while permanently reducing the token's circulating supply. The goal is to enhance the immediate post-launch trading experience, potentially increasing trader retention and sustainable protocol revenue, which funds ongoing token buybacks. However, concerns exist that this artificial 5-minute boost could lower the barrier for launching low-quality tokens and lead to steeper price crashes once the buy pressure stops, if followed by large sell-offs. The feature automatically applies to tokens migrating after July 21, 2024, but not to previously migrated tokens or those launched via the Mayhem AI Agent lab.

marsbitHá 35m

Unlocking $100 Million in Liquidity? Pump.fun's New Policy Tests the 5-Minute Pump Technique

marsbitHá 35m

Podcast Notes | Conversation with GSR Asset Management Head: To Determine if This Crypto Rally is Real, Just Watch the Lending Rates on Aave

Podcast Summary: Dialogue with GSR's Head of Asset Management: To Determine if This Crypto Rally is Real, Just Check Lending Rates on Aave Andy Baehr, Managing Director of Asset Management at GSR, discusses the current crypto market, characterizing it as stuck in a state of "ambivalence" with short-lived, unsustainable rallies. He outlines a simple framework: the market moves between "ambivalence" and "conviction" (sustained upward momentum). Currently, every rally resembles a single-stage rocket booster that quickly fizzles out. Baehr identifies three key signals to watch: 1) DeFi lending rates, 2) the potential passage of the CLARITY Act, and 3) the market forming a consensus on the "Fed hawkish peak." He emphasizes that the most immediate indicator for the sustainability of the recent CPI-triggered rally is the USDC borrowing rate on Aave, currently around 3.75%—close to U.S. Treasury yields. The absence of a credit spread indicates low leverage demand and a lack of market energy. He explains that a healthy, sustained rally requires layered buying pressure. Last year's rally progressed from an ETH short squeeze to crypto-native trader influx and finally to ETF inflows. Currently, this structure is missing. Other potential structural buyers like Digital Asset Treasury (DAT) companies are absent, and ETF flows have proven transient. Baehr notes that while small-cap crypto tokens outperformed large caps in Q2—a potential sign of capitation in major assets—capital is also flowing to more exciting opportunities like AI stocks and tech IPOs, leaving crypto sidelined. Regarding DeFi, he highlights that platforms like Aave provide a clear, real-time signal of leverage demand through their supply/demand-driven interest rates. A significant, sustained rate increase would signal genuine market conviction. He also observes the quiet emergence of fixed-income-like products and vaults in DeFi. On regulation, the probability of the CLARITY Act passing before the August 7th deadline has dropped linearly from 75% to below 40% on Polymarket. Baehr suggests its passage would be treated as a bullish surprise, a potent driver for price movement. However, political hurdles, including ethical clause debates and disclosures about the First Family's crypto profits, remain significant obstacles. Ultimately, the market awaits clarity on the Fed's terminal rate under Chair Warsh. Until the "Fed Solstice"—the point where the market collectively understands the peak of hawkish policy—sustained conviction will be difficult to achieve.

marsbitHá 1h

Podcast Notes | Conversation with GSR Asset Management Head: To Determine if This Crypto Rally is Real, Just Watch the Lending Rates on Aave

marsbitHá 1h

Trading

Spot

Artigos em Destaque

Como comprar HYPE

Bem-vindo à HTX.com!Tornámos a compra de Hyperliquid (HYPE) simples e conveniente.Segue o nosso guia passo a passo para iniciar a tua jornada no mundo das criptos.Passo 1: cria a tua conta HTXUtiliza o teu e-mail ou número de telefone para te inscreveres numa conta gratuita na HTX.Desfruta de um processo de inscrição sem complicações e desbloqueia todas as funcionalidades.Obter a minha contaPasso 2: vai para Comprar Cripto e escolhe o teu método de pagamentoCartão de crédito/débito: usa o teu visa ou mastercard para comprar Hyperliquid (HYPE) instantaneamente.Saldo: usa os fundos da tua conta HTX para transacionar sem problemas.Terceiros: adicionamos métodos de pagamento populares, como Google Pay e Apple Pay, para aumentar a conveniência.P2P: transaciona diretamente com outros utilizadores na HTX.Mercado de balcão (OTC): oferecemos serviços personalizados e taxas de câmbio competitivas para os traders.Passo 3: armazena teu Hyperliquid (HYPE)Depois de comprar o teu Hyperliquid (HYPE), armazena-o na tua conta HTX.Alternativamente, podes enviá-lo para outro lugar através de transferência blockchain ou usá-lo para transacionar outras criptomoedas.Passo 4: transaciona Hyperliquid (HYPE)Transaciona facilmente Hyperliquid (HYPE) no mercado à vista da HTX.Acede simplesmente à tua conta, seleciona o teu par de trading, executa as tuas transações e monitoriza em tempo real.Oferecemos uma experiência de fácil utilização tanto para principiantes como para traders experientes.

332 Visualizações TotaisPublicado em {updateTime}Atualizado em 2026.06.02

Como comprar HYPE

Discussões

Bem-vindo à Comunidade HTX. Aqui, pode manter-se informado sobre os mais recentes desenvolvimentos da plataforma e obter acesso a análises profissionais de mercado. As opiniões dos utilizadores sobre o preço de HYPE (HYPE) são apresentadas abaixo.

活动图片