End of Correction or Continuation of Trend: Technical Structure Review of BTC and HYPE | Guest Analysis

Odaily星球日报Publicado em 2026-07-06Última atualização em 2026-07-06

Resumo

**Weekly Technical Analysis: BTC & HYPE Structure Review** This analysis covers the multi-timeframe technical structure for Bitcoin (BTC) and HYPE. **Bitcoin (BTC) Analysis:** BTC's correction from its May 6 high has formed a clear four-segment pattern on the daily chart. The market is currently in a (3-4) rebound phase. The key determinant for the short-term trend is the endpoint of this rebound ("Endpoint 4"): * **Path 1 (Preferred Scenario):** If the rebound surpasses the $65,700 resistance, subsequent pullbacks are less likely to break the key support at $57,820 (July 1 low). This would suggest a transition into a consolidating range, building energy for a potential bullish reversal. * **Path 2:** Failure to reach $65,700, or even $64,500, increases the probability of a breakdown below $57,820, continuing the downtrend. The 4-hour chart shows a completed five-wave decline from June 15, culminating in a momentum divergence at the low, which supported the recent bounce. **BTC Weekly Outlook & Strategy (Jul 6-12):** * **Core View:** Focus on the high point of the daily rebound from $57,820. * **Key Levels:** * Resistance: $64,500-$65,700; $67,300; $69,500-$71,000. * Support: $60,950-$62,300; $57,820; $55,000. * **Strategy:** * **Mid-term:** Maintain ~20% short position. Consider increasing shorts to <50% if price stalls in the $65,700-$67,300 zone with confirming model signals. * **Short-term:** Use 30% capital for swing trades between su...

This weekly report conducts a multi-period technical structure analysis focusing on BTC and HYPE. For Bitcoin, the analysis begins with the daily and 4-hour charts, examining the correction structure since the May 6th peak. Combined with a proprietary quantitative model, it offers predictions for key resistance and support levels this week, along with medium- and short-term trading paths. The HYPE section concentrates on the 4-hour chart trend, analyzing the structural evolution of the current rebound and providing corresponding risk control suggestions for this week's short-term operations. Details are as follows.

Last Week's Strategy Verification

  • BTC Market Prediction Verification: Last week's article explicitly stated that Bitcoin's short-term correction was nearing its end. The actual market movement largely aligned with the predicted path, validating the forward-looking judgment.
  • HYPE Market Prediction Verification: Last week's article pointed out that a short-term entry opportunity for long positions in HYPE was about to emerge. Current market movements have confirmed this judgment.

I. Multi-Period Trend Structure Analysis of Bitcoin

1. Daily Chart Trend Structure Analysis

Bitcoin Daily Candlestick Chart
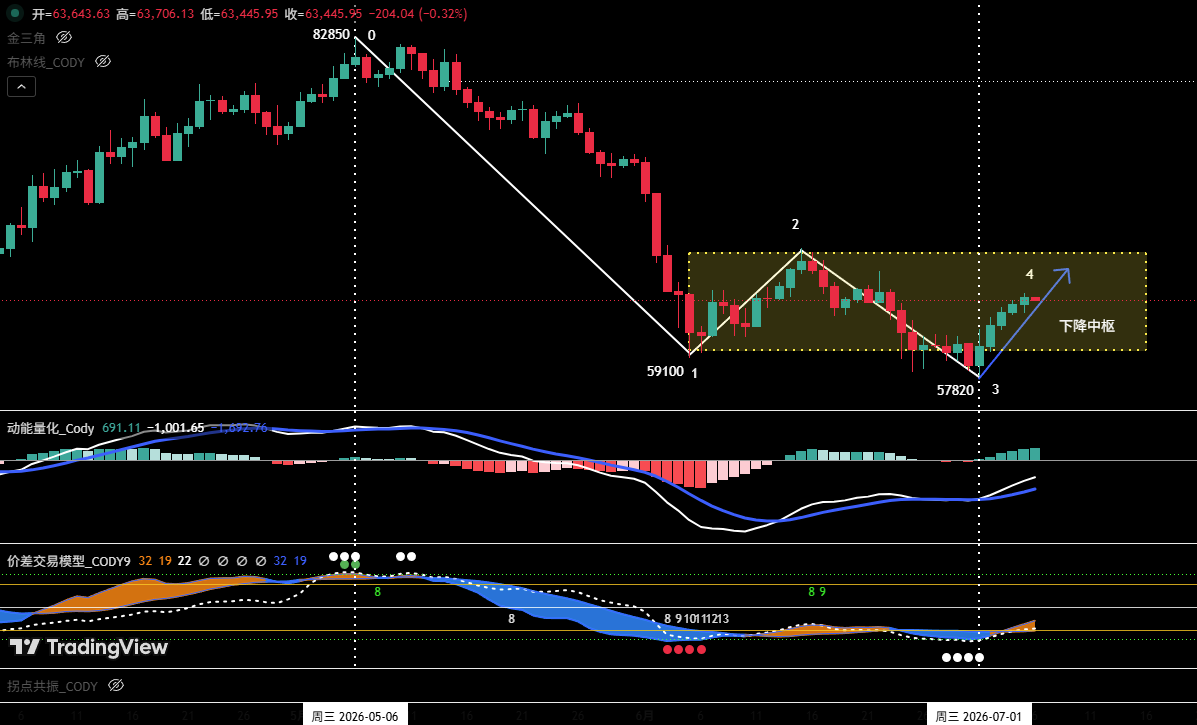
Figure 1

1. As shown in Figure 1: The correction that began from the May 6th high of $82,850 has clearly formed a four-stage correction structure on the daily chart, from "Point 0" to "Point 4".

2. The market is currently in the (3-4) rebound phase. The final position of "Point 4" will determine the short-term price direction.

  • Path One: If the rebound price at "Point 4" can break through the resistance at $65,700, the probability of a subsequent pullback directly breaking below the support at the July 1st low of $57,820 will be significantly reduced. In this scenario, the market is expected to rebound again after the correction ends, with the recent overall trend likely entering a range-bound consolidation pattern. The longer this consolidation structure persists, the more it helps to slow downward momentum and accumulate strength for a subsequent bullish counterattack.
  • Path Two: If the rebound price at "Point 4" fails to reach $65,700, or even falls below $64,500, the probability of a subsequent pullback directly breaking below $57,820 increases substantially, making it more likely for the market to continue its downward trend.

3. Analysis based on the proprietary quantitative model indicates a high probability of the market entering range-bound consolidation (i.e., Path One).

2. Hourly Chart Trend Structure Deep Dive (Using 4-hour as Analysis Period)

Bitcoin 4-hour Candlestick Chart
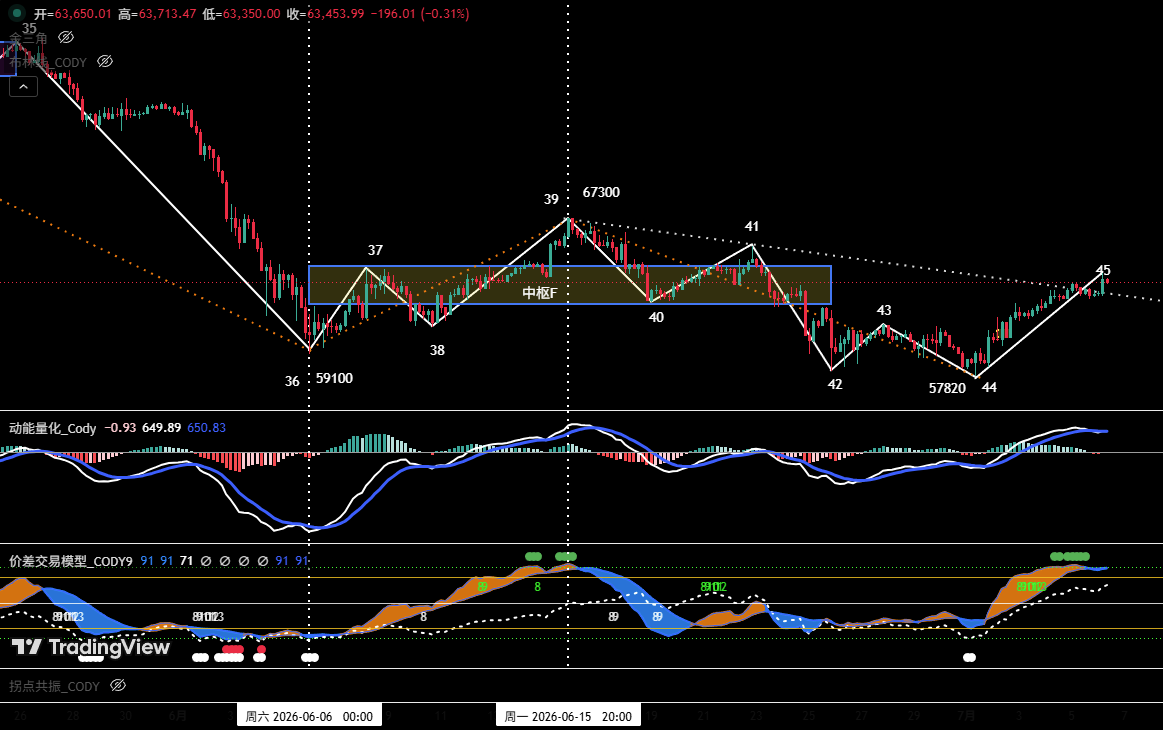
Figure 2

1. Last week's review pointed out: "If the end of Point 44 is below $58,110 accompanied by the formation of a momentum bottom divergence, the market will present a rebound opportunity." Last week's price action validated this judgment, with the actual movement highly consistent with the predicted structure.

2. On the 4-hour chart, the hourly-level decline wave that started from the June 15th high of $67,300 has completed a full five-wave structure; simultaneously, at the end of the correction, a clear momentum bottom divergence formed between low points "Point 44" and "Point 42," providing technical support for the subsequent oversold rebound.

3. The market is currently in the (44-45) rebound phase. From Figure 2, the current rebound high "Point 45" has broken above the lower boundary of the previous "Falling Channel F" (around $62,300), indicating short-term momentum is shifting in favor of bulls. If the price can further break through "Point 41" (around $65,700), it would signal an upgrade in rebound strength, significantly reducing the probability of a subsequent pullback directly breaking below "Point 44" (around $57,820).

II. Bitcoin Weekly Market Forecast and Trading Strategy (07.06~07.12)

1. BTC Weekly Market Trend Forecast

Core View: Focus on the high point of the daily oversold rebound starting from the low of $57,820.

2. Core Resistance Levels:

• First Resistance Zone: $64,500~$65,700 area (previous significant high/low points)

• Second Resistance Zone: Around $67,300 (previous significant resistance area)

• Third Resistance Zone: $69,500~$71,000 area (previous significant resistance area)

3. Core Support Levels:

• First Support Level: $60,950~$62,300 area (previous significant support)

• Second Support Level: Around $57,820 (previous significant support)

• Third Support Level: Around $55,000 (previous significant support)

4. Weekly Trading Strategy

1 Medium-Term Strategy:

Bitcoin Daily Candlestick Chart (Position Monitoring Model)
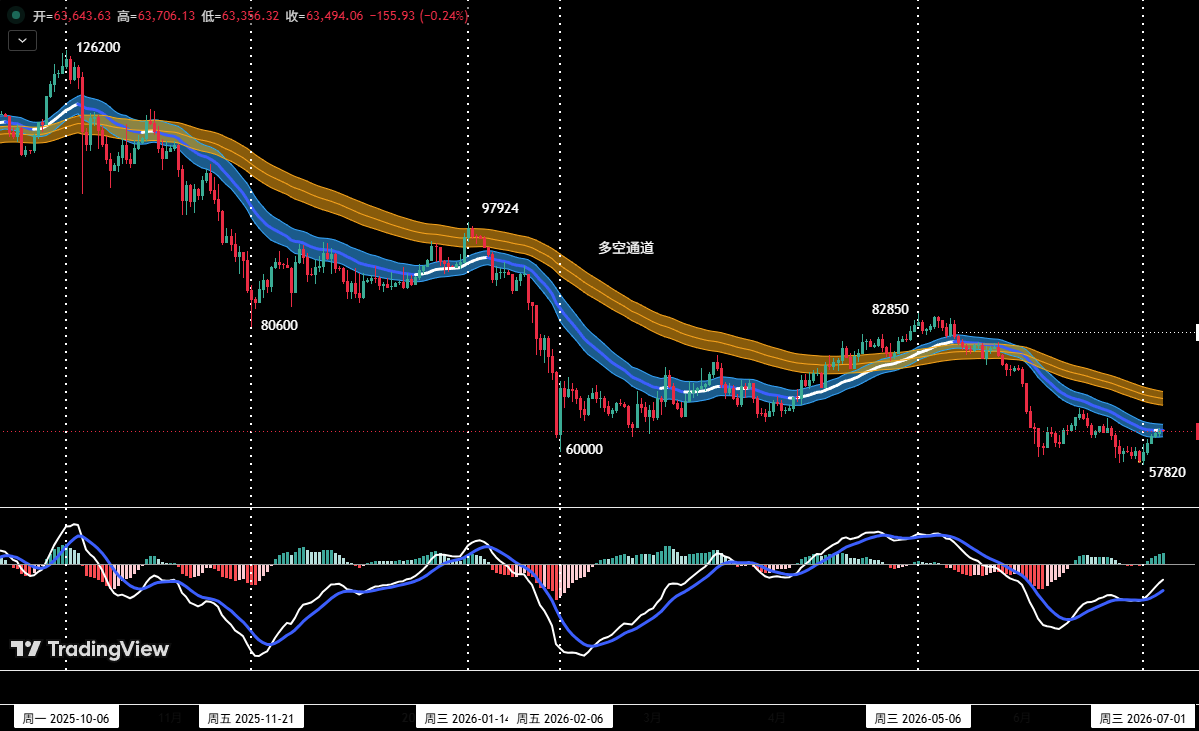
Figure 3

As shown in Figure 3, the price has effectively broken below the "Bull-Bear Channel," confirming a shift to a bear-dominated market structure.

  • Current medium-term short positions can be maintained at around 20%.
  • If the price rebounds to the $65,700~$67,300 zone and shows signs of stagnation, combined with top signals from the proprietary quantitative model, consider increasing medium-term short positions to within 50%.

2 Short-Term Strategy

Utilize 30% of capital, set stop-losses, and seek "price difference" opportunities based on support and resistance levels (using 30-minute/60-minute charts as operational cycles).

3 Short-Term Operation Contingency Plans

To dynamically respond to the market's complex evolution, two specific operational plans, A and B, are drafted in advance:

  • Plan A: Testing Short Positions in Strong Resistance Zone
  • Entry: If the price rebounds to the $65,700~$67,300 zone and meets resistance, combined with quantitative model top signals, establish short positions of around 30%.
  • Risk Control: Set initial stop-loss.
  • Exit: Gradually close positions to take profits when the price adjusts near important support levels, combined with model signals.
  • Plan B: Light Long Positions in Strong Support Zone
  • Entry: If the price breaks above the $65,700 zone, meets resistance, pulls back, and stabilizes near the strong support of $57,820, showing signs of bottoming, combined with quantitative model bottom signals, establish long positions of around 15%.
  • Risk Control: Set initial stop-loss.
  • Exit: Gradually close positions to take profits when the price rebounds near important resistance levels, combined with model signals.

III. HYPE Hourly Chart Trend Structure Analysis

HYPE 4-hour Candlestick Chart
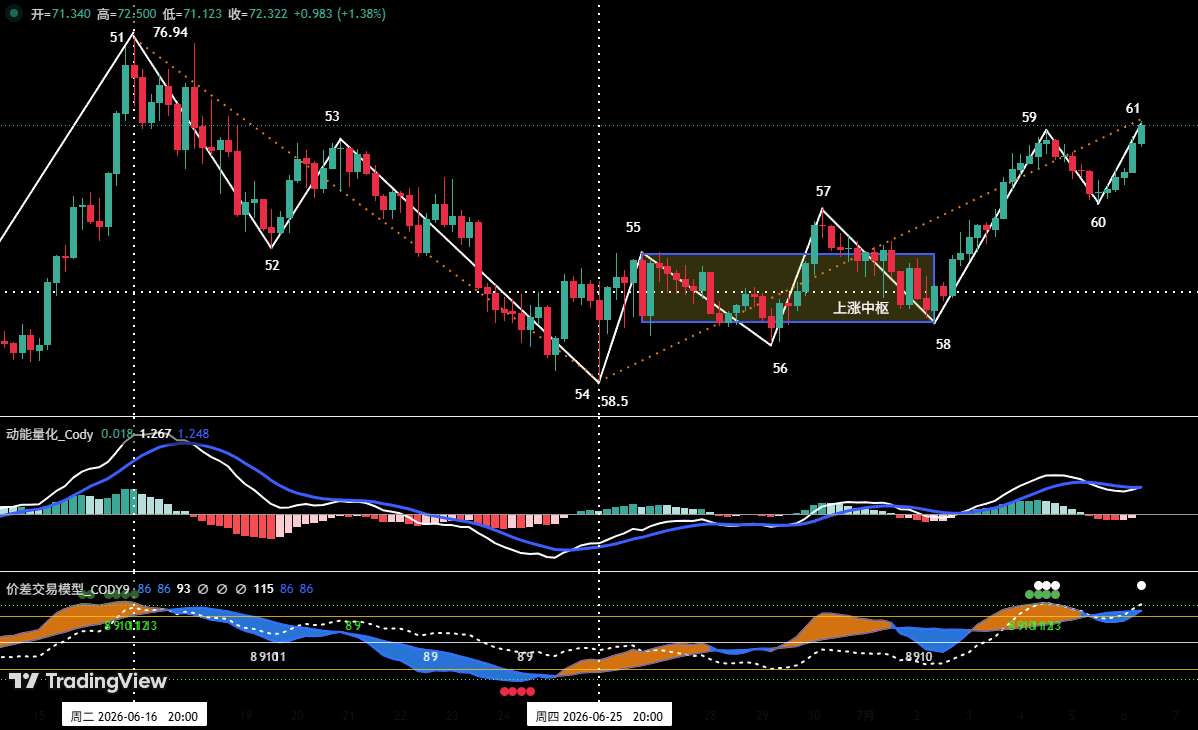
Figure 4

  1. As shown in Figure 4, last week's review stated: "If 'Point 56' is higher than 'Point 54', it forms a 'Double Bottom' pattern, potentially ending this correction, with a high probability of a rebound starting from 'Point 56'." To date, the market movement closely aligns with the analysis. In last week's actual movement, HYPE price rose from "Point 56" (around $60.55) to "Point 59" (around $72.06), with a maximum gain of approximately 19.01%.
  2. Analyzing the 4-hour chart, the rebound in HYPE starting from the June 25th low of $58.5 (Point 54) can be subdivided into a seven-wave upward structure on the 4-hour cycle: 54-55, 55-56, 56-57, 57-58, 58-59, 59-60, 60-61.
  3. The price is currently in the 60-61 upward phase, with the overall upward structure complete. However, the proprietary "Price Difference Trading Model" detected top warning signals at "Point 59" and "Point 61," and the price is approaching the historical high area near $76.94. Therefore, blind chasing of rallies is not advisable at this moment; remain vigilant against short-term correction risks.

IV. HYPE Weekly Market Forecast and Short-Term Trading Strategy

1. HYPE Weekly Market Trend Forecast

Core Resistance Levels

  • First Resistance: Around $75~$76.94
  • Second Resistance: Around $80

Core Support Levels

  • First Support: Around $68
  • Second Support: Around $65.5
  • Third Support: $60.5~$61.5 area

Core View for the Week: When the price rises to the $75~$76.94 area, observe the battle outcome between bulls and bears over this zone.

2. HYPE Weekly Short-Term Trading Strategy

This week's focus is on closing positions to lock in profits and prevent risks. If long positions were established in the support zone according to the plan, it is recommended to move the stop-loss up to around $68 to protect profits (or decide independently). If the market shows signs of adjustment, close positions promptly to take profits.

V. HYPE Short-Term Operation Review

We strictly followed the operation plan and, based on trading signals from our proprietary "Price Difference Trading Model" and "Momentum Quantitative Model," completed one short-term (long) trade last week, achieving a total trading profit of approximately: 10.23%.

Short-Term Trade 1: (See Table 1)

1. HYPE Short-Term Trade Details Summary:(Leverage*1x)
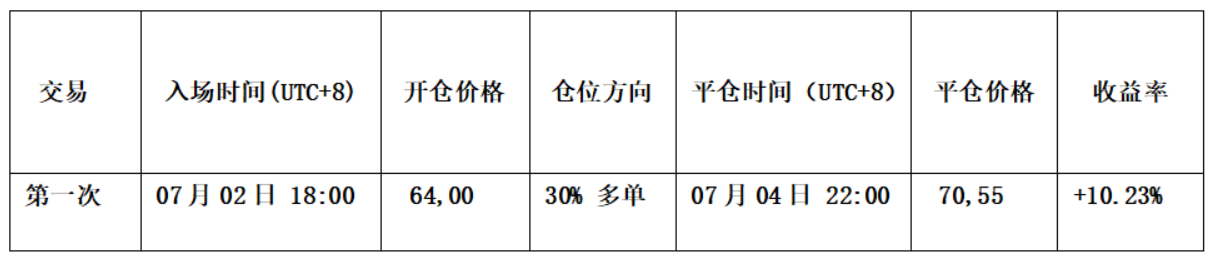
Table 1

2. Short-Term Trade Review:(See Figure 5)

• Entry Strategy:

a. Based on an accurate judgment of the overall upward price trend.

b. When the price effectively broke through the short-term downtrend line, and both the "Price Difference Trading Model" and "Momentum Quantitative Model" simultaneously issued bottom divergence resonance signals.

Therefore, we established a 30% long position at $64.

• Exit Strategy:

a. When the price rose near the $72 resistance and showed signs of stagnation, with the candlesticks forming a "Top Reversal" pattern.

b. The "Price Difference Trading Model" triggered a strong top warning signal (green dot + white dot), forming a top resonance signal with the "Momentum Quantitative Model".

Therefore, we closed all positions around $70.55.

• Summary: This trade successfully yielded a profit of approximately 10.23%.

HYPE_60-minute Candlestick Chart:(Momentum Quantitative Model + Price Difference Trading Model)
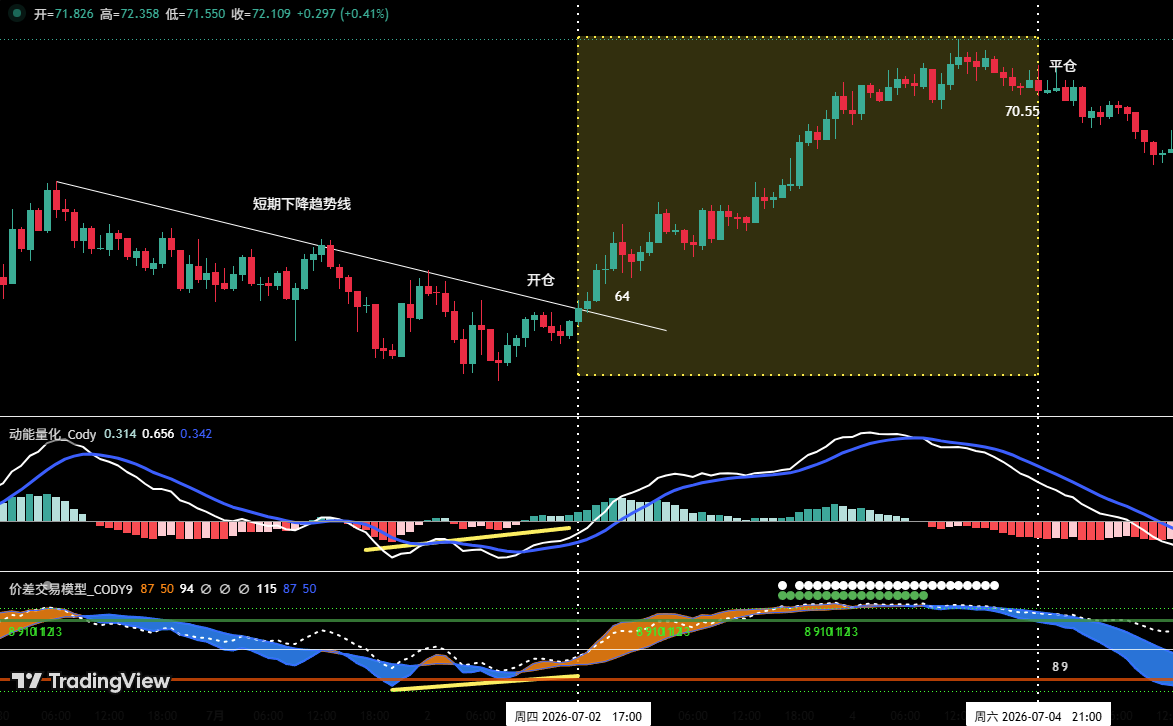
Figure 5 (Short-Term Trade Illustration)

VI. Special Notes

  1. When opening a position: Immediately set an initial stop-loss.
  2. When profit reaches 1%: Move the stop-loss to the entry price (break-even point) to ensure capital safety.
  3. When profit reaches 2%: Move the stop-loss to the 1% profit level.
  4. Continuous tracking: Thereafter, for every additional 1% profit the price makes, move the stop-loss up by 1% accordingly, dynamically protecting and locking in profits.

Financial markets change rapidly, and all market analysis and trading strategies require dynamic adjustment. All views, analytical models, and operational strategies mentioned in this article are derived from personal technical analysis, intended solely for personal trading log purposes. They do not constitute any investment advice or basis for operation. The market involves risks, investing requires caution. Please do not make decisions based solely on this content.


Criptomoedas em alta

Perguntas relacionadas

QWhat are the two key technical analysis paths for Bitcoin's current rebound based on the 'Endpoint 4' price position mentioned in the article?

APath One: If the rebound at 'Endpoint 4' can break above the $65,700 resistance, a subsequent pullback is less likely to directly breach the July 1st low of $57,820. The market is then expected to move into a range-bound consolidation, which would help dissipate selling pressure and build momentum for a future upward move. Path Two: If the rebound at 'Endpoint 4' fails to reach $65,700 or even stays below $64,500, a subsequent pullback has a high probability of directly breaking below the $57,820 support, indicating a continuation of the prior downtrend. According to the author's proprietary quantitative model, the probability of Path One (range-bound consolidation) is significantly higher.

QAccording to the 4-hour chart analysis for Bitcoin, what specific condition did the author previously predict that would signal a rebound opportunity, and how did the market action last week validate it?

AThe author predicted that if 'Endpoint 44' finished below $58,110 and was accompanied by the formation of a momentum bottom divergence, the market would present a rebound opportunity. Last week's market action validated this prediction, as the actual price movement aligned closely with the forecasted structure. The low at 'Endpoint 44' (around $57,820) did fall below the specified level, and a momentum divergence was confirmed, leading to the current oversold rebound.

QWhat is the core trading strategy for HYPE this week (the week of the article's publication) according to the author's analysis?

AThe core trading strategy for HYPE this week is to prioritize locking in profits and managing risk. If long positions were already established in support zones as per previous plans, it is advised to move the stop-loss up to around $68 to protect profits (or adjust based on individual judgment). If the market shows signs of a pullback, positions should be closed promptly to realize gains. The article emphasizes caution against blindly chasing the rally near the historical high region of $76.94.

QDescribe the specific conditions (entry and exit signals) for the HYPE short-term long trade that resulted in a 10.23% profit, as detailed in the trade复盘 (review).

AEntry Conditions: 1. Based on an accurate研判 of the overall uptrend. 2. Price effectively broke through a short-term descending trendline. 3. The proprietary 'Price Difference Trading Model' and 'Momentum Quantitative Model' simultaneously issued bottom divergence共振 signals. Based on these conditions, a 30% long position was established at $64. Exit Conditions: 1. Price rose near the $72 resistance level and showed signs of stagnation, with the K线 forming a 'top分型' pattern. 2. The 'Price Difference Trading Model' triggered a strong top预警 signal (Green dot + White dot), which formed a top共振 signal with the 'Momentum Quantitative Model'. Based on these conditions, the entire position was closed around $70.55, resulting in a profit of approximately 10.23%.

QWhat is the author's recommended dynamic stop-loss management rule once a trade becomes profitable, as outlined in the '特别提示' (Special Notes) section?

AThe author's recommended dynamic stop-loss management rules are: 1. Upon opening a position: Immediately set an initial stop-loss. 2. When profit reaches 1%: Move the stop-loss to the entry price (breakeven point) to ensure capital safety. 3. When profit reaches 2%: Move the stop-loss to the 1% profit level. 4. Continuous tracking: Thereafter, for every additional 1% gain in profit, move the stop-loss up by 1% accordingly, dynamically protecting and locking in profits.

Leituras Relacionadas

Reviewing 8 'Cash Cow' Projects in the Bear Market: The Leader Repurchased $283 Million Worth This Year

This article highlights eight cryptocurrency projects that have demonstrated strong cash-generating capabilities and implemented significant token buyback programs during the bear market of 2026. These projects, dubbed "cash cows," are repurchasing their own tokens, often reducing supply. According to data from Tokenomist, the projects with notable buyback activity from January 1st to June 30th are: Meteora (MET), Pump.fun (PUMP), GMX, Rollbit (RLB), Metaplex (MPLX), Hyperliquid (HYPE), Lighter (LIT), and Aave. Notably, MET's buybacks equaled 71% of its January token supply, while HYPE executed the largest buyback by value at $283 million. Key project summaries include: - **Hyperliquid (HYPE):** The leader by dollar value, its perpetual DEX protocol has repurchased and burned 44 million HYPE tokens (approx. 4.4% of supply) using a significant portion of trading fees, with total buybacks exceeding $1.1 billion since March 2025. - **Meteora (MET):** Its buyback of 336.2 million MET tokens had the greatest proportional impact on its circulating supply, equivalent to 71% of its supply at the start of the year. - **Pump.fun (PUMP):** The popular memecoin launchpad has cumulatively bought back over $400 million worth of PUMP since July 2025, using 50% of net revenue for buybacks and burns since April. - **Aave (AAVE):** Despite facing a major security incident earlier in the year, the lending protocol has continued its buyback program, repurchasing over 200,000 AAVE tokens. Its team is designing a new automated buyback mechanism. - **GMX, Lighter (LIT), Rollbit (RLB), and Metaplex (MPLX)** also have active buyback mechanisms funded by protocol fees or revenues. The article concludes that while token buybacks and burns do not guarantee price appreciation—as market conditions, news, and other factors play a role—these projects stand out for their ability to generate consistent cash flow in a challenging market environment.

marsbitHá 29m

Reviewing 8 'Cash Cow' Projects in the Bear Market: The Leader Repurchased $283 Million Worth This Year

marsbitHá 29m

Ethereum Sheds Its Load? What Ethereum Supporters Think About the Lean Ethereum Upgrade and the Future Market

Ethereum is back in focus with the announcement of the "Lean Ethereum" upgrade roadmap, described by Vitalik Buterin as Ethereum's third major update. This proposal aims to fundamentally redesign the consensus, data, and execution layers from first principles, striving to make Ethereum **simpler, more secure (quantum-resistant), more verifiable, and more scalable.** The announcement comes amidst a broader restructuring within the ecosystem, including a 20% staff reduction at the Ethereum Foundation and the emergence of new organizations like EthLabs. This has sparked a debate among Ethereum supporters ("E-bizens"). **Optimists** view Lean Ethereum as a critical refocusing on core protocol fundamentals: * **sassal.eth** calls it the ultimate bullish catalyst, envisioning a future where running a node is so lightweight it could be done on a smartwatch, greatly enhancing decentralization. * **Ryan Sean Adams** sees it as Ethereum moving from "narrative expansion" to "protocol hardening," addressing long-term foundational issues like security and scalability. * Analysts like **BITWU** and **蓝狐 (Blue Fox)** frame it as a third-phase evolution towards a "minimal, durable, and credible base layer" designed for the next decade. * **gigi发财猪** interprets the organizational changes as Ethereum "shedding old baggage and forming new teams" for a lighter, more agile approach. * **Xiyu** notes that the roadmap itself provides a much-needed new narrative for market sentiment recovery. **Cautious voices** acknowledge the vision but emphasize execution and market timing: * **Ignas** warns that while the roadmap addresses key community requests, it overlooks tokenomics, and competitors are gaining ground in areas like RWA. Timely delivery is crucial; delays could be bearish. * **Dankrad Feist**, a former Ethereum Foundation researcher, agrees on direction but criticizes the proposed 3-4 year timeline as too slow for the current market pace, especially with AI-aided development available. **In summary,** optimists believe Lean Ethereum reaffirms Ethereum's long-term value proposition as a decentralized world computer, while the cautious argue that its success hinges on faster delivery and tangible results to maintain market relevance. Despite ongoing criticism, the move signals Ethereum's effort to regroup and reclaim initiative at the protocol level.

marsbitHá 1h

Ethereum Sheds Its Load? What Ethereum Supporters Think About the Lean Ethereum Upgrade and the Future Market

marsbitHá 1h

AI Folding: Fable 5 and GPT-5.6 Are Becoming the Privilege of a Few

【AI Accessibility Gap Widens: Elite Tools Like Fable 5 and GPT-5.6 Are Becoming Privileged】 We are witnessing a growing "AI divide." A stark reality is emerging: a tiny fraction of elites, primarily in tech, are using powerful next-generation models like Fable 5 or the upcoming GPT-5.6, while the vast majority of the public only has access to "toys" - free, limited models equivalent to ChatGPT's basic versions (8B to 30B parameters). This creates a massive experiential chasm and cognitive dissonance. Industry outsiders see AI as overhyped and ineffective, unable to grasp its transformative potential, while insiders leverage these advanced models for a decisive competitive edge. The gap isn't just about model quality but product functionality. Free users get a simple chatbot. Paying elites get integrated workflow systems—capable of creating specialized agents, processing complex data, and handling real-world tasks like management, coding, and planning. Demos showcasing AI planning weddings or building apps feel disconnected from everyday needs like managing bills, groceries, or health. The cost barrier is immense, with reports of engineers spending $1000 daily on Fable 5 inference. Elite users employ sophisticated multi-model workflows, combining different AIs for ideation, architecture, execution, and review, completing complex projects in minutes instead of weeks. This divide extends to critical areas like healthcare, where free models are dangerously unreliable for medical queries. However, some argue that for 90% of common business tasks, mid-tier models like GPT-5.5 are sufficient; the perceived limitation often stems from poor integration and lack of context, not model intelligence. Ultimately, unequal access to cutting-edge AI is creating a new form of social stratification, where the most powerful tools are becoming the exclusive privilege of a few.

marsbitHá 1h

AI Folding: Fable 5 and GPT-5.6 Are Becoming the Privilege of a Few

marsbitHá 1h

Cathie Wood's June $77M Investment: Are Crypto Stocks a True 'Substitute' for Bitcoin?

In June, Cathie Wood's ARK Invest purchased $77 million worth of publicly traded crypto-related stocks, including Coinbase, Circle, and Bullish, during Bitcoin's worst monthly performance in four years. This aligns with the investment thesis that such stocks offer a compliant way to gain exposure to the crypto cycle without directly holding Bitcoin. However, data analysis reveals significant drawbacks. A group of nine U.S.-listed crypto companies showed 30-day annualized realized volatility between 68% and 90%, nearly double Bitcoin's 37.6%. Over 90 days, Circle's volatility reached 103.6% versus Bitcoin's 37.8%. Drawdowns were also more severe for stocks like Circle (-51.4%) and MicroStrategy (-48.6%) compared to Bitcoin's -36.4% from its January high. Correlation analysis shows most stocks share only a moderate link to Bitcoin. For example, Circle, Robinhood, and Bullish have a 90-day correlation coefficient of just 0.55–0.58 with BTC, meaning only about one-third of their price movement is explained by Bitcoin's action. The rest stems from company-specific risks: earnings, competition, fundraising, and equity dilution. MicroStrategy (MSTR) is the notable exception, acting as a leveraged Bitcoin proxy with a beta of 1.59 and 0.85 correlation. Coinbase offers relatively balanced exposure. Circle exemplifies "crypto-wrapped" corporate risk, with its recent crash tied to stablecoin competition, not Bitcoin. Robinhood's diversified business insulates it from crypto downturns but also limits upside. Bitcoin miners like RIOT and MARA have posted significant gains year-to-date, driven primarily by their pivot to AI compute services, not Bitcoin's price. The article highlights that investing in crypto stocks often means accepting amplified volatility or layering on business-specific risks absent from direct Bitcoin ownership. For instance, MicroStrategy's recent challenges—its market value falling below its Bitcoin holdings (mNAV <1) and facing potential Bitcoin sales for liquidity—demonstrate equity-specific hazards like dilution and financing pressures not faced by a direct Bitcoin holder. ARK's buying spree represents a bet on a basket of different business models with varying crypto exposure, not a simple, lower-risk substitute for holding Bitcoin.

marsbitHá 1h

Cathie Wood's June $77M Investment: Are Crypto Stocks a True 'Substitute' for Bitcoin?

marsbitHá 1h

Trading

Spot

Artigos em Destaque

Como comprar HYPE

Bem-vindo à HTX.com!Tornámos a compra de Hyperliquid (HYPE) simples e conveniente.Segue o nosso guia passo a passo para iniciar a tua jornada no mundo das criptos.Passo 1: cria a tua conta HTXUtiliza o teu e-mail ou número de telefone para te inscreveres numa conta gratuita na HTX.Desfruta de um processo de inscrição sem complicações e desbloqueia todas as funcionalidades.Obter a minha contaPasso 2: vai para Comprar Cripto e escolhe o teu método de pagamentoCartão de crédito/débito: usa o teu visa ou mastercard para comprar Hyperliquid (HYPE) instantaneamente.Saldo: usa os fundos da tua conta HTX para transacionar sem problemas.Terceiros: adicionamos métodos de pagamento populares, como Google Pay e Apple Pay, para aumentar a conveniência.P2P: transaciona diretamente com outros utilizadores na HTX.Mercado de balcão (OTC): oferecemos serviços personalizados e taxas de câmbio competitivas para os traders.Passo 3: armazena teu Hyperliquid (HYPE)Depois de comprar o teu Hyperliquid (HYPE), armazena-o na tua conta HTX.Alternativamente, podes enviá-lo para outro lugar através de transferência blockchain ou usá-lo para transacionar outras criptomoedas.Passo 4: transaciona Hyperliquid (HYPE)Transaciona facilmente Hyperliquid (HYPE) no mercado à vista da HTX.Acede simplesmente à tua conta, seleciona o teu par de trading, executa as tuas transações e monitoriza em tempo real.Oferecemos uma experiência de fácil utilização tanto para principiantes como para traders experientes.

313 Visualizações TotaisPublicado em {updateTime}Atualizado em 2026.06.02

Como comprar HYPE

Discussões

Bem-vindo à Comunidade HTX. Aqui, pode manter-se informado sobre os mais recentes desenvolvimentos da plataforma e obter acesso a análises profissionais de mercado. As opiniões dos utilizadores sobre o preço de HYPE (HYPE) são apresentadas abaixo.

活动图片