Predicción del precio de Stellar (XLM): He aquí por qué podría venir otro aumento del 14%

ambcryptoPublicado em 2026-03-26Última atualização em 2026-03-26

Resumo

El precio de Stellar (XLM) se disparó más del 9% en 24 horas, superando a activos principales como Bitcoin y Ethereum, con un volumen de trading que aumentó un 49% hasta los 217 millones de dólares. En el momento de la publicación, XLM cotizaba en $0.1802, rompiendo un nivel de resistencia clave mantenido desde febrero de 2026. Los analistas sugieren que si el precio cierra por encima de $0.18, podría experimentar una subida adicional del 14%, alcanzando los $0.21. Sin embargo, el RSI en 61.01 indica una posible aproximación a la zona de sobrecompra. Los datos de derivados muestran un interés abierto (OI) que aumentó un 35.97%, con posiciones largas dominantes, lo que refleja un sentimiento alcista entre los traders y grandes inversores.

Stellar (XLM) se disparó más de un 9% y se situó entre los mayores ganadores después de que el mercado de criptomonedas en general se recuperara en las últimas 24 horas. Este salto de precio no solo le ha ayudado a superar a activos importantes como Bitcoin (BTC), Ethereum (ETH) y Solana (SOL), sino que también ha abierto la puerta a un mayor potencial alcista para XLM.

Al momento de escribir, XLM se negociaba a $0.1802. No solo ha aumentado el precio, sino que también se ha visto una fuerte participación del mercado, como lo refleja el volumen de negociación de XLM. Este se disparó más de un 49%, hasta los 217 millones de dólares, en el mismo período.

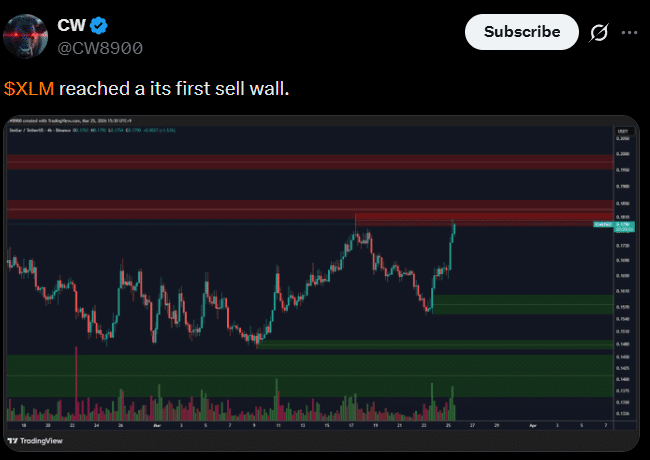
Este aumento en el volumen podría reforzar la última subida de XLM, ya que sugiere que los inversores y traders podrían estar interesados en la tendencia predominante. Es en este contexto que, recientemente, un popular experto en criptomonedas compartió una publicación en X afirmando: "XLM ha alcanzado su primer muro de ventas". Como era de esperar, esta publicación ha generado dudas sobre las ganancias recientes de la criptomoneda.

Fuente: X/CW8900

Acción del precio de XLM y niveles clave a observar

En el gráfico diario, XLM parecía estar alcista al romper el nivel de resistencia clave de $0.18, un nivel que se había mantenido firme desde el 1 de febrero de 2026. En el pasado, la criptomoneda ya había intentado superar este nivel. Sin embargo, no logró sostener el movimiento, lo que resultó en fuertes caídas generalizadas.

Fuente: TradingView

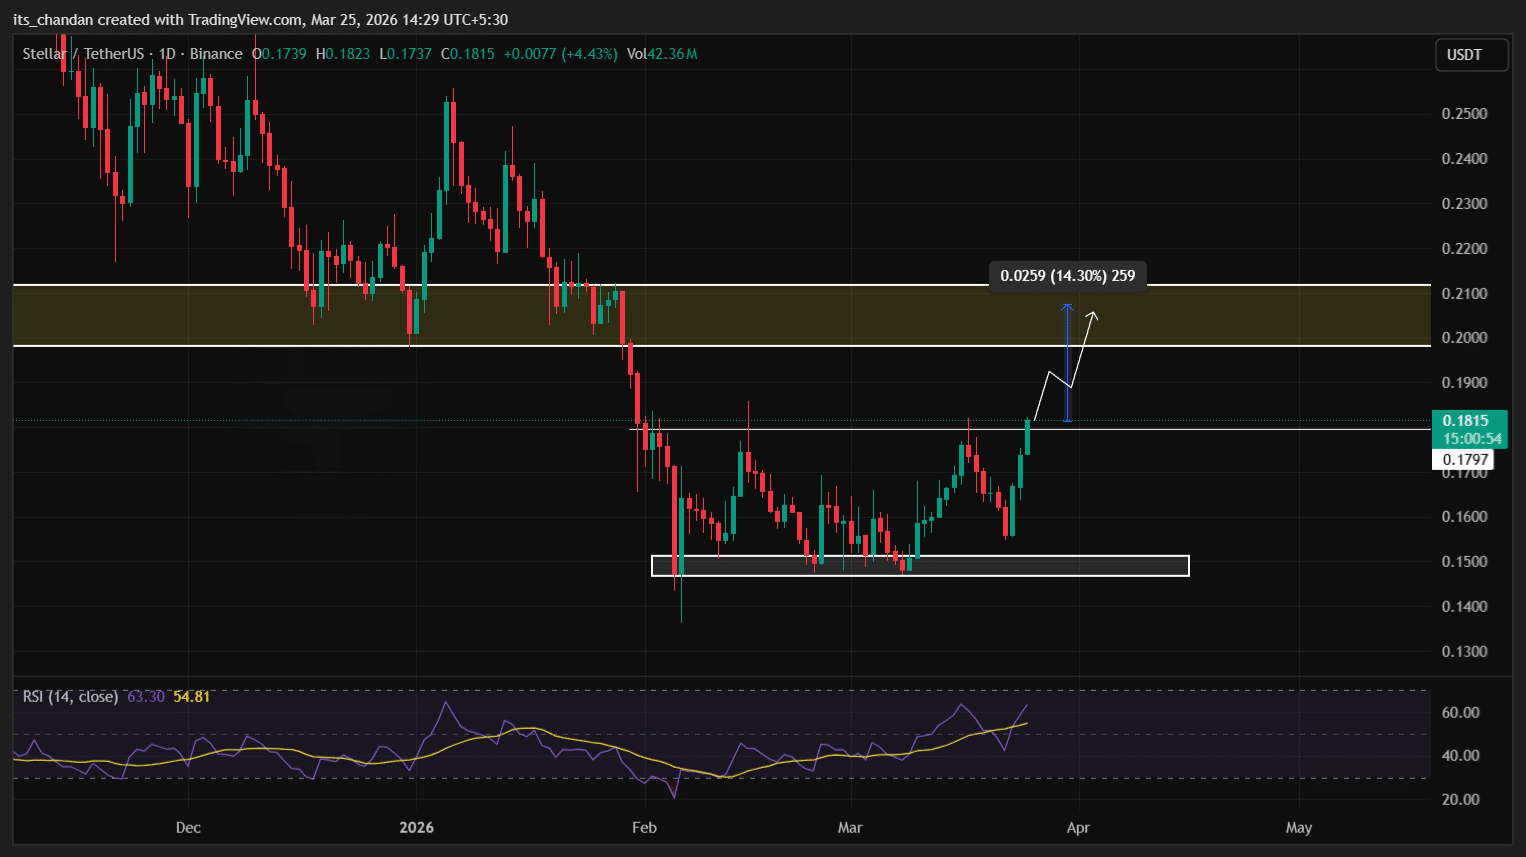
La acción del precio al momento de escribir sugería que la ruptura de XLM solo se puede confirmar si cierra una vela diaria por encima del nivel de $0.18. Si esto sucede, el activo podría experimentar un aumento de precio del 14% y alcanzar el nivel de $0.21 en los próximos días. Sin embargo, si no logra cerrar una vela diaria por encima de este nivel clave, la historia podría repetirse y podría ocurrir un movimiento a la baja.

Mientras tanto, el indicador técnico Índice de Fuerza Relativa (RSI) se situó en 61.01, lo que indica que XLM podría estar acercándose a la zona de sobrecompra.

¿Se están volviendo alcistas las herramientas derivadas?

Finalmente, a pesar de que el precio se encuentra en un nivel decisivo, los traders intradía parecían estar realizando apuestas alcistas.

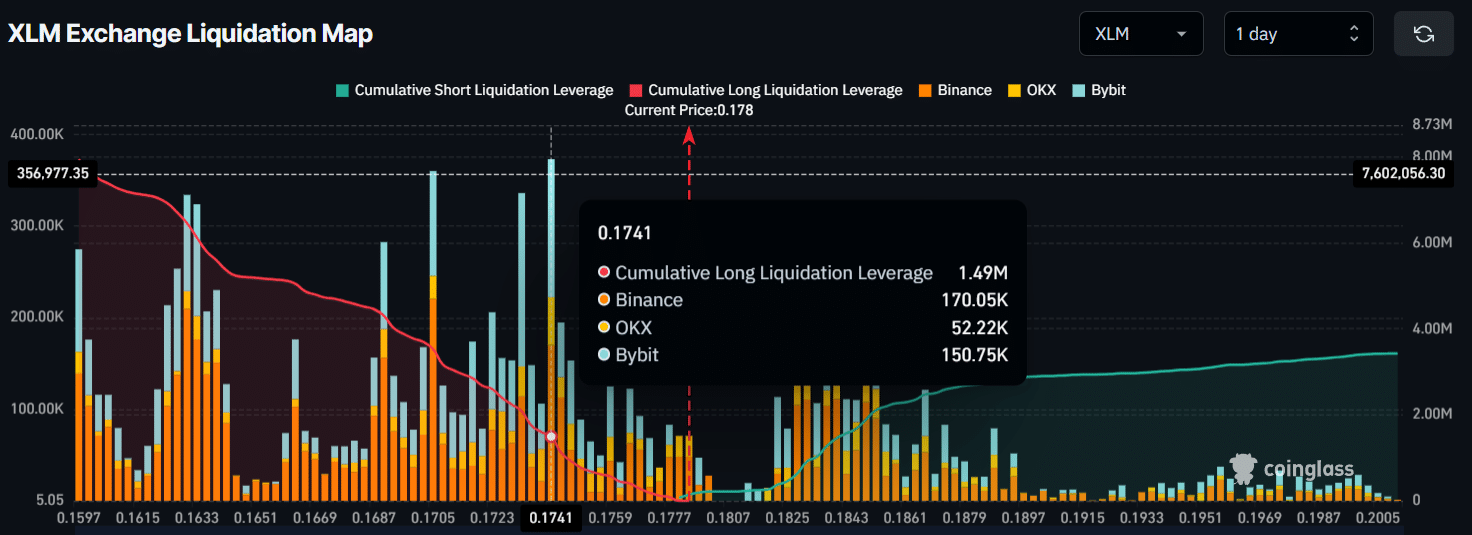
Los datos mostraron que $0.1741 y $0.1831 eran dos niveles principales de liquidación en ambos lados, donde los traders construyeron posiciones largas apalancadas por valor de 1.49 millones de dólares y posiciones cortas apalancadas por valor de 917.85 mil dólares. Estas apuestas insinuaban el dominio de los toros de XLM frente a los osos que posiblemente estaban perdiendo impulso.

Fuente: Coinglass

Los datos mostraron además que los traders han estado tomando posiciones largas de manera creciente, con el Interés Abierto (OI) de XLM aumentando un 35.97% en 24 horas hasta los 120.55 millones de dólares. Esto aludía a una acumulación significativa de posiciones largas apalancadas y a una creciente convicción alcista.

Además, CryptoQuant reveló que el tamaño promedio de las órdenes en el mercado spot ha estado tendiendo al alza en los últimos días, una señal de participación constante de ballenas e grandes inversores.


Reflexiones Finales

  • Stellar (XLM) saltó un 9.25% en 24 horas, superando a activos importantes como BTC, ETH y SOL.
  • La acción del precio se encuentra en un nivel decisivo, y el cierre de una vela diaria por encima de $0.18 podría desencadenar una further rally de precios del 14%.

Perguntas relacionadas

Q¿Por qué Stellar (XLM) se encuentra entre los principales ganadores en el mercado de criptomonedas?

AStellar (XLM) subió más del 9% y se posicionó entre los principales ganadores después de que el mercado de criptomonedas se recuperara en las últimas 24 horas.

Q¿Cuál es el nivel de resistencia clave que XLM logró superar en el gráfico diario?

AXLM rompió el nivel de resistencia clave de $0.18, que se había mantenido firme desde el 1 de febrero de 2026.

Q¿Qué podría desencadenar un aumento adicional del 14% en el precio de XLM?

ASi XLM cierra un candle diario por encima del nivel de $0.18, podría experimentar un aumento de precio del 14% y alcanzar el nivel de $0.21 en los próximos días.

Q¿Qué indican el aumento del Interés Abierto (OI) y el tamaño promedio de las órdenes en el mercado spot?

AEl Interés Abierto (OI) de XLM aumentó un 35.97% en 24 horas, lo que indica una acumulación significativa de posiciones largas apalancadas y una creciente convicción alcista. El tamaño promedio de las órdenes en alza sugiere una participación constante de ballenas e grandes inversores.

Q¿Qué niveles de liquidación importantes se mencionan para los operadores intradía?

ALos datos mostraron que $0.1741 y $0.1831 eran dos niveles de liquidación importantes en ambos lados, donde los operadores construyeron posiciones largas por valor de $1.49 millones y posiciones cortas por valor de $917.85K.

Leituras Relacionadas

Fed's Internal Doves Flock to Hawkish Stance, Warsh's Debut "Between a Rock and a Hard Place"

U.S. Federal Reserve officials who previously advocated for rate cuts, including Governor Christopher Waller, have recently shifted their stance, with many now not ruling out the possibility of future rate hikes. This sets a challenging stage for new Fed Chair Kevin Warsh's first policy meeting. Appointed by President Trump based on his dovish views, Warsh now faces a committee where the debate has pivoted from "when to cut" to "whether to hike," driven by persistent inflation above 3%, a strong labor market, and supply-side pressures from AI infrastructure demands and geopolitical tensions. Key figures illustrate the shift. Governor Waller, once concerned about employment, now says data has pushed him toward considering rate increases. Even moderate voices like Governor Lisa Cook, while expecting inflation to ease, have indicated readiness to hike if it fails to do so. Long-time hawks such as regional Fed presidents Beth Hammack, Lorie Logan, and Neel Kashkari have grown more vocal, arguing that the real policy rate is effectively falling and that action may soon be needed. The upcoming Fed meeting is expected to keep rates steady but will likely remove the "easing bias" from its statement, signaling a neutral stance between cuts and hikes. The quarterly "dot plot" is anticipated to show most officials projecting no cuts this year, with some potentially indicating hikes. Chair Warsh, a critic of the Fed's reliance on forward guidance like the dot plot, must navigate communicating this pivot using tools he has questioned, all while steering policy in a direction counter to the preferences of the president who appointed him. The consensus suggests the Fed's next move could well be a rate increase.

marsbitHá 9m

Fed's Internal Doves Flock to Hawkish Stance, Warsh's Debut "Between a Rock and a Hard Place"

marsbitHá 9m

The Trillion-Yuan Market Cap 'Yi Zhong Tian': Who is the True Value King?

The article analyzes the three leading Chinese optical module companies, collectively nicknamed "Yi Zhong Tian": Xinyisheng, Zhongji Innolight, and TFC Optical Communication. It evaluates their "cost-performance" not by current stock price, but through three lenses: PEG ratio (growth vs. valuation), earnings quality, and premium/discount for certainty. Xinyisheng shows the most attractive PEG ratio and high profitability, but its valuation reflects discounts for risks like high customer concentration and reliance on overseas markets. Zhongji Innolight, the most expensive, commands a premium for its market leadership, dominant share in key products like 800G/1.6T modules, and higher earnings certainty, though it faces geopolitical risks. TFC Optical, as an upstream component supplier ("water seller"), has the highest gross margin and bets on the long-term CPO/NPO architecture trend, but trades at a high valuation with more stable, less explosive growth. The core argument is that while these companies dominate module assembly, the true profit pool and technological moat lie upstream in laser and switch chips, currently controlled by U.S. firms like Lumentum and Coherent. The long-term "cost-performance" for these Chinese leaders hinges on whether the domestic industry, exemplified by companies like Yuanjie Technology, can successfully move up the value chain into high-power laser chips. Otherwise, their high growth may remain confined to the lower-margin assembly segment.

marsbitHá 19m

The Trillion-Yuan Market Cap 'Yi Zhong Tian': Who is the True Value King?

marsbitHá 19m

Has the Crypto Market Bottomed? Here's What Institutions Think

The crypto market is in a period of significant debate, with leading institutions offering differing views on whether a bottom has been reached. Three prominent firms have published detailed analyses: * **Galaxy Digital** argues Bitcoin has **not yet bottomed**. Their analysis of 13 historical indicators across six dimensions (valuation, profit-taking, miner pressure, etc.) shows only four are fully met. They project a potential bottom range between $30k and $54k. * **NYDIG** states a bottom is **possible but not likely**. While metrics are close to historic bear market extremes, they note the absence of a classic panic-selling event. They also suggest increased institutional adoption may have structurally altered the market cycle, potentially leading to a shallower downturn. * **Standard Chartered Bank** asserts the **bottom has already occurred** at around $59k. They cite two key factors: potential US-Iran diplomatic progress and the anticipated SpaceX IPO, which they believe absorbed capital and caused ETF selling pressure that is now subsiding. They forecast a year-end price target of $100k. Despite the surface-level disagreement, the reports share critical common ground more valuable for long-term investors: 1. All three believe the market bottom will form **within this year**. 2. All agree the current price is **closer to the bottom than to previous highs**. 3. All maintain a **bullish long-term outlook** for Bitcoin and a new cycle. The core takeaway is that while the exact bottom price ($40k, $50k, or $60k) is debated, the consensus is that a bottom is imminent. For long-term holders, the primary focus should not be pinpointing the absolute low, but on the future potential for prices to reach $100k, $200k, or higher. The fundamental thesis for Bitcoin—sovereign debt accumulation, inflation, declining trust in centralized institutions, global digitization, and improved accessibility—remains intact and is arguably strengthening. The overall landscape is viewed as more favorable than in previous crypto winters.

marsbitHá 29m

Has the Crypto Market Bottomed? Here's What Institutions Think

marsbitHá 29m

The 'Chip' Challenge and Breakthroughs in China's Optical Industry Chain

China's Photonics Industry: Bottlenecks and Breakthroughs In the global AI race, computing chips dominate the narrative, but the underlying bottleneck increasingly defining the scale of AI clusters is light—or more specifically, optical connectivity. Optical modules, which translate electrical signals to light and vice versa, are crucial for connecting thousands of GPUs in AI data centers, preventing data congestion and ensuring efficient model training. High-speed modules (800G, 1.6T) are now standard, with performance hinging on advanced DSP (Digital Signal Processor) chips. This is where a critical dependency lies. Two US giants—Marvell and Broadcom—collectively dominate over 90% of the high-end DSP chip market. Chinese optical module leaders like Zhongji Innolight and Eoptolink rely on these chips to manufacture modules for overseas AI customers, primarily in North America. While this creates a supply chain vulnerability, complete decoupling is difficult. Marvell derives over half its revenue from Greater China, and the US firms depend on Chinese partners for chip packaging and optical components. The risk from laser chips (e.g., from Lumentum), another key component, is considered more manageable due to multiple global suppliers and faster progress in domestic alternatives from companies like YOFC and Accelink. To mitigate risks, China's industry is pursuing a multi-pronged strategy: diversifying supply chains and locking in long-term orders; fostering a domestic market ecosystem to adopt homegrown DSPs from firms like Huawei HiSilicon and CETC; accelerating R&D in high-speed DSPs and advanced packaging; and investing in next-gen technologies like silicon photonics and Co-Packaged Optics (CPO) to reduce reliance on discrete DSPs. The ultimate solution lies not in short-term博弈 but in persistent advancement of domestic high-end chip R&D and manufacturing. While challenges remain in performance, certification, and ecosystem building, China's vast domestic market and manufacturing base provide a crucial buffer, buying time for the industry to achieve greater technological independence.

marsbitHá 43m

The 'Chip' Challenge and Breakthroughs in China's Optical Industry Chain

marsbitHá 43m

Behind SpaceX's $2 Trillion Market Cap: Why Does Musk Always Have the Next Move Planned?

On June 12th, SpaceX debuted on the Nasdaq, reaching a valuation that briefly touched $2 trillion. This marked the culmination of a 24-year journey from its founding in 2002, driven by Elon Musk's frustration at the high cost of buying rockets. The company's path was defined by early failures, with its first three Falcon 1 launches ending in explosions before a successful 2008 flight opened the era of commercial spaceflight. Key to its model was a fixed-price NASA contract, incentivizing cost reduction. SpaceX mastered rocket reusability, first achieving a Falcon 9 landing in 2015, which drastically cut launch costs. This enabled its profitable Starlink satellite internet constellation, envisioned years before reusability was proven, to create an internal market for frequent launches. Similarly, the next-generation Starship rocket was in development long before its first flight, with its business case evolving from Mars colonization to supporting the emerging concept of in-orbit data centers for AI—a story now central to its valuation. The company's recent IPO, a reversal of its long-standing "no IPO" stance, is funding this ambitious "space-based compute" vision. While major tech players like Google, Blue Origin, and others are investing heavily, significant technical and cost hurdles remain. Ultimately, SpaceX's history is one of creating its own demand: first with Starlink and now with space-based AI compute, betting that its next rocket will enable its next giant market.

marsbitHá 46m

Behind SpaceX's $2 Trillion Market Cap: Why Does Musk Always Have the Next Move Planned?

marsbitHá 46m

Trading

Spot
Futuros

Artigos em Destaque

Como comprar XLM

Bem-vindo à HTX.com!Tornámos a compra de Stellar (XLM) simples e conveniente.Segue o nosso guia passo a passo para iniciar a tua jornada no mundo das criptos.Passo 1: cria a tua conta HTXUtiliza o teu e-mail ou número de telefone para te inscreveres numa conta gratuita na HTX.Desfruta de um processo de inscrição sem complicações e desbloqueia todas as funcionalidades.Obter a minha contaPasso 2: vai para Comprar Cripto e escolhe o teu método de pagamentoCartão de crédito/débito: usa o teu visa ou mastercard para comprar Stellar (XLM) instantaneamente.Saldo: usa os fundos da tua conta HTX para transacionar sem problemas.Terceiros: adicionamos métodos de pagamento populares, como Google Pay e Apple Pay, para aumentar a conveniência.P2P: transaciona diretamente com outros utilizadores na HTX.Mercado de balcão (OTC): oferecemos serviços personalizados e taxas de câmbio competitivas para os traders.Passo 3: armazena teu Stellar (XLM)Depois de comprar o teu Stellar (XLM), armazena-o na tua conta HTX.Alternativamente, podes enviá-lo para outro lugar através de transferência blockchain ou usá-lo para transacionar outras criptomoedas.Passo 4: transaciona Stellar (XLM)Transaciona facilmente Stellar (XLM) no mercado à vista da HTX.Acede simplesmente à tua conta, seleciona o teu par de trading, executa as tuas transações e monitoriza em tempo real.Oferecemos uma experiência de fácil utilização tanto para principiantes como para traders experientes.

337 Visualizações TotaisPublicado em {updateTime}Atualizado em 2026.06.02

Como comprar XLM

Discussões

Bem-vindo à Comunidade HTX. Aqui, pode manter-se informado sobre os mais recentes desenvolvimentos da plataforma e obter acesso a análises profissionais de mercado. As opiniões dos utilizadores sobre o preço de XLM (XLM) são apresentadas abaixo.

活动图片