Bitcoin contre Altcoins : Vous devriez voir ce graphique qui montre qu'une autre saison des altcoins est sur le point de commencer

bitcoinistPublicado em 2026-02-27Última atualização em 2026-02-27

Resumo

L'analyste CyrilXBT a partagé une analyse technique historique suggérant qu'une nouvelle saison des altcoins pourrait être imminente. Le ratio entre la capitalisation boursière totale du marché des cryptomonnaies (hors top 10) et celle du Bitcoin est actuellement à 0,129, un niveau identifié comme la « zone d'accumulation » qui a historiquement précédé chaque rallye majeur des altcoins. Ce ratio, après avoir atteint un pic supérieur à 0,55 lors du marché haussier de 2021, s'est complètement réinitialisé pour revenir à ce seuil critique, similairement aux cycles de 2016 et 2020. L'analyste note que la stabilisation à ce niveau a toujours été le point de départ des saisons altcoins passées. La dominance du Bitcoin (BTC.D) ayant chuté à 57,9 %, son plus bas de l'année, les conditions du marché ressemblent à celles des configurations pré-bull run. Selon le schéma historique, le prochain objectif pour le ratio pourrait se situer entre 0,80 et 0,90 pour le cycle actuel. Cela indique que le marché des altcoins, loin d'être mort, pourrait être en train de préparer son prochain mouvement haussier significatif.

Les discussions sur une potentielle saison des altcoins (altcoin season) lors de ce cycle se sont calmées par rapport aux années précédentes, malgré la récente baisse du prix du Bitcoin (BTC) et de sa domination. Notamment, un analyste crypto a partagé un nouveau graphique à long terme montant la capitalisation boursière totale des altcoins par rapport au Bitcoin à un niveau qui a historiquement précédé les principales saisons des altcoins. Selon son analyse, le marché des altcoins s'est complètement réinitialisé et pourrait se préparer pour une nouvelle saison des altcoins si les tendances historiques se reproduisent comme prévu.

Une configuration historique de saison des altcoins se forme alors que le ratio Bitcoin atteint la zone de base

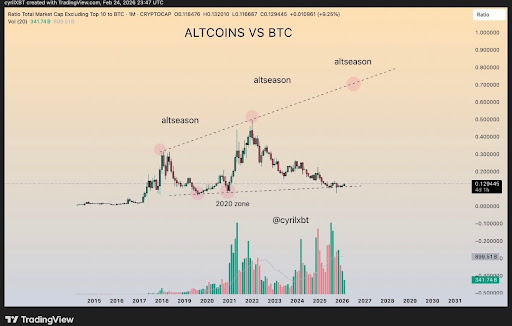
Dans une récente analyse sur X, l'expert du marché @CyrilXBT a partagé un graphique mensuel suivant le ratio du marché crypto total, à l'exclusion des 10 principaux actifs, par rapport au Bitcoin. Selon l'analyse, le graphique se situe actuellement à environ 0,129, un niveau que l'analyste décrit comme la même zone de base ou d'accumulation qui a lancé chaque grande saison des altcoins dans l'histoire de la crypto.

@CyrilXBT a noté que cette zone est l'endroit où toutes les saisons des altcoins naissent, chaque hausse des altcoins passée ayant commencé lorsque le ratio a cessé de baisser et s'est stabilisé autour de la fourchette de 0,12 à 0,13. En regardant le graphique, l'analyste a noté que pendant le cycle 2015-2016, le ratio commence près de zéro et reste plat, avec une volatilité minimale. Suite à cela, une augmentation dramatique s'est produite pendant le bull run de 2017-2018, poussant le ratio altcoin contre Bitcoin au-dessus de 0,3, marquant l'une des premières grandes saisons des altcoins.
Source : X

D'ici 2020, le ratio est retombé en dessous du niveau de 0,129, effaçant la plupart de ses gains précédents alors qu'il se consolidait près de la zone de base/accumulation à faible intervalle. Notamment, 2021 a marqué la plus grande hausse de saison des altcoins de l'histoire, le ratio explosant à la hausse pour dépasser 0,55 au milieu de la frénésie du marché haussier. Pendant cette période, le volume a atteint de nouveaux sommets, les barres dépassant largement celles des années précédentes.

Les conditions d'une nouvelle saison des altcoins prennent forme

Semblable au krach de 2020, le cycle 2022-2024 a connu une correction après le pic, le ratio ayant tendance à baisser alors que le Bitcoin regagnait sa domination. Dans le cycle actuel 2025-2026, le ratio altcoin contre Bitcoin est finalement revenu à la zone d'accumulation historiquement significative de 0,129, le BTC.D tombant à un plus bas annuel de 57,9%.

@CyrilXBT a suggéré que le positionnement actuel reflète la configuration pré-saison des altcoins qui a conduit à une explosion majeure des altcoins les années précédentes. Il a noté que la ligne de tendance haussière reliant les pics successifs des saisons des altcoins sur le graphique indique un ratio d'environ 0,80 à 0,90 comme prochaine cible potentielle pour ce cycle.

Alors que le ratio se stabilise et que les tendances historiques se répètent, @CyrilXBT soutient que les performances récentes du marché n'indiquent pas que les altcoins sont morts. Elles montrent plutôt que le marché s'est complètement réinitialisé et pourrait créer discrètement les conditions de sa prochaine saison des altcoins.

La capitalisation boursière totale des altcoins reste en dessous de 1 000 milliards de dollars | Source : Crypto Total Market Cap Excluding BTC de Tradingview.com

Criptomoedas em alta

Perguntas relacionadas

QQuel niveau du ratio de capitalisation boursière des altcoins par rapport au Bitcoin indique traditionnellement le début d'une saison des altcoins ?

ALe ratio se situe autour de 0,129, un niveau décrit comme la zone de base ou d'accumulation qui a lancé chaque saison majeure des altcoins dans l'histoire de la crypto.

QQuel analyste a partagé l'analyse sur le ratio altcoins/Bitcoin et sur quelle plateforme ?

AL'analyste @CyrilXBT a partagé cette analyse sur la plateforme X.

QQuel a été le pic historique du ratio altcoins/Bitcoin lors du marché haussier de 2021 ?

ALors du marché haussier de 2021, le ratio a explosé pour atteindre plus de 0,55, marquant la plus grande poussée de l'histoire lors d'une saison des altcoins.

QQuel est le prochain objectif potentiel du ratio pour ce cycle, selon la ligne de tendance haussière ?

ALa ligne de tendance haussière reliant les pics successifs des saisons d'altcoins pointe vers un ratio d'environ 0,80 à 0,90 comme prochain objectif potentiel pour ce cycle.

QQue signifie la chute actuelle du ratio vers 0,129 pour le marché des altcoins, selon l'analyse ?

ACela ne signifie pas que les altcoins sont morts, mais plutôt que le marché s'est complètement réinitialisé et pourrait être en train de créer discrètement les conditions de sa prochaine saison des altcoins.
Leituras Relacionadas

Why Has the Bitcoin Market Stalled Amid Positive Macroeconomic Data?

Bitcoin's price remains stagnant despite positive macroeconomic data, such as stabilized U.S. core inflation at 2.5%, which pushed traditional stock markets to new highs. This indifference signals underlying structural issues in the current market cycle, according to analysts. Bitcoin is trapped in a narrow range between the realized price support at $63,000 and the short-term holder cost basis resistance at $68,700. Short-term holders are sitting on unrealized losses and tend to sell as prices approach their break-even point, creating significant selling pressure. This price compression occurs alongside spot trading volumes at their lowest since 2019, indicating a severe lack of retail interest. While selling pressure has shown signs of exhaustion, buyers have not returned. Capital is flowing into the surging stock market, particularly AI-related sectors, instead of Bitcoin. This is evidenced by minimal inflows into spot Bitcoin ETFs and a continued transfer of coins to exchanges, often a precursor to selling. A major concern is the derivatives market, where leveraged long positions are being aggressively accumulated despite the lack of underlying spot demand. This creates a dangerous liquidity imbalance. A negative macro event or sharp price drop could trigger a cascade of long liquidations, potentially crashing the price to the next key support level around $58,500. For a sustained recovery, Bitcoin needs to firmly break above $68,700, accompanied by a significant rise in spot volumes and renewed ETF inflows. Until then, the risk of a sharp decline remains high.

cryptonews.ruMesmo agora

Why Has the Bitcoin Market Stalled Amid Positive Macroeconomic Data?

cryptonews.ruMesmo agora

Asia is Becoming a Testing Ground for Stablecoin-Based Payment Systems

Asia is emerging as the primary testing ground for stablecoin-based payment systems, with Singapore, Hong Kong, and Japan leading the regulatory charge. These jurisdictions are moving from policy consultation to practical implementation, establishing legal frameworks that permit licensed stablecoins for payments and settlements. In 2026, Singapore has authorized major firms like Circle and Coinbase under its digital payment token regime. Hong Kong enacted its Stablecoin Law in 2025, issuing its first two licenses in April 2026. Japan has amended its rules to enhance transaction transparency for crypto exchanges. This regulatory push follows significant existing activity. Hong Kong-based Reap processes about $6 billion annually, with Asia's inter-enterprise stablecoin flows surging from under $100 million monthly in early 2023 to over $3 billion by 2025. The region accounted for $12.5 trillion in stablecoin volume in 2025, with the Singapore-China corridor being the most active. A key insight from a BIS study is that stablecoin transactions are complex; about 60% involve multi-step operations like trading and borrowing, not simple peer-to-peer transfers. This challenges regulators to view stablecoins as programmable settlement tools rather than just digital cash. While progress is uneven—South Korea's legislation is delayed due to debates over issuer eligibility—Asia's advanced banking infrastructure and experience with cross-border finance position it as the natural leader in building the global infrastructure for dollar-denominated stablecoins.

cryptonews.ruHá 2m

Asia is Becoming a Testing Ground for Stablecoin-Based Payment Systems

cryptonews.ruHá 2m

Former ASML Employee at the Helm, China's AMEC's Peer Files for IPO, Focusing on Integrated Circuit Metrology and Inspection Equipment

Eastern Jingyuan Microelectronics Technology (Beijing) Co., Ltd. ("Eastern Jingyuan"), led by a former ASML employee, has filed for a Shanghai STAR Market IPO. The company specializes in integrated circuit (IC) metrology/inspection equipment and manufacturing EDA software, key upstream segments in the semiconductor supply chain. Driven by demand from automotive electronics and AI, China's semiconductor equipment market is expanding rapidly. Eastern Jingyuan's products, including CD-SEM and EBI equipment, as well as computational lithography software (PanGen), aim to break the dominance of international giants like Applied Materials, ASML-HMI, and Siemens EDA in these high-tech, low-domestication-rate fields. Financially, the company's performance is mixed. While revenue grew from 191 million yuan in 2023 to 375 million yuan in 2024, it dipped to 317 million yuan in 2025. The firm has been consistently unprofitable, with net losses totaling approximately 860 million yuan over the past three years. Its gross margin has declined steadily from 67.5% to 39.7%, and both equipment and software毛利率 lag behind industry peers. High R&D expenses (exceeding 90% of revenue) and rising debt levels further pressure profitability. The IPO aims to raise 2.5 billion yuan to fund R&D upgrades for metrology/inspection equipment and EDA tools, alongside working capital. Despite being a domestic pioneer, the company acknowledges gaps versus international leaders in technology, product breadth, and scale, while also facing growing competition from local rivals.

marsbitHá 5m

Former ASML Employee at the Helm, China's AMEC's Peer Files for IPO, Focusing on Integrated Circuit Metrology and Inspection Equipment

marsbitHá 5m

The Era of Easy Gains in AI Ends: 13F Rebalancing Map Points the Way – The Latest 13F Reveals Where Top Institutions' Money is Flowing

The era of easy AI profits is ending, as evidenced by the latest 13F filings from major institutions for Q2 2026. These reports, which are delayed by over 45 days, reveal a significant shift in strategy: capital is moving from a broad "AI frenzy" towards assets with strong cash flows, tangible technology, and durable competitive advantages. Key institutional moves highlight this trend. Temasek increased stakes in SpaceX (representing next-gen infrastructure), Alphabet (for its AI infrastructure and cash flow), and semiconductor equipment giant ASML. Baillie Gifford made SpaceX its top holding. Berkshire Hathaway ended its passive stance with a major $10 billion purchase of Alphabet, while Bridgewater maintains significant positions in tech giants but with a balanced, macro-aware approach. Notably, asset manager JingLin dramatically reduced overall exposure by 43%, completely exiting Nvidia and Meta, and pivoting towards semiconductor equipment and optical communication stocks like ASML and Applied Materials. The analysis reveals several key conclusions: 1. **Alphabet is becoming a consensus holding**, valued for its blend of AI infrastructure, stable cash flows, and reasonable valuation. 2. **Nvidia remains core but faces scrutiny**; its future depends on sustaining growth and justifying its valuation. 3. **Capital is flowing upstream** into semiconductor equipment and hardware (e.g., ASML, AMAT), focusing on the "bottlenecks" of AI compute. 4. **SpaceX represents a new theme** in next-generation infrastructure, attracting long-term capital. The article warns against common mistakes when interpreting 13Fs: treating them as real-time trading signals, focusing only on *what* was bought and not *how much*, and ignoring the different investment styles of the reporting funds. Instead, investors should use a disciplined five-step framework: analyze the overall portfolio structure, focus on marginal changes (new adds/sells), identify sector/theme migrations, look for consensus or divergence among multiple funds, and finally, independently verify the current price, valuation, and fundamentals. In essence, 13Fs provide valuable footprints and research clues left by sophisticated investors, but they are not a substitute for one's own analysis and investment thesis.

marsbitHá 7m

The Era of Easy Gains in AI Ends: 13F Rebalancing Map Points the Way – The Latest 13F Reveals Where Top Institutions' Money is Flowing

marsbitHá 7m

Trading

Spot

Artigos em Destaque

Como comprar ALT

Bem-vindo à HTX.com!Tornámos a compra de AltLayer (ALT) simples e conveniente.Segue o nosso guia passo a passo para iniciar a tua jornada no mundo das criptos.Passo 1: cria a tua conta HTXUtiliza o teu e-mail ou número de telefone para te inscreveres numa conta gratuita na HTX.Desfruta de um processo de inscrição sem complicações e desbloqueia todas as funcionalidades.Obter a minha contaPasso 2: vai para Comprar Cripto e escolhe o teu método de pagamentoCartão de crédito/débito: usa o teu visa ou mastercard para comprar AltLayer (ALT) instantaneamente.Saldo: usa os fundos da tua conta HTX para transacionar sem problemas.Terceiros: adicionamos métodos de pagamento populares, como Google Pay e Apple Pay, para aumentar a conveniência.P2P: transaciona diretamente com outros utilizadores na HTX.Mercado de balcão (OTC): oferecemos serviços personalizados e taxas de câmbio competitivas para os traders.Passo 3: armazena teu AltLayer (ALT)Depois de comprar o teu AltLayer (ALT), armazena-o na tua conta HTX.Alternativamente, podes enviá-lo para outro lugar através de transferência blockchain ou usá-lo para transacionar outras criptomoedas.Passo 4: transaciona AltLayer (ALT)Transaciona facilmente AltLayer (ALT) no mercado à vista da HTX.Acede simplesmente à tua conta, seleciona o teu par de trading, executa as tuas transações e monitoriza em tempo real.Oferecemos uma experiência de fácil utilização tanto para principiantes como para traders experientes.

265 Visualizações TotaisPublicado em {updateTime}Atualizado em 2026.06.02

Como comprar ALT

Discussões

Bem-vindo à Comunidade HTX. Aqui, pode manter-se informado sobre os mais recentes desenvolvimentos da plataforma e obter acesso a análises profissionais de mercado. As opiniões dos utilizadores sobre o preço de ALT (ALT) são apresentadas abaixo.

活动图片