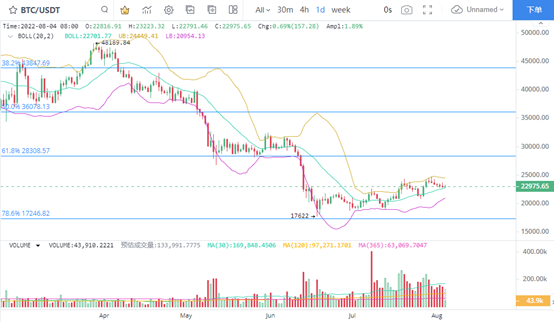
1. BTC currency holding cost down
In the daily K-line chart, the trading volume of BTC is relatively stable, and the volume and price performance in the past month is relatively active, during which a large number of BTCs have changed hands. Based on this, BTC is already at a very concentrated price. Although there are still many hold ups at the high price, the number of hold ups continues to decrease with the adjustment. At present, the daily trading volume of BTC is not strong enough, and the continuous decline of prices may further indicate the decline expectation. Therefore, around the price range below $25000, low absorption is more likely to reduce the risk of holding currency.
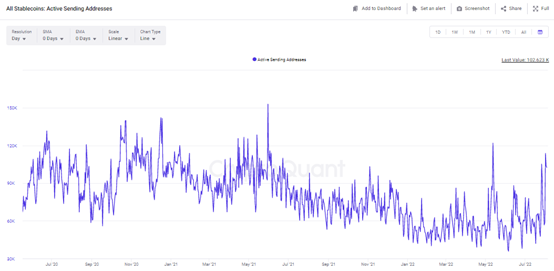
2. Stable currency prompts capital flight
The number of active addresses of stable coins has increased significantly. Among them, the number of active addresses sending stable coins increased rapidly, reaching a high of 103000 on August 3. Recently, the peak value of the stable currency rose, and the peak performance continued on July 12 and August 1, with the corresponding values reaching 122000 and 114000 respectively. This shows that the overall investors are not confident in the current transaction, and sending a stable currency may be a signal of capital flight.
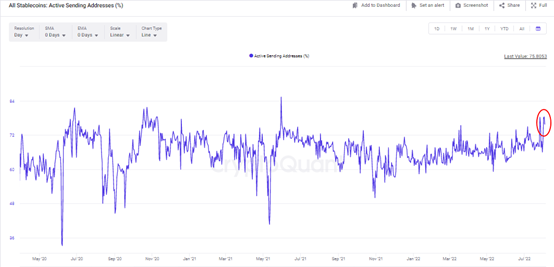
3. The proportion of stable currency sending addresses increased
The proportion of sending addresses of stable currency has effectively rebounded, and its short-term peak has reached around 79%, indicating that the number of sending addresses still has a large share. The proportion of actively sending stable coins decreases, while the proportion of receiving stable coins is very low. This shows that the number of addresses receiving stable currency remains at a low level, and few investors actively buy stable currency, which may limit market performance.
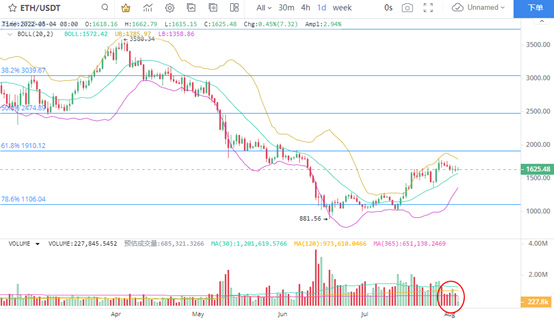
4. Eth trading volume remained low
The trading volume performance of eth is obviously lower, and the shrinking trend of trading volume in the short-term six trading days is very significant. In terms of price, ETH began to callback after reaching $1784 in the short term, and the volatility was obviously at a low level. The shrinking trading volume and the low intensity of price fluctuations mean that there are more opportunities for eth to decline sideways.
At present, the middle rail of brin line can support eth horizontal consolidation, but there is obviously insufficient space to continue downward. Therefore, ETH only needs a small pullback at present, which may expand the adjustment space after falling below the brin line medium rail. There is a large downward space from around $1600, so we should pay attention to tracking risks in the short term.
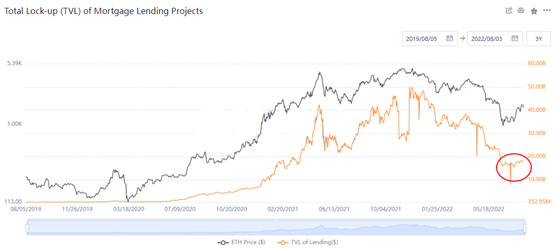
5. Eth mortgage loan project TVL low level operation
Used to judge the utilization rate of eth chain, the total lock up (TVL) value of mortgage lending projects on eth chain is relatively low, especially the relative historical high has significantly shrunk by 64%, indicating that the current data on the chain has limited support for eth price. On August 3, the total lock up volume of its on chain lending reached US $17.89 billion, a significant decrease from the historical high of nearly US $50billion.
After entering the adjustment state, the ETH chain lock volume data showed signs of continuous stabilization, but the short-term rebound space is not high. This also shows that the rapid rebound of eth short-term price has deviated from the fundamentals, and the pressure of price adjustment may appear in the short term.