Bitcoin Taker Buy/Sell Ratio Short-Term Bull Signal Goes Off

newsbtcPublicado em 2022-07-06Última atualização em 2022-07-06

Resumo

On-chain data shows the Bitcoin taker buy/sell ratio has recently crossed above '1,' a sign that the crypto could experience short-term bullish momentum. Bitcoin Taker Buy/Sell Ratio Surges Up Above...

On-chain data shows the Bitcoin taker buy/sell ratio has recently crossed above ‘1,’ a sign that the crypto could experience short-term bullish momentum.

Bitcoin Taker Buy/Sell Ratio Surges Up Above A Value Of 1

As explained by an analyst in a CryptoQuant post, the current BTC taker buy/sell ratio trend may suggest the crypto might see sideways movement or a bullish reversal in the short-term.

The “taker buy/sell ratio” is an indicator that tells us about the ratio between the long and short volumes in the Bitcoin futures market.

When the value of this metric is greater than one, it means the long volume is more dominant at the moment. Such a trend suggests that the general sentiment is bullish right now.

On the other hand, the indicator’s value being less than that implies that the selling pressure is currently stronger than the buying pressure in the Bitcoin market.

Now, here is a chart that shows the trend in the BTC 50-day moving average taker buy/sell ratio over the last year:

Bitcoin Taker Buy/Sell Ratio

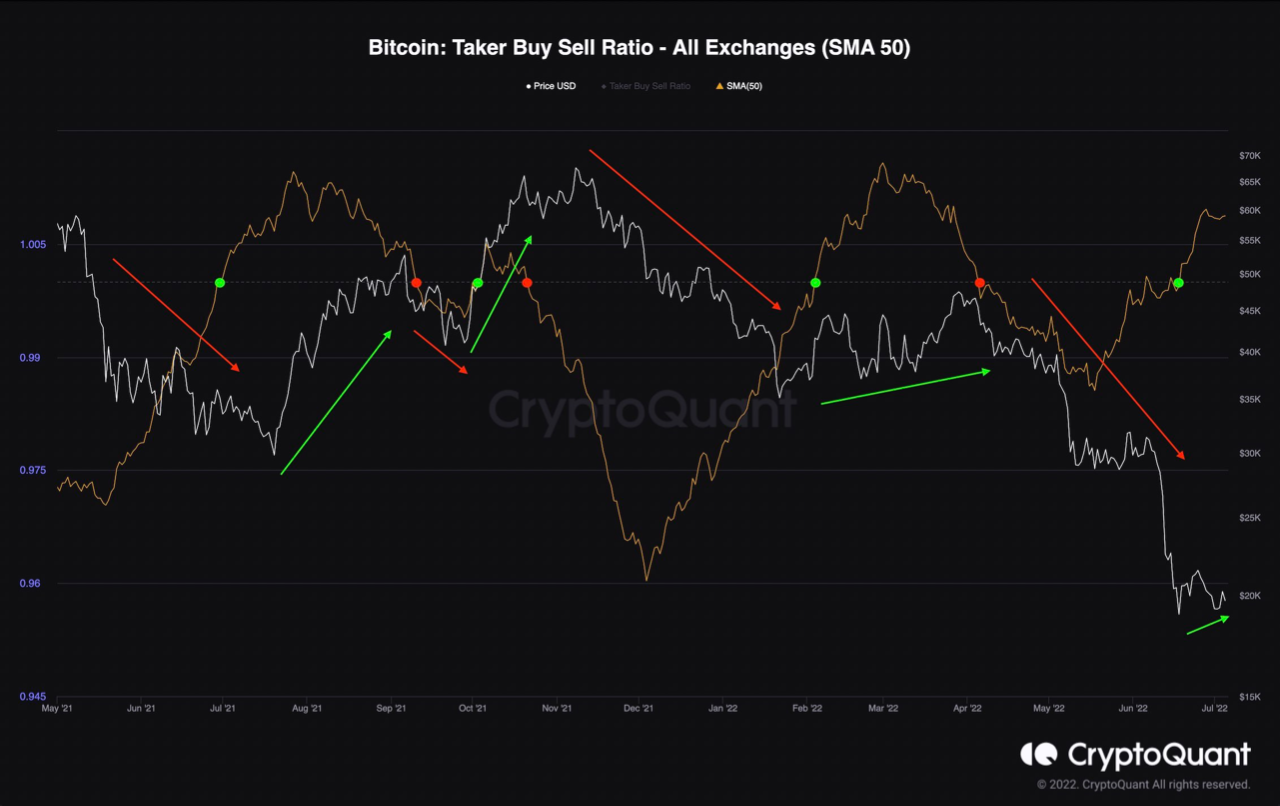
Looks like the value of the metric has surged up in recent weeks | Source: CryptoQuant

As you can see in the above graph, the quant has marked the relevant points of trend for the Bitcoin taker buy/sell ratio.

It seems like whenever the indicator has sunk below a value of one, the coin’s price has observed a bearish trend soon after.

Similarly, the ratio crossing over the one line has usually been followed by a bullish reversal or sideways movement for the crypto.

In recent weeks, the taker buy/sell ratio’s value has once again observed a surge and has now gone past the “one” threshold.

If the past trend is anything to go by, this could mean that Bitcoin may have either a temporary bullish reversal or sideways movement in store for the near future.

BTC Price

At the time of writing, Bitcoin’s price floats around $20.5k, up 2% in the last seven days. Over the past month, the crypto has lost 31% in value.

The below chart shows the trend in the price of the coin over the last five days.

Bitcoin Price Chart

The value of the crypto seems to have shot up over the past day | Source: BTCUSD on TradingView

Over the last few days, Bitcoin has been mostly consolidating sideways. However, in the past twenty-four hours or so, the coin’s value seems to have gained some upwards momentum as it now breaks above the $20k mark again.

Leituras Relacionadas

Why Is the World Nervous About Japan Raising Interest Rates?

In June 2026, the Bank of Japan raised its policy rate to 1%, marking its first hike to this level since 1995. While this rate remains low compared to global peers like the US and Europe, the move signals a profound shift for a nation that has been a global source of ultra-cheap funding for decades. Japan's long-standing near-zero or negative interest rates had facilitated massive "yen carry trades," where international investors borrowed low-cost yen to invest in higher-yielding assets worldwide, such as US tech stocks and emerging market bonds. This made Japan a critical, often overlooked, source of global liquidity. Japan's ultra-loose policy stemmed from structural challenges post-1990s asset bubble: aging demographics, chronic low inflation/deflation, and high public debt. Recent shifts, including sustained wage growth (exceeding 5% in recent years) and inflation consistently above the 2% target, have created a "wage-price spiral" possibility, prompting the policy normalization. The global market's concern lies not in the absolute rate but in the potential unwinding of the yen carry trade. As Japanese borrowing costs rise, the economics of these leveraged global investments change, potentially triggering deleveraging and capital outflows from risk assets. Market anxiety focuses on the end of a thirty-year consensus that Japan would perpetually provide cheap funding. Ultimately, the global impact will depend on the interplay with US monetary policy. While Japan is tightening, the significant interest rate differential with the US remains. The key future dynamic is whether simultaneous Japanese hikes and eventual US rate cuts will narrow this gap, forcing a major recalibration of global capital flows and asset pricing built on an era of abundant, cheap yen liquidity.

marsbitHá 1h

Why Is the World Nervous About Japan Raising Interest Rates?

marsbitHá 1h

Research Report Analysis: MRVL's Optical AI Booming, Why High Valuation Keeps Morgan Stanley's Star Analyst Sidelined?

Report Recap: MRVL Optical AI Boom - Why High Valuation Led Morgan Stanley's Star Analyst to Stay Neutral? Morgan Stanley analyst Joseph Moore maintained an "Equal-weight" (Neutral) rating on Marvell Technology (MRVL) on May 28, raising the price target from $172 to $195, below the trading price. This stance comes despite Marvell reporting a record quarter and significantly raising its full-year outlook (FY27 revenue ~$11.5B, up ~40%). Moore's neutral view is based on valuation. The $195 target implies ~40x CY2027 P/E. He contrasts MRVL with NVDA: both trade near ~$200, but Nvidia's forward EPS is more than double Marvell's. For MRVL's valuation to hold, it needs consistent earnings upgrades, proof of networking market share gains, or certainty on large-scale custom AI chip shipments—none of which are confirmed yet. Growth is driven by two pillars: **1) Optical Interconnect** (the faster runner): Moore raised FY27 growth expectations to >70%, with the optical module product line nearing a $1B annualized run rate. **2) Custom AI Chips** (the climber): Confidence in FY28 is growing, but a major new customer project only ramps in FY28, with no current revenue visibility. Key risks are the underperforming Storage, Enterprise, and legacy Networking segments. Moore acknowledges the real AI opportunity but believes the current price already reflects it. For the stock to work from here, investors need to see the optical business hit its targets, custom chips ramp as planned, and a recovery in the weaker business units.

marsbitHá 2h

Research Report Analysis: MRVL's Optical AI Booming, Why High Valuation Keeps Morgan Stanley's Star Analyst Sidelined?

marsbitHá 2h

qinbaFrank: Review and Outlook of the AI Computing Power Wave — From the Three Debates on NVIDIA to Optical Interconnect and SpaceX IPO, How is Capital Rotating?

**Summary: Retrospective and Outlook on the AI Computing Wave - A Framework for Capital Rotation** Based on a presentation by investor qinbaFrank, this analysis reviews the AI computing market trajectory since 2023 and outlines a forward-looking framework. **Key Phases and Market Debates:** The AI bull market progressed through three major debates: 1) The necessity of massive capital expenditure (late 2023). 2) The sustainability of tech giants' spending (early 2024-early 2025). 3) Potential overestimation of compute needs (early 2025). Consensus solidified in late 2025 as model capabilities and utility demonstrably improved. **Core Thesis: Penetration Rate Drives Commercialization.** Unlike the 2000 dot-com bubble, the current AI wave benefits from mature digital infrastructure, enabling faster adoption. The critical threshold is 10% penetration; surpassing it (with recent enterprise intent surveys showing ~18%) indicates entry into a rapid growth "golden period" where user scale and willingness to pay increase simultaneously. **AI vs. Internet: A Fundamental Difference.** While the internet enhanced connection efficiency, AI directly substitutes human cognition and labor. Once AI performance exceeds the "societal average" human level, its commercial value scales exponentially as payment shifts from human labor costs to AI service fees. **Investment Logic Evolution in the Compute Chain.** The focus has expanded from GPUs to a systemic re-rating of the entire hardware stack: storage/HBM, CPUs, interconnects, power, and advanced packaging. The framework is: **short-term "scarcity pricing," mid-term "upgrade pricing" (e.g., optical interconnects, power networks), and long-term "Physical AI" pricing** (edge computing, robotics). **Market Focus Shift and Adjustment Framework.** The market is transitioning from "hardware scarcity" to "commercialization validation." The ultimate anchor for the narrative is sustained high growth in model providers' Annual Recurring Revenue (ARR) and cloud business revenue, which justifies continued capital expenditure. Adjustments are categorized into three levels: * **L1 (Minor):** Driven by valuation compression or macro noise (e.g., single CPI print). Fundamentals intact. * **L2 (Moderate):** Triggered by significant macro events requiring risk repricing. Requires new data for confidence restoration. * **L3 (Major):** Involves a reset of the core industrial narrative or macro regime (e.g., AI commercialization growth stalling). The **crucial dividing line** is whether AI commercialization growth slows. Without a slowdown, pullbacks are likely L1/L2 "repricing" events. A genuine growth deceleration would signal an L2/L3 narrative reset. **Conclusion: A Foundational Civilizational Leap.** AI represents a foundational upgrade to "intelligence" itself—akin to humanity mastering fire—rather than a single-point industrial revolution. This底层能力跃迁 (underlying capability leap) will spawn successive waves of innovation (Agent, robotics, industry workflow重构). The journey will be波浪式的 (wavelike), driven by cycles of scarcity, technological upgrades, and远期兑现 (long-term realization).

marsbitHá 2h

qinbaFrank: Review and Outlook of the AI Computing Power Wave — From the Three Debates on NVIDIA to Optical Interconnect and SpaceX IPO, How is Capital Rotating?

marsbitHá 2h

Trading

Spot
Futuros
活动图片