Terra's Crypto Tokens UST and Luna Classic Mysteriously Pumped This Week, UST Climbed by 470%

newsbtcPublicado em 2022-07-01Última atualização em 2022-07-01

Resumo

Luna Classic and the Once-Stable Coin UST Rise Significantly Against the US Dollar.

Terra's Crypto Tokens UST and Luna Classic Mysteriously Pumped This week, UST Climbed by 470%

After the downfall of the two most popular crypto assets on the Terra blockchain, the digital currencies terrausd (UST) and luna classic (LUNC) increased a great deal in value against the U.S. dollar in recent times. During the last seven days, LUNC has risen 96.3% and the once-stable coin UST has increased 472.4% this week.

Luna Classic and the Once-Stable Coin UST Rise Significantly Against the US Dollar

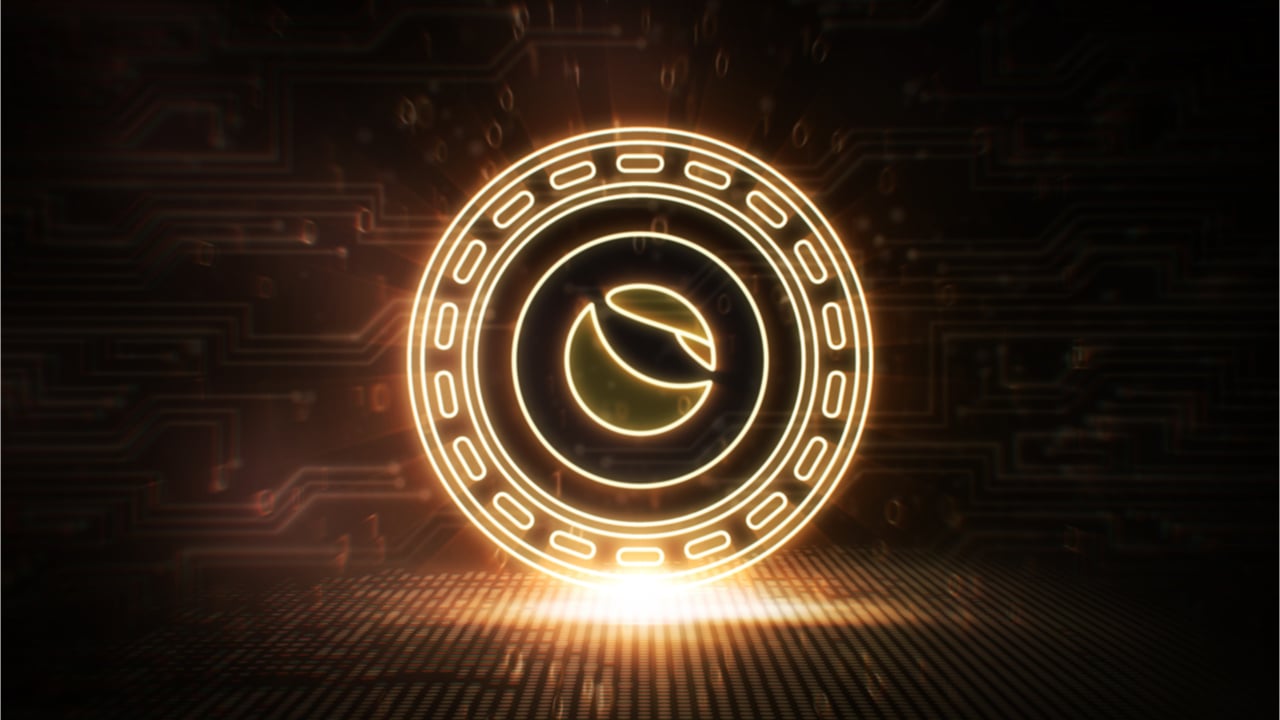
It’s pretty well known in the world of digital currencies that some crypto assets never die. That seems to be the case with the two notorious crypto assets luna classic (LUNC) and terrausd (UST), a former stablecoin that is sometimes referred to as terraclassicusd (USTC).

LUNC took the name luna classic because Terra’s new token is now referred to as LUNA. UST was once stable and held the $1 parity from October 2020 up until May 9, 2022. When UST depegged it dropped below a U.S. penny, and tapped a low of $0.006 per unit on June 18, 2022.

However, since the $0.006 per unit low, UST has jumped 617.5% from that range. UST swelled by 472.4% this week to $0.0926 per unit on June 29. While UST dropped in value after that rise, it still held a 24-hour trading range of around $0.04217516 to $0.081822 on Thursday, June 30.

Terra's Crypto Tokens UST and Luna Classic Mysteriously Pumped This Week, UST Climbed by 470%

When UST depegged on May 9, LUNC was already dropping in value, but four days prior, LUNC was exchanging hands for $82 per unit. The day UST depegged, LUNC changed hands at a high that day at $61 per unit, but by the following day, it was trading for $27 per LUNC.

Since then, LUNC hit an all-time low four days after the depegging incident to $0.000000999967 on May 13. Miraculously, not only has LUNC risen 96.3% this week, it is up 10,577% from the all-time low. At the time of writing, LUNC has seen $545.87 million in daily trade volume, while UST recorded $522.60 million during the past 24 hours.

LUNC has a market valuation of around $812,399,236 with 6,907,072,876,045 LUNC in circulation today. There’s 10,254,324,366 UST circulating right now, which gives UST a market valuation of around $477.73 million.

UST holders are still using the Anchor protocol as 573,636,728 UST is locked in the system. The Anchor savings protocol on the Terra Station wallet promises a 16.26% annual percentage yield (APY).

Furthermore, defillama.com statistics indicate that there’s $9.23 million in LUNC held on the decentralized finance (defi) risk management marketplace Risk Harbor. The Terra Classic chain and luna classic (LUNC) still have a fairly active community by observing posts on social media.

Terra Classic still has active validators as well, and just recently a governance proposal was introduced that would give validators a universal minimum commission of 10%. One particular validator called LUNC DAO told its 29,000 Twitter followers that the validator was against the minimum commission rate of 10%.

At the time of writing, 37.04% voted in favor of the proposal and 24.80% said no to the idea. Meanwhile, the new LUNA 2.0 token has had a lackluster week compared to the digital currency’s siblings.

LUNA 2.0 is up 7% this week, but the new crypto asset that stems from the Terra Phoenix blockchain is down 76.6% during the past month. Out of more than 13,000 crypto assets in existence today, LUNA 2.0 commands the 124th position with a $273 million market cap. The once-stable coin UST’s market capitalization ($477.73M), on the other hand, holds the 87th position.

Leituras Relacionadas

SemiAnalysis Dissects Huawei's Kirin 9030: Process Technology Halted, So They Folded the Chip

SemiAnalysis has published a detailed teardown report on the HiSilicon Kirin 9030 Pro chipset found in Huawei's Mate 80 Pro. Fabricated using SMIC's most advanced N+3 node without EUV lithography, the analysis reveals significant technical achievements and strategic shifts. The report indicates SMIC's N+3 has achieved transistor density comparable to TSMC's N6 (113.4 vs 107.7 MTr/mm²), primarily through aggressive use of Self-Aligned Quadruple Patterning (SAQP) for its metal layers. This results in a notably small 32.5nm M0 metal pitch. However, SemiAnalysis notes this achievement comes with significantly higher process complexity, cost, and potential yield challenges compared to competitors using more advanced tools. The Kirin 9030 design maximizes this constrained density. While its GPU performance has improved ~70% and matches Qualcomm's 2022 flagship level, the CPU core's IPC lags behind current top-tier designs from Apple and Qualcomm, a gap attributed to the underlying manufacturing technology rather than design capability. Facing long-term restrictions on advanced tools, Huawei is charting a new path. The report highlights the company's "LogicFolding" roadmap, a 3D stacking technique aimed at shortening signal paths to boost performance and efficiency. The goal is to reach 5GHz frequency and a projected density of 295 MTr/mm² by 2031. SemiAnalysis concludes that export controls have not halted China's chip progress but have fundamentally altered its trajectory, making it more expensive and complex. This has spurred innovation in alternative areas like 3D stacking and domestic EDA tool development, with Huawei's supply chain also beginning to integrate Chinese memory from CXMT.

marsbitHá 4m

SemiAnalysis Dissects Huawei's Kirin 9030: Process Technology Halted, So They Folded the Chip

marsbitHá 4m

How Will the Price Move Before SpaceX's Next Share Unlock?

TL;DR Investors buying SPCX after SpaceX's IPO are not simply investing in a typical tech stock. It’s a high-valuation asset driven by Musk's narrative, Starlink, and space transport potential, but with a key twist: a very small initial float of ~4% has led to significant post-listing price appreciation. The current price action reflects a timing gap. Before the first lock-up expiration (estimated around August, subject to official confirmation), scarcity and high demand could continue to push prices up. Short-term bulls focus on low float, FOMO, and potential index inclusion. However, bears point to the supply dynamics that will change post-lockup. Existing shareholders still hold over 95% of shares, which will be released in stages starting from the first unlock window. This introduces future selling pressure from low-cost holders. The upcoming Q2 earnings report is a critical catalyst before the unlock. It will test whether the company's fundamentals can justify the current ~$2.1T valuation. Strong results could support the pre-unlock momentum, while weak figures could amplify concerns about future supply. The trading thesis is shifting from immediate scarcity ("can't buy enough") to evaluating future absorption capacity ("who will buy when more supply hits"). The path ahead hinges on the specifics of the unlock schedule, Q2 earnings performance, and whether anticipated passive index buying materializes.

marsbitHá 24m

How Will the Price Move Before SpaceX's Next Share Unlock?

marsbitHá 24m

Bitcoin Short-Term Bullish Structure Validated, HYPE Low-Entry Window Opens | Guest Analysis

**Market Analysis Summary (Week of June 2026)** **Overall Market Context:** The market environment is exceptionally complex, with the unexpected US-Iran agreement and the reopening of the Strait of Hormuz triggering a global asset repricing and significant volatility. This heightened noise underscores the importance of a structured analytical framework. **Bitcoin (BTC) Analysis & Strategy:** * **Current Status:** The price has climbed above $65,000, currently in a rebound phase (segment 38-39) following a complex 12-segment correction from the May high of $82,850. * **Key Levels:** * **Primary Resistance:** $69,500–$70,500. A successful breakout above $65,000 targets this zone. * **Primary Support:** $65,000 (immediate), followed by $59,000–$60,000 and $55,000. * **Weekly Outlook & Strategy:** The focus is on the confirmation of the $65,000 level. * **Bullish Scenario (Hold $65K):** A move toward the $69.5K–$70.5K resistance zone is anticipated, which is a potential area for initiating medium-term short positions. * **Bearish Scenario (Break below $65K):** A retest of the $60,000–$62,000 support range is likely. * **Medium-Term Strategy:** Currently neutral. Plan to establish short positions (up to 60% allocation) either in the $69.5K–$70.5K resistance zone upon signs of rejection, or on a confirmed breakdown below $65,000 and further below $59K–$60K. * **Short-Term Strategy:** Utilize 30% capital for scalping opportunities based on support/resistance levels, using 30/60-minute charts. **HYPE Analysis & Strategy:** * **Current Status:** The price has stabilized around $52 after a four-segment decline from the June high of $75.87 and is now in a rebound (segment 50-51). * **Key Levels:** * **Primary Resistance:** $62.50–$64.57. Watch for potential rejection here to form a lower high. * **Primary Support:** $52–$55.50, followed by $47–$49. * **Weekly Outlook & Strategy:** Adopt a "buy on dips, avoid chasing rallies" approach. * **Core View:** Monitor the price action and potential formation of a lower high ("endpoint 51") in the $62.50–$64.57 resistance zone. * **Short-Term Strategy:** Consider light long positions (max 30% allocation) if the price finds support and shows reversal signals in the $52–$54.50 or deeper $47–$49 support zones, confirmed by proprietary quantitative bottom signals. **Trade Review:** Last week's HYPE short-term long trade, executed based on proprietary "Price Difference" and "Momentum" model signals, yielded a profit of approximately 11.88%. The entry was near $54.39 and exit near $60.85. **Risk Management Reminder:** Always set an initial stop-loss upon entry. Move stop-loss to breakeven at +1% profit, then trail it upwards to lock in gains as the trade progresses. *Disclaimer: All analysis, models, and strategies are based on personal technical analysis for educational purposes only, not investment advice. The market carries inherent risk.*

Odaily星球日报Há 29m

Bitcoin Short-Term Bullish Structure Validated, HYPE Low-Entry Window Opens | Guest Analysis

Odaily星球日报Há 29m

Bitcoin Short-Term Bullish Structure Validated, HYPE Accumulation Window Opens | Guest Analysis

**Bitcoin and HYPE Market Analysis: Short-Term Outlook and Trading Strategies** This market analysis examines Bitcoin (BTC) and HYPE amid volatile conditions, providing short-term outlooks and specific trading strategies. **Key Outlooks:** * **Bitcoin (BTC):** Focus is on whether BTC's recent move above $65,000 holds. A successful breakout could lead to a test of the $69,500-$70,500 resistance zone, where medium-term short positions are considered. A failure, breaking below $65,000, may trigger a decline towards the $59,000-$60,000 support area. * **HYPE:** The token completed a four-wave correction and is now rebounding. The key resistance zone is $62.5-$64.57. The trading strategy is "buy on dips," looking for entry opportunities near the $52-$54.5 or deeper $47-$49 support zones, pending confirmation from proprietary models. **BTC Trading Strategy:** * **Medium-term:** Primarily looking to establish short positions (up to 60% allocated capital) if price rallies to the $69,500-$70,500 resistance area and shows signs of reversal. Alternative plans involve initiating shorts on a breakdown below $65,000. * **Short-term:** Allocate up to 30% capital for intraday "spread" trades based on support/resistance levels on 30/60-minute charts. **HYPE Trading Strategy:** * **Short-term:** Adopt a dip-buying approach. Consider light long positions (under 30% capital) when price tests key support levels ($52-$54.5 or $47-$49) and shows stabilization, confirmed by proprietary "Price Spread" and "Momentum Quant" models. **Trade Recap:** The analysis reviews a successful HYPE long trade from the previous week, executed at ~$54.39 and closed at ~$60.85 for an ~11.88% gain, based on signals from the aforementioned models. **Risk Management Emphasis:** The article stresses strict capital allocation (under 30-60%), immediate initial stop-loss placement, and a trailing stop-loss protocol to lock in profits as trades move favorably. ***Disclaimer:** All analysis, models, and strategies are for educational purposes based on technical analysis, not investment advice. Markets are volatile; trade with caution.*

marsbitHá 32m

Bitcoin Short-Term Bullish Structure Validated, HYPE Accumulation Window Opens | Guest Analysis

marsbitHá 32m

Trading

Spot
Futuros
活动图片