Memecoins vs. Altcoins: Market Cap Ratio Signals Potential Reversal

bitcoinistPublicado em 2025-09-15Última atualização em 2025-09-15

Resumo

Memecoins have been under heavy selling pressure since December 2024, with many declaring the sector as good as dead. Prices...

Trusted Editorial content, reviewed by leading industry experts and seasoned editors. Ad Disclosure

Memecoins have been under heavy selling pressure since December 2024, with many declaring the sector as good as dead. Prices collapsed across the board, liquidity dried up, and retail enthusiasm that once fueled massive rallies seemed to vanish. For months, memecoins have trended lower, underperforming most of the broader crypto market and leaving investors skeptical about their long-term survival.

Yet, despite the gloom, some analysts argue that dismissing memecoins entirely may be premature. As the market prepares for a new phase driven by shifting liquidity flows, institutional positioning, and macroeconomic catalysts, speculation could once again find fertile ground in this volatile sector. Top analyst Darkfost has gone as far as to suggest that the time to take a fresh look at memecoins may have arrived. According to him, data shows that the market is entering an area where memecoin dominance has historically regained strength, often sparking sharp rebounds.

While risks remain high—memecoins are still among the most speculative assets in crypto—the potential for explosive gains continues to attract attention.

Memecoin Dominance Signals Possible Rebound

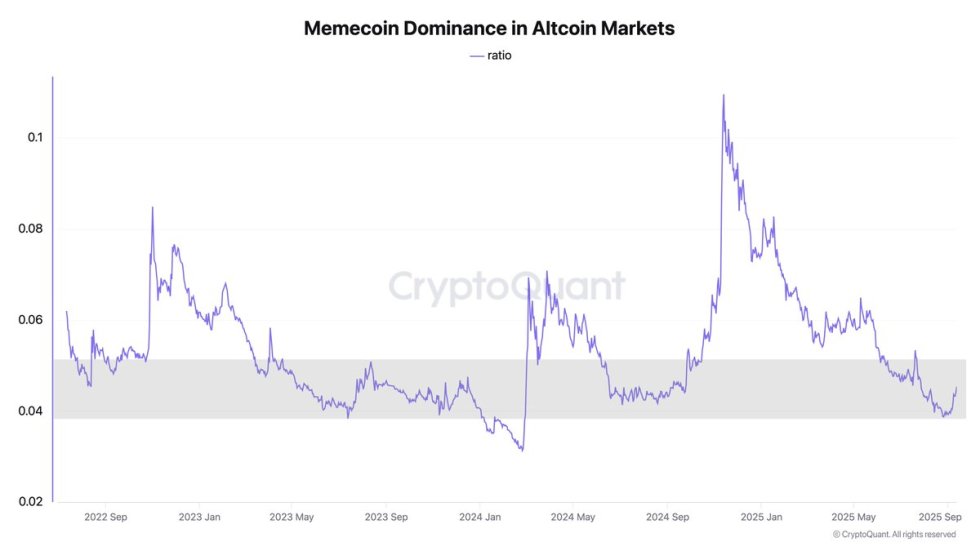
Darkfost highlights the importance of monitoring the Memecoin Dominance in Altcoin Markets chart, which compares the market capitalization of key memecoins against that of established altcoins. This ratio offers valuable insight into whether memecoins are gaining or losing influence relative to the broader altcoin sector.

Since the massive rush that peaked at the end of 2024, memecoins have been in a prolonged decline, steadily losing both valuation and investor interest. The frenzy that once drove parabolic gains gave way to exhaustion, with most of the sector retracing sharply.

Memecoin Dominance in Altcoin Markets | Source: Darkfost

Investors in memecoins understand the unique challenge of this asset class. Unlike Bitcoin or Ethereum, memecoins often lack fundamental backing, making them highly speculative. As a result, timing entries and, more importantly, exiting positions quickly to secure profits are essential strategies. Hesitation can easily turn short-term gains into significant losses.

Despite this, Darkfost observes that the memecoin dominance chart is signaling a potential turning point. The ratio has entered an area where memecoins have historically regained strength, marking the beginning of sharp rebounds. Early signs of reaction suggest that market sentiment may be shifting, with speculative capital slowly re-entering the space.

If the trend persists, the conditions could align for a renewed memecoin mania. While it may not replicate the extreme fervor of late 2024, a resurgence in speculative appetite could drive significant rallies. For traders watching closely, the data implies that memecoins may once again become a hot narrative in the crypto cycle, though managing risk remains paramount.

Market Cap Growth Analysis

The chart of the Memecoin Market Cap (Daily) shows how the sector remains highly volatile, reflecting speculative behavior that defines this corner of the crypto market. After rebounding strongly from the July lows near $64B, the market surged to a local peak above $88B in early September. However, that momentum quickly faded, with the cap now retracing toward $75B, down nearly 5% in the latest session.

Crypto Memecoin Market Cap | Source: MEME.C chart on TradingView

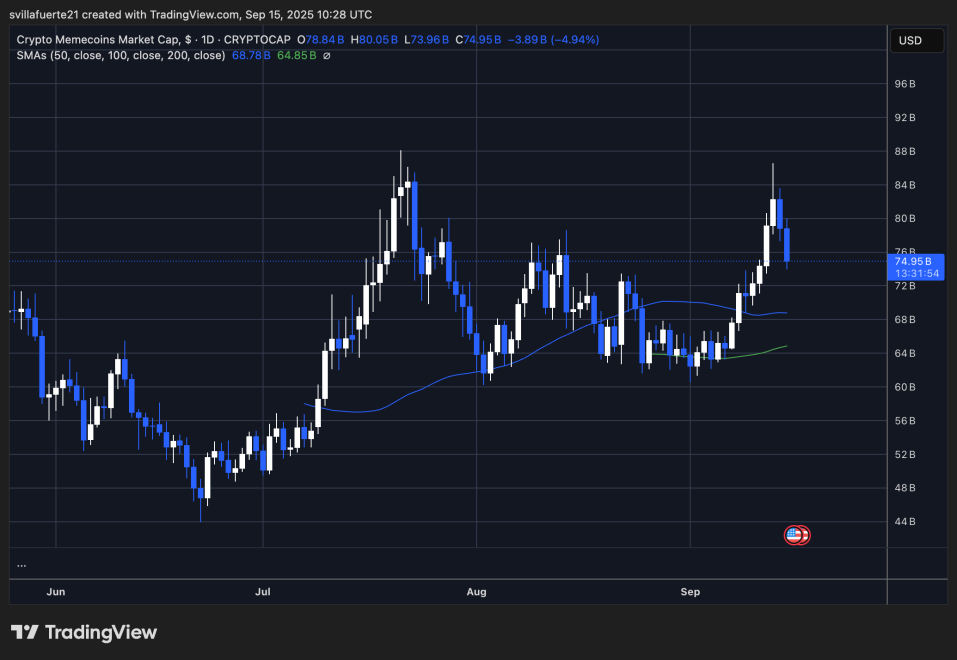
The 50-day moving average at $68.7B has acted as a strong dynamic support throughout this recovery, showing that buyers continue to step in when valuations approach this level. Meanwhile, the sector’s ability to push above $80B and briefly test the $88B resistance highlights that speculative capital is still present, even if profit-taking remains aggressive.

For now, memecoins are consolidating after a sharp upswing, and the market appears to be searching for balance. If capitalization holds above the $72–74B range, a renewed attempt to reclaim $80B could follow, reigniting bullish sentiment. On the other hand, a breakdown below the 50-day average would suggest fading momentum and open the door for a deeper retracement. Ultimately, memecoins remain sensitive to liquidity flows and broader risk sentiment, making timing critical.

Featured image from Dall-E, chart from TradingView

Editorial Process for bitcoinist is centered on delivering thoroughly researched, accurate, and unbiased content. We uphold strict sourcing standards, and each page undergoes diligent review by our team of top technology experts and seasoned editors. This process ensures the integrity, relevance, and value of our content for our readers.

Sebastian's journey into the world of crypto began four years ago, driven by a fascination with the potential of blockchain technology to revolutionize financial systems. His initial exploration focused on understanding the intricacies of various crypto projects, particularly those focused on building innovative financial solutions. Through countless hours of research and learning, Sebastian developed a deep understanding of the underlying technologies, market dynamics, and potential applications of cryptocurrencies. As his knowledge grew, Sebastian felt compelled to share his insights with others. He began actively contributing to online discussions on platforms like X and LinkedIn, focusing on fintech and crypto-related content. His goal was to expose valuable trends and insights to a wider audience, fostering a deeper understanding of the rapidly evolving crypto landscape. Sebastian's contributions quickly gained recognition, and he became a trusted voice in the online crypto community. To further enhance his expertise, Sebastian pursued a UC Berkeley Fintech: Frameworks, Applications, and Strategies certification. This rigorous program equipped him with valuable skills and knowledge regarding Financial Technology, bridging the gap between traditional finance (TradFi) and decentralized finance (DeFi). The certification deepened his understanding of the broader financial landscape and its intersection with blockchain technology. Sebastian's passion for finance and writing is evident in his work. He enjoys delving into financial research, analyzing market trends, and exploring the latest developments in the crypto space. In his spare time, Sebastian can often be found immersed in charts, studying 10-K forms, or engaging in thought-provoking discussions about the future of finance. Sebastian's journey as a crypto analyst and investor has been marked by a relentless pursuit of knowledge and a dedication to sharing his insights. His ability to navigate the complex world of crypto, combined with his passion for financial research and communication, makes him a valuable asset to the industry. As the crypto landscape continues to evolve, Sebastian remains at the forefront, providing valuable insights and contributing to the growth of this revolutionary technology.

Leituras Relacionadas

Bitcoin at 59,000 Is Not the Bottom, One Last Drop Needed! Chain Data and Liquidity Analysis: Where is BTC's True Bottom?

Based on analysis by trader Mr. Beggar, Bitcoin's (BTC) recent low of $59k is likely not the final cycle bottom. He argues that while a bottom is near, a final downward movement is still probable to target liquidity below that level, making a deeper low healthier for a sustainable reversal. Mr. Beggar's framework combines on-chain data for long-term cycles and liquidity-based technical analysis for shorter-term trades. His "four deep bear buying models" include Cointime Price (market cost weighted by coin holding time) and AVIV (an enhanced MVRV indicator), which currently suggest prices are nearing cyclical bottom zones. While a PSIP (Percent Supply in Profit) signal has flashed below 50%, it alone is not considered definitive; typically, the first signal is not the final bottom. He presents three potential scenarios for the current market: 1) a direct drop from here, 2) an upward liquidity sweep (stop hunt) of the recent high near $67.3k before declining, and 3) a direct reversal without new lows. He heavily discounts the third scenario due to significant un-swept liquidity in the $59k-$62.3k range, suggesting the market must revisit these levels. Mr. Beggar shares that he used on-chain signals to identify potential cycle tops in late 2024/early 2025 and later established low-leverage BTC-denominated short positions. He emphasizes the importance of risk management and staying within one's expertise ("strike zone"), warning against investing in assets like AI/semiconductor stocks simply because they are rising.

marsbitHá 27m

Bitcoin at 59,000 Is Not the Bottom, One Last Drop Needed! Chain Data and Liquidity Analysis: Where is BTC's True Bottom?

marsbitHá 27m

From Signal Monitoring to Strategy Copy Trading: How PPP Lowers the Barrier to Trading on Polymarket?

From Signal Monitoring to Strategy Copy Trading: How PPP Lowers the Barrier to Polymarket Trading The surge in trading demand on prediction markets like Polymarket, especially during events like the World Cup, exposes a common challenge for novice users: emotional and impulsive trading due to a lack of stable strategies and reliable signals. Prediction Position Platform (PPP) addresses this by serving as a Telegram-based tool for strategy discovery and automated copy-trading on Polymarket. PPP offers a suite of features through a subscription model. Key functionalities include 24/7 market signal monitoring (tracking smart money movements and rapid probability shifts), an "AI Address Analysis" tool to evaluate trader performance metrics, and specialized sections like a "World Cup Zone" for quick access to related markets. Its core value lies in two curated lists: the "Strategy Square," which identifies addresses suitable for long-term tracking based on comprehensive metrics like returns, win rate, and drawdowns, and the "Trading Leaderboard," highlighting recently outperforming addresses for short-term opportunities. Users can manually analyze any address or set up automated copy-trading with customizable parameters like investment amount and stop-loss. After initiating copy-trades, users can manage all positions from a unified dashboard, adjusting parameters or stopping follows as needed, and review historical performance data. Crucially, PPP employs a non-custodial wallet model, meaning user funds remain in their own self-custodied wallets, enhancing security and trust. In summary, PPP aims to reduce the learning curve and trial-and-error cost for Polymarket users by aggregating signals, curating and analyzing profitable traders, and facilitating automated, yet manageable, copy-trading execution.

Odaily星球日报Há 27m

From Signal Monitoring to Strategy Copy Trading: How PPP Lowers the Barrier to Trading on Polymarket?

Odaily星球日报Há 27m

From the White-Haired Stock God to the Billion-Dollar Fund Titan: The Smart People Shorting NVIDIA Are Getting Rich Using the Same Framework

From "white-haired stock god" to billionaire fund manager, those profiting from shorting NVIDIA share a common framework. The article analyzes the critical bottlenecks in the AI hardware supply chain, which have become key investment focal points. The core argument is that the real constraint on the AI boom isn't software or algorithms, but fundamental physical infrastructure. The piece dissects nine major bottlenecks, organized around the lifecycle of an AI accelerator circuit board. *Before the Board*: The pre-manufacturing stage faces constraints in EDA tools, new materials (like GaN, SiC, InP) replacing silicon, and the critical, non-renewable supply of helium for semiconductor fabrication. *On the Board*: The primary bottlenecks are High-Bandwidth Memory (HBM), essential for unleashing GPU power, and advanced packaging (e.g., CoWoS), required to integrate components. Both are in severe shortage. *Between Boards*: Chip-to-chip communication is hitting limits with copper, pushing photonics and optical interconnects (CPO) as the next-gen solution, with NVIDIA heavily investing in this area. *Around the Board*: Power delivery requires new materials (GaN/SiC) for efficient voltage conversion from 48V to sub-1V. High-density AI racks (120kW+) are forcing a shift from air to liquid cooling as the standard. *Beyond the Board*: The ultimate bottleneck is electricity. AI data centers consume power equivalent to mid-sized cities, and grid expansion lags far behind demand, causing project delays and a scramble for power contracts. Prominent investors like Leopold and "white-haired stock god" are heavily betting on these infrastructure bottlenecks. Leopold's fund, for instance, holds no NVIDIA stock but uses massive put options to short the semiconductor sector while going long on power and physical infrastructure. His thesis is that while chip competition may eventually erode margins, the scarcity of foundational elements like electricity is more persistent. The framework's validity is tied to the supply-demand gap. Major new capacity in HBM and photonics is scheduled for 2027-2028, but demand continues to outpace it. Experts like Intel's CEO suggest no relief before 2028. However, the article warns of a potential reversal around 2028-2029 if AI capex slows and new capacity floods the market, turning scarcity into oversupply. Until then, the imbalance persists.

链捕手Há 58m

From the White-Haired Stock God to the Billion-Dollar Fund Titan: The Smart People Shorting NVIDIA Are Getting Rich Using the Same Framework

链捕手Há 58m

Trading

Spot
Futuros
活动图片