Dogecoin Price Retests 100 SMA Again – Here’s What It Means For Price

bitcoinistPublicado em 2025-06-23Última atualização em 2025-06-23

Resumo

After a turbulent price action over the weekend that saw Dogecoin briefly dip below $0.15, the meme-inspired cryptocurrency is now...

Trusted Editorial content, reviewed by leading industry experts and seasoned editors. Ad Disclosure

After a turbulent price action over the weekend that saw Dogecoin briefly dip below $0.15, the meme-inspired cryptocurrency is now back again to testing an important technical level. Particularly, DOGE is now revisiting the 100-week Simple Moving Average (SMA), which has served as a strong support line for more than a year on the weekly candlestick timeframe, raising questions about what might unfold next for its price movement.

Dogecoin Revisits Familiar Support Line

Dogecoin’s recent extended price decline saw it break below $0.15 very briefly in the past 24 hours. Notably, Dogecoin slipped below $0.16 on Saturday for the first time since April, extending a downtrend that’s seen its price fall about 36% in the past 30 days. Over the weekend, DOGE’s price dropped to around $0.143 before rebounding to approximately $0.153 behind heavy trading volume of over five times the recent daily average. 

Interestingly, this downward price action has seen DOGE now retesting a technical indicator that has had an important hand in its price action over the past year. This phenomenon was first noted on the social media platform X by crypto analyst Trader Tardigrade.
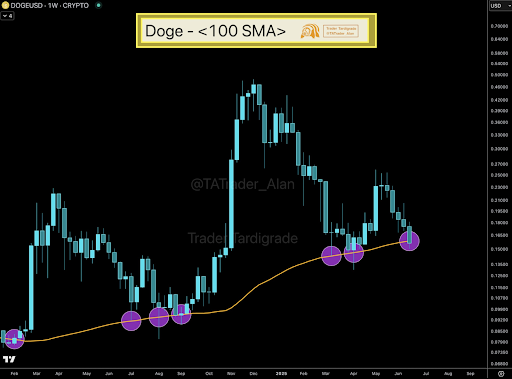
Dogecoin
Source: Trader Tardigrade on X

The chart shared by the crypto analyst on X captures an important pattern. DOGE’s weekly candles have repeatedly bounced off the 100 SMA over the past year, which has made it a vital technical floor for the meme coin. Each time Dogecoin’s price approached or dipped slightly below this moving average, it quickly recovered and went on uptrends.

Dogecoin’s brief plunge to around $0.143, its lowest point since early April, before rebounding above $0.15, has now placed interest with the 100 SMA, which could serve as a launchpad once again if bullish sentiment seeps in.

DOGE Price Zones To Watch

Right now, the important thing is whether Dogecoin can maintain its footing above the $0.145 to $0.151 support zone. The quick rebound following the weekend’s drop below $0.15 shows that buyers are still stepping in at this level. However, any signs of weakness could invalidate the bullish outlook of a bounce off the 100 SMA.

On the upside, reclaiming the $0.153 to $0.16 resistance range with volume confirmation would lend credibility to the idea that Dogecoin is ready for another rally from the 100 SMA. If that happens, price history shows Dogecoin could mirror previous reactions off this moving average and set up a rebound to a resistance level between $0.19 and $0.21. If the current retest leads to another successful bounce, a projection of the most recent bounce shows a move to at least $0.3 could be next.

At the time of writing, Dogecoin is trading at $0.1547, down by 2% in the past 24 hours.

Dogecoin
DOGE trading at $0.15 on the 1D chart | Source: DOGEUSDT on Tradingview.com
Featured image from Getty Images, chart from Tradingview.com
Editorial Process for bitcoinist is centered on delivering thoroughly researched, accurate, and unbiased content. We uphold strict sourcing standards, and each page undergoes diligent review by our team of top technology experts and seasoned editors. This process ensures the integrity, relevance, and value of our content for our readers.

Scott Matherson is a leading crypto writer at Bitcoinist, who possesses a sharp analytical mind and a deep understanding of the digital currency landscape. Scott has earned a reputation for delivering thought-provoking and well-researched articles that resonate with both newcomers and seasoned crypto enthusiasts. Outside of his writing, Scott is passionate about promoting crypto literacy and often works to educate the public on the potential of blockchain.

Leituras Relacionadas

Collateral Dollars: How Does a 'Second-Layer Dollar' Above Stablecoins Form?

Collateral Dollars: How Does a "Second Layer of Dollars" Form on Top of Stablecoins? Most assume stablecoins replicate Eurodollar functions, expanding the offshore dollar system. However, stablecoins primarily replace specific functions like operational dollar balances for settlement. They do not inherently create new dollar credit; they substitute existing claims. The key question is: what happens when financial intermediaries use stablecoins as collateral to create a new layer of dollar-denominated claims? This "collateral dollar" channel operates through secured lending, not direct money creation. A money-like event only occurs when a liability issued against the controlled stablecoin is funded, rolled over, or accepted at near-par value by another balance sheet. The discount (haircut) prices the gap between "effective control over the token" and "reliable convertibility to bank dollars." Elasticity stems not from the stablecoin itself but from the liability issued against it and the willingness of third-party balance sheets to treat that liability as a near-par asset. Compared to the traditional Eurodollar system—where elasticity originates from bank deposit creation—the stablecoin collateral chain is structurally different. Eurodollar deposits are credit-expansive from inception. Stablecoins are initially substitutive; elasticity emerges later if an intermediary's liability against them gains monetary acceptance. Stablecoins disrupt specific tiers of the offshore dollar system, mainly replacing operational settlement balances. They do not replace the need for full dollar balance-sheet capacity (credit lines, hedging, maturity transformation). For systemic impact, the second-layer liability must pass three tests: transferability, funding capacity, and monetary acceptance (being fundable or held at par by others). Pressure transmission also differs. In the Eurodollar system, stress moves up a hierarchy of claims. In a stablecoin collateral chain, the second-layer liability can lose its money-like status well before the underlying stablecoin faces a run, often triggered by haircut increases and margin calls that create a dynamic spiral of falling token prices and rising discounts. In conclusion, the "collateral dollar" is not the stablecoin itself. It is the second-layer liability issued against a controlled token balance that is willing to be funded and maintained at near-par value. Its existence depends on that liability surviving the leap from "token liquidity" to "bank dollar liquidity."

marsbitHá 2m

Collateral Dollars: How Does a 'Second-Layer Dollar' Above Stablecoins Form?

marsbitHá 2m

Collateral Dollars: How the 'Second-Layer Dollar' Above Stablecoins Takes Shape?

"Collateralized Dollars: How a 'Second Layer of Dollars' Forms on Top of Stablecoins" Most assume stablecoins replicate Eurodollars and expand the offshore dollar system, but this is not accurate. Stablecoins primarily replace certain functions within the existing system, especially operational dollar balances for daily settlement. The critical question is what happens when financial intermediaries create a new layer of dollar claims *on top of* stablecoins. This article explains how this new collateralized funding channel works. Stablecoins introduce tokenized private dollar claims. Even if issuers and reserves are within the US legal perimeter, their circulation and use as collateral can become economically "offshore." Enforceable control over collateral opens a secured credit channel but does not itself create a monetary claim. A true monetary event occurs only when another balance sheet funds, rolls over, or accepts a liability issued against the controlled token at near-par value. The discount prices the gap between "effective control over the token" and "reliable convertibility into bank dollars." Elasticity comes from the balance sheet issuing the liability against the token and from third-party willingness to treat that liability as a near-par asset. Collateralized Dollars are not the stablecoins themselves; they are the second-layer liability that another balance sheet is willing to issue, fund, and maintain at near-par against a controlled token balance. The Eurodollar system is a hierarchy of claims, with elasticity originating in expandable bank liabilities. In contrast, the stablecoin collateral chain starts with a tokenized asset. It gains systemic significance only when an intermediary's liability against that token is treated as money-like by other balance sheets. Key determining factors include: who has effective control, the legal/operational path to bank dollars, and whether the resulting claim can still be financed near-par under stress. Pressure in this new channel manifests differently. The upper-layer (intermediary) claim fails first, losing its money-like status, potentially while the underlying stablecoin remains solvent. Increased haircuts and forced sales can create a destructive feedback loop, widening the very gap the discount measures. In conclusion, the Eurodollar analogy has limits. Reserve quality supports the underlying token's solvency, but the leverage, credit, and liabilities built atop it face a separate test. Collateral eligibility is not monetary acceptance. Only when a claim built on stablecoins survives the leap from "token liquidity" to "bank dollar liquidity" do Collateralized Dollars truly exist.

链捕手Há 8m

Collateral Dollars: How the 'Second-Layer Dollar' Above Stablecoins Takes Shape?

链捕手Há 8m

Don't Be Misled by the $1.25 Billion Cap: MicroStrategy's Three-Pronged Bitcoin Sale Pools Hide Massive Selling Pressure

Don't Be Misled by the $1.25B Cap: Strategy's Three-Tier Bitcoin Sales Plan Hides Massive Potential Selling Pressure Strategy recently sold 3,588 BTC (~$216M) to fund a dividend and replenish its dollar reserve, while claiming its $1.25B "reserve build" capacity remains fully available. This highlights a key nuance: the widely cited $1.25B limit applies only to sales for "Building" the reserve. Strategy's broader capital framework, however, allows Bitcoin sales for three primary purposes, each with different scales: 1. **Building the Reserve:** Selling BTC to raise up to $1.25B for the reserve. 2. **Covering Priority Share Expenses:** Selling BTC to pay dividends/interest or to replenish the reserve after such payments are made from it (no specified limit). 3. **Share Repurchase Funding:** Selling BTC to fund up to $1B each in convertible note and common stock repurchases (totaling $2B potential). Combined, just the capped "Build" and "Repurchase" channels could facilitate over $3B in Bitcoin sales, excluding the uncapped "Cover Expenses" channel. The accounting distinction between "Building" (adding cash before a payout) and "Replenishing" (adding cash after a payout) is operationally blurry but allows sales like the recent $216M transaction without touching the $1.25B "Build" quota. This gives Strategy significant flexibility. The move signifies a strategic shift: Strategy is transforming from a simple Bitcoin accumulator into an active capital manager, akin to a hedge fund. Bitcoin is now a financial lever to balance pressures between common stock, convertible notes, dollar reserves, and Bitcoin holdings. This creates inherent tensions—actions benefiting one part of the capital structure may harm another. Investors must understand that the potential Bitcoin sales are far greater than the surface-level $1.25B figure. Strategy has become a complex financial entity where every term in its disclosures matters. Betting on it now is a wager on its active capital management skill to navigate these internal contradictions without a systemic failure.

Foresight NewsHá 15m

Don't Be Misled by the $1.25 Billion Cap: MicroStrategy's Three-Pronged Bitcoin Sale Pools Hide Massive Selling Pressure

Foresight NewsHá 15m

When the Largest BTC Buyer Becomes a Seller, Who's Buying After MicroStrategy Sells 3,588 Bitcoin?

MicroStrategy, once the largest corporate buyer of Bitcoin, sold 3,588 BTC for approximately $216 million to fund its preferred stock dividends, marking a significant shift from buyer to seller. This move occurred after its market-to-NAV premium vanished, breaking its "print stock to buy Bitcoin" financial model. A roundtable discussion featuring Austin Campbell, Ram Ahluwalia, and Chris Perkins analyzed the implications. They noted that MicroStrategy's dominance has become a narrative bottleneck for the broader crypto market, with some speculating that Bitcoin's price might only surge significantly after the company's influence wanes. The conversation expanded to examine the capital structure conflict between traditional equity and crypto tokens, arguing that most current tokens will fail as they don't fit neatly into existing debt/equity frameworks. A "stablecoin war" was identified as a major trend, with entities like Tether, Robinhood, and the OUSD alliance competing. Tether's decision to abandon the European MiCA market highlights strategic divergences. The panelists argued that bank-issued stablecoins could revolutionize global finance by allowing US banks to capture net interest margins from international transactions, potentially making JPMorgan the first trillion-dollar bank. They concluded that while capital is currently being siphoned by AI/semiconductors, markets will eventually refocus on fundamentals and cash flow, which could benefit cryptocurrencies with real utility.

marsbitHá 21m

When the Largest BTC Buyer Becomes a Seller, Who's Buying After MicroStrategy Sells 3,588 Bitcoin?

marsbitHá 21m

Bitcoin’s path to $80K may hinge on THIS hidden trend

Bitcoin's potential path toward $80,000 is influenced by conflicting market signals. Data shows the Coinbase Bitcoin Premium Index has recorded its longest-ever streak of consecutive negative premiums, indicating muted institutional demand or net selling from U.S. institutions. While such a trend often signals short-term weakness, it doesn't necessarily forecast a long-term bear market. Additionally, a bearish crossover occurred in Bitcoin's Net Unrealized Profit/Loss (NUPL), with its short-term average falling below the longer-term average, suggesting declining investor profitability and waning market momentum. Historically, major bear market bottoms saw the 100-day NUPL drop below zero, but this cycle it remains positive, implying either an unprecedented bottom or a further decline is needed. Currently trading around $63,148, Bitcoin has seen weekly gains but remains below its May peak. Technical indicators present a mixed picture: the MACD shows bullish momentum, while the RSI signals bearish pressure. A positive development is the return of inflows to Bitcoin ETFs after eight weeks of outflows. Analysts hold divergent views; some highlight a key liquidity zone between $48,000-$50,000 where a market bottom could form, while others maintain a more optimistic long-term outlook. Ultimately, while some bullish signs exist, a strong push from institutional investors appears crucial for Bitcoin to challenge the $80,000 level.

ambcryptoHá 1h

Bitcoin’s path to $80K may hinge on THIS hidden trend

ambcryptoHá 1h

Trading

Spot
活动图片