Seasoned Holders Taking Profit

insights.glassnodePublicado em 2025-06-04Última atualização em 2025-06-19

Bitcoin hit a new ATH of $111.8k before retracing, as profit-taking by long-term holders began to weigh on momentum. With key support at $103.7k and $95.6k, and signs of older investors offloading, the bulls now face a critical test of their resolve.

Executive Summary

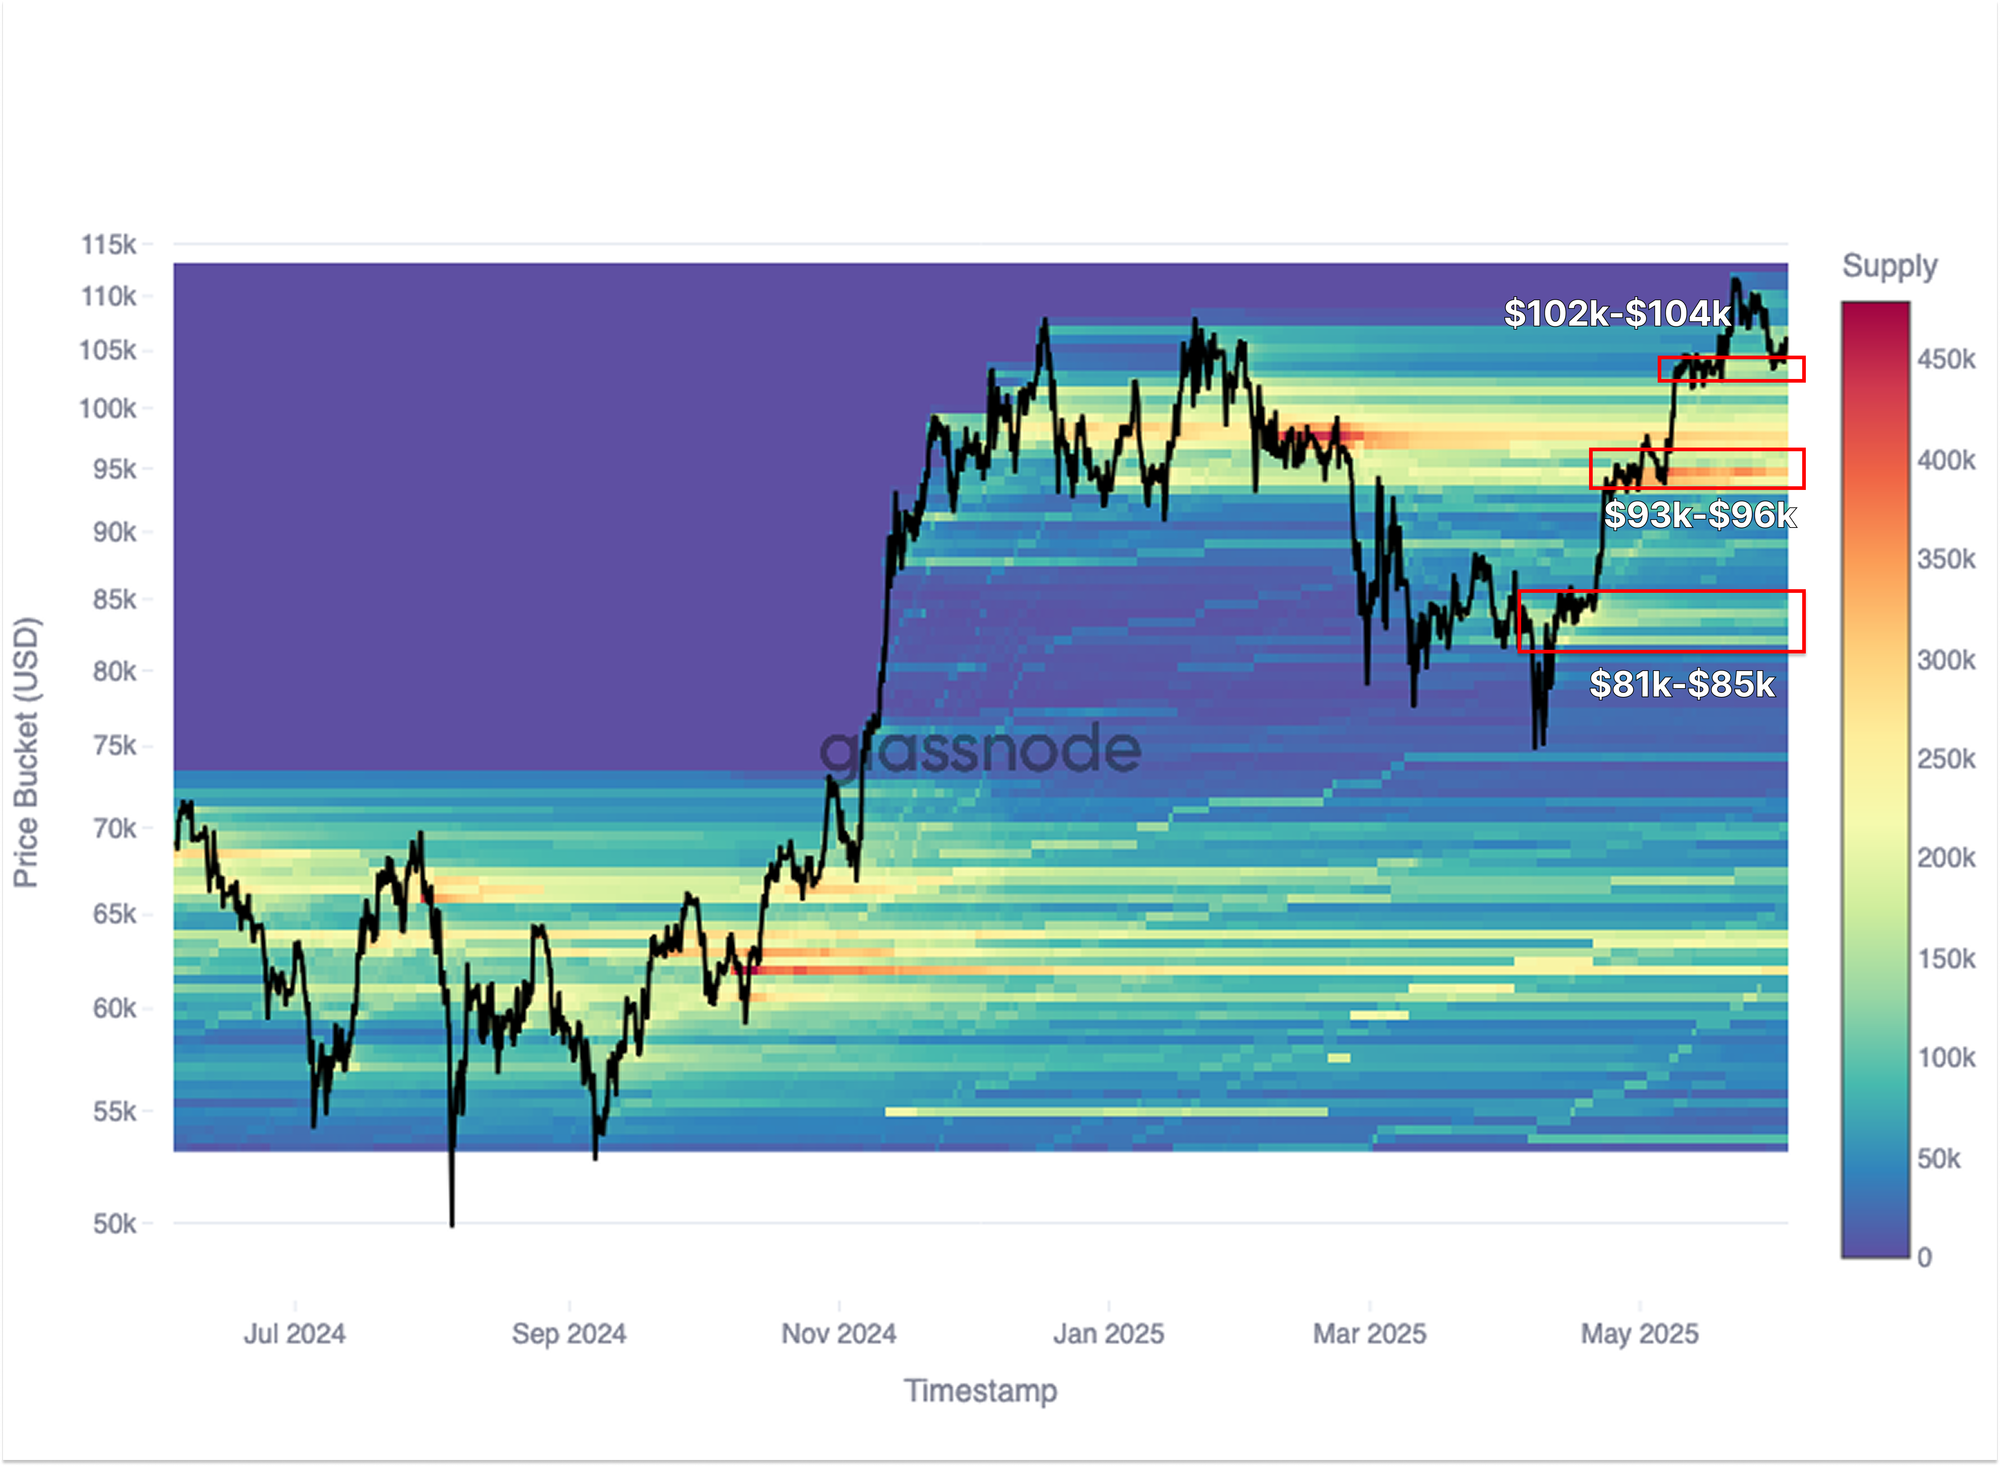
  • BTC reached a new all-time high at $111.8k, but quickly retraced to $103.2k. The initial rally appears to be spot-driven, with major accumulation zones at $81–85k, $93–96k, and $102–104k now acting as potential support.
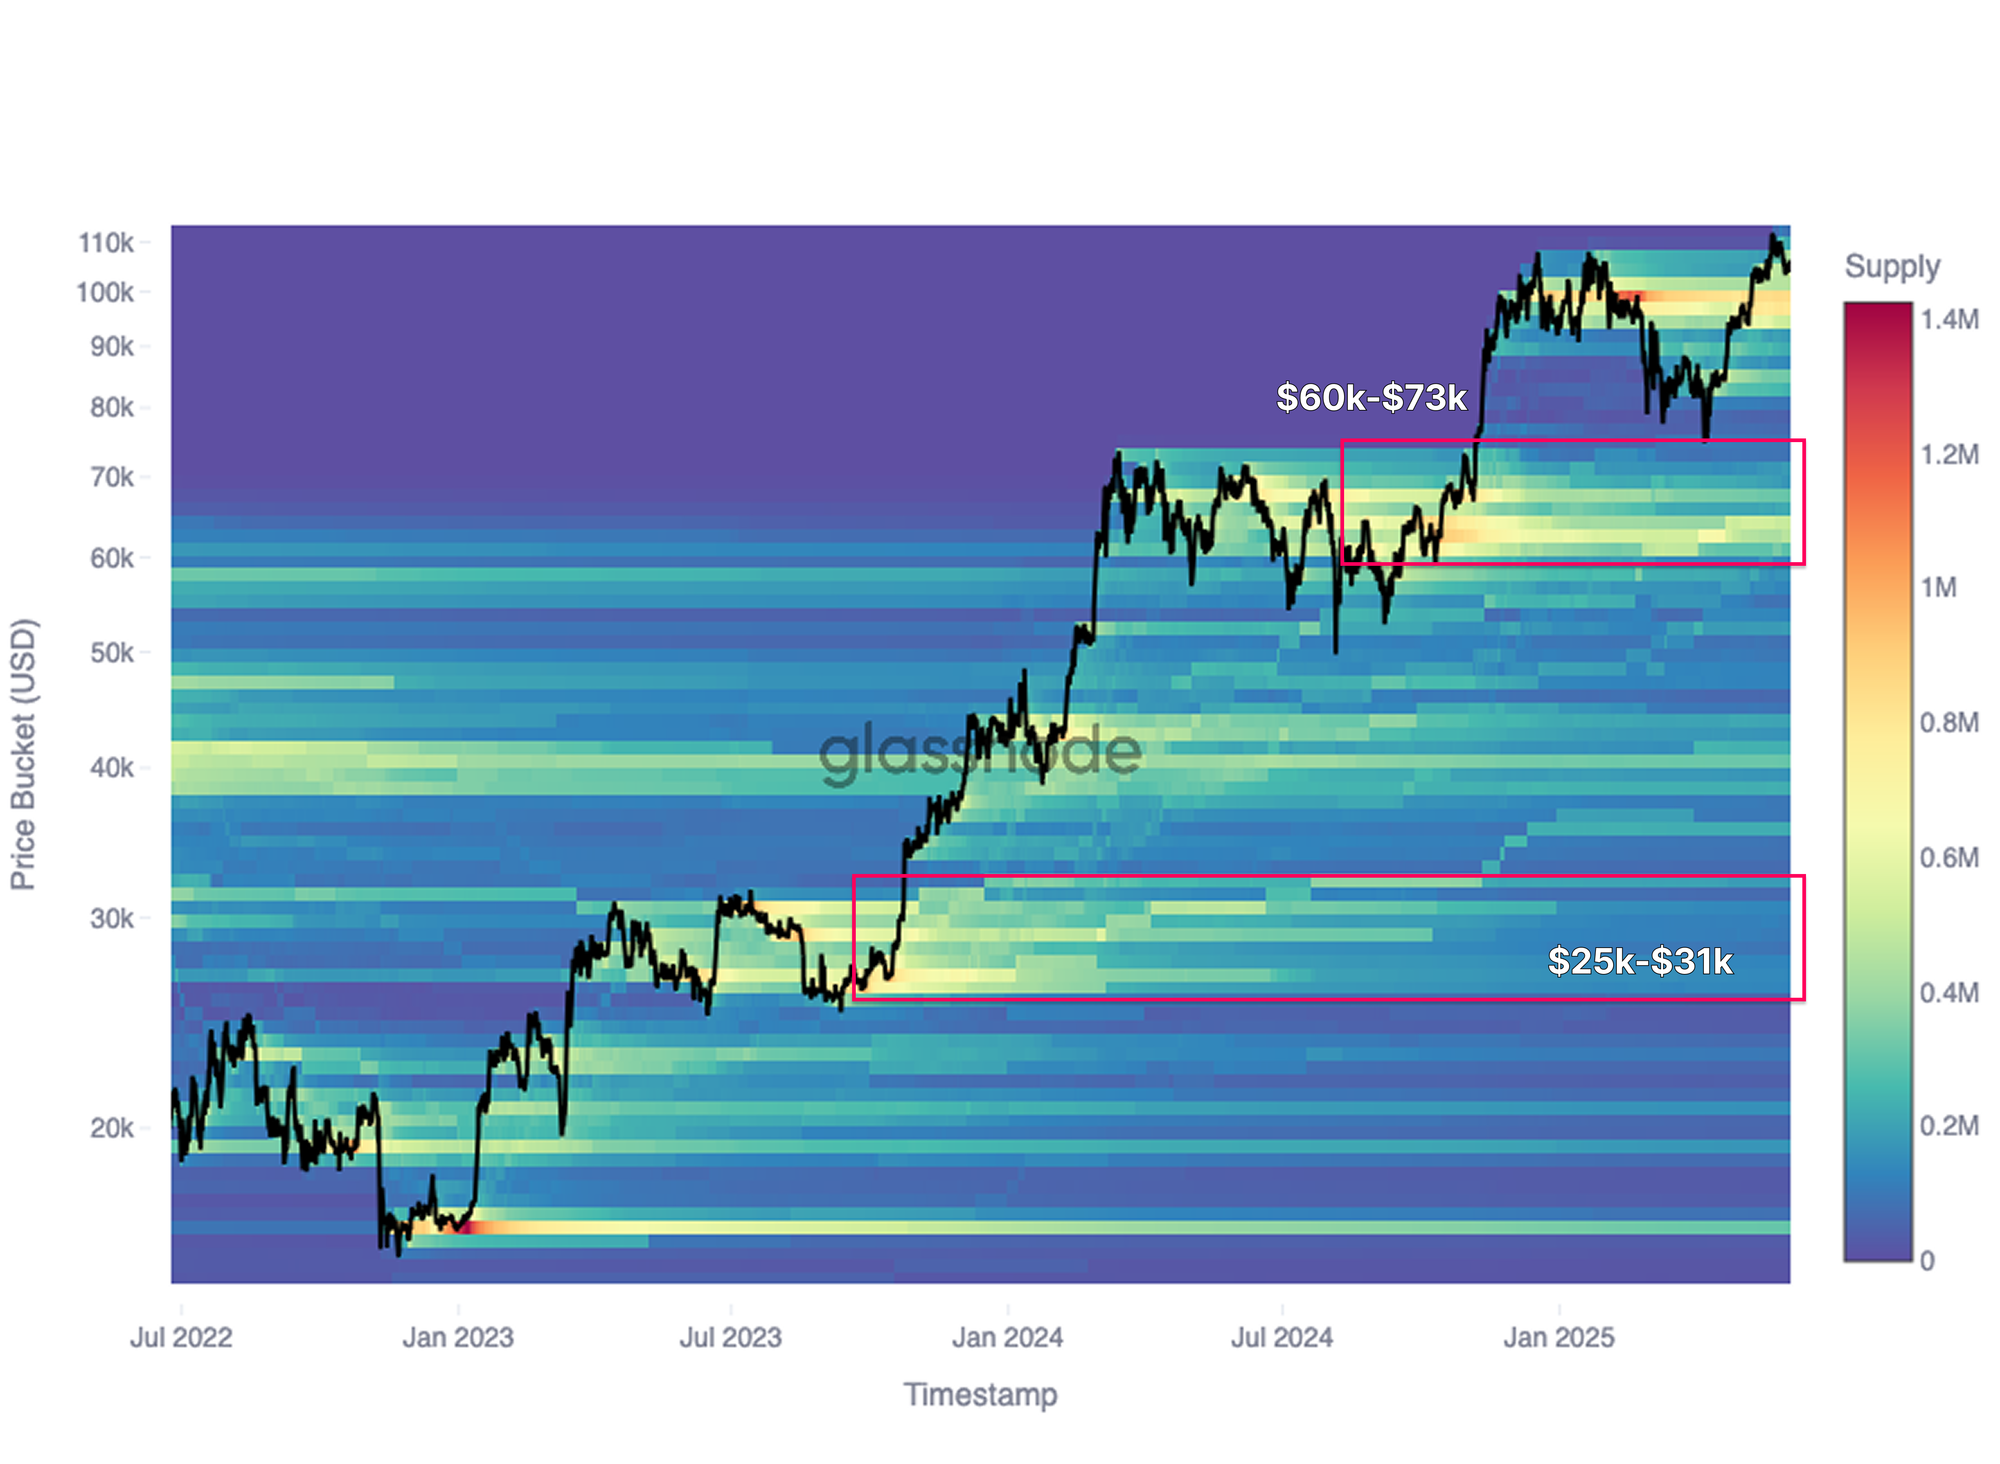
  • Zooming out with the CBD Heatmap, many historical accumulation zones flipped into distribution zones. Sellers from $25k–31k, $38k–44k, and $60k–73k ranges are now weighing on price action.
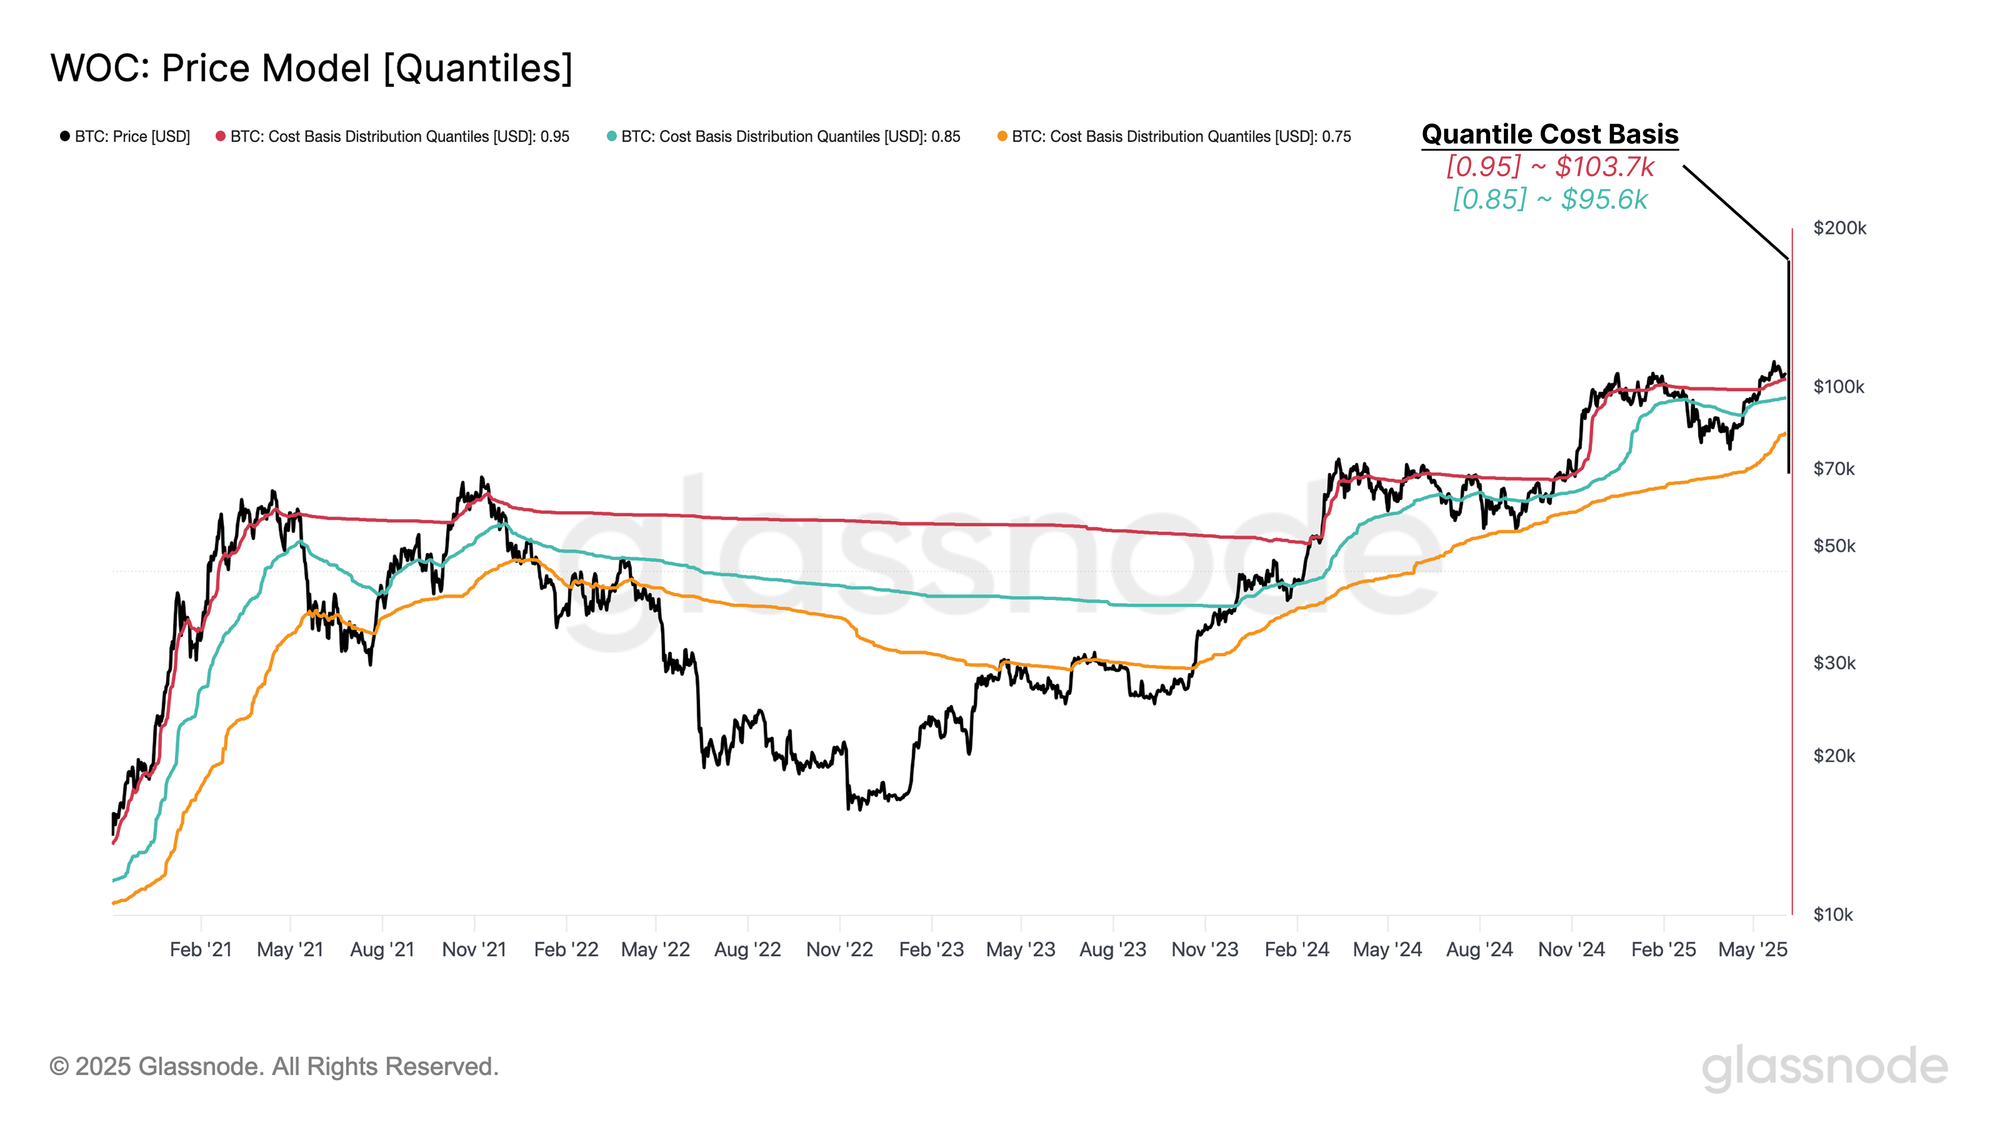
  • Cost basis quantiles and short-term holder bands place immediate support near $103.7k and $95.6k, with resistance at $114.8k. These levels are statistically significant markers of broader sentiment shifts.
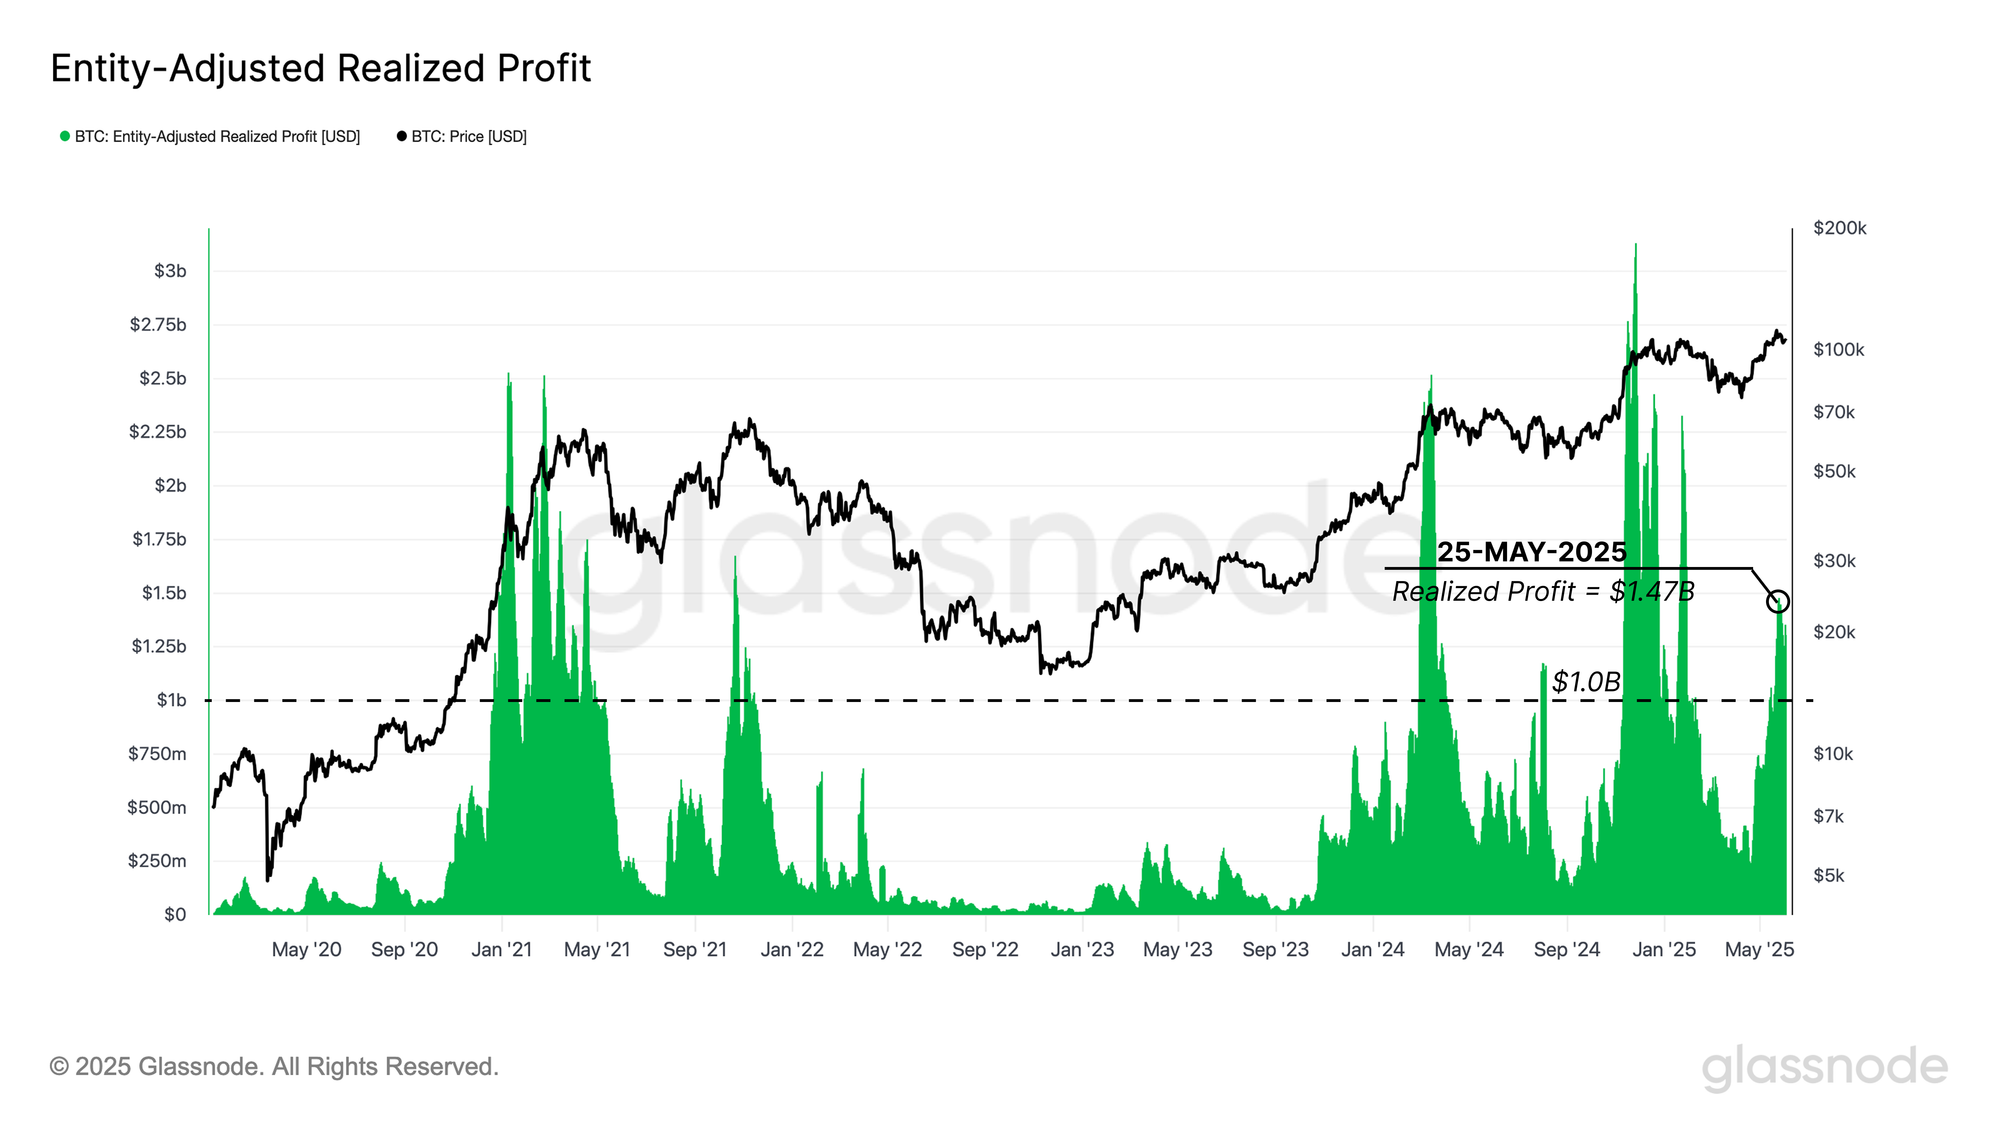
  • Realized profits spiked to $1.47B/day, marking the fifth major profit-taking wave in this cycle. Selling was led by long-term holders, not short-term traders.
  • Cohorts holding for >12 months dominated the recent realized profits, reflecting mature capital rotation. This aligns with earlier observations from the CBD Heatmap, confirming that seasoned investors are shaping the current top formation phase.
💡
View all charts in this edition in The Week On-chain Dashboard.

Mapping the Rungs of the Rally

Over the past two weeks, Bitcoin extended its rally to a new high of $111.8k, briefly surpassing the previous ATH set in January 2025. However, this move was followed by a correction to $103.2k, signalling a potential pause in bullish momentum.

To understand the anatomy of this rally, we turn to the Cumulative Volume Delta (CBD) Heatmap, a tool that tracks the net difference between aggressive buying and selling across price levels. Visually, it reveals zones of concentrated spot-driven accumulation or distribution, helping pinpoint where demand was strongest.

From the heatmap, it's evident this rally was largely spot-led and stair-stepped higher, with clear accumulation clusters at $81–85k, $93–96k, and $102–104k. These zones now potentially can serve as supply-dense regions that may act as short-term support, depending on broader market sentiment.

Notably, top buyers from Q1 2025, who held through the drawdown below $80k, are once again being tested as price churns sideways. This edition will examine the fading momentum behind recent demand, the forces draining market strength, and where potential support may emerge if weakness continues.
Live Dashboard

Old Hands Sell Pressure

To understand the forces driving Bitcoin’s recent move beyond $111k, we need to take a broader view of the market structure. By examining the CBD Heatmap from the June 2022 cycle bottom onward, a clear pattern of distribution by past accumulators begins to emerge.

As the price marched upward, the supply-dense zones that previously acted as bases of accumulation, often marked by sideways consolidation, have now turned into active selling zones. Visually, the heatmap reveals a gradual shift; areas that once supported the rally have flipped into sources of resistance, as earlier holders take the opportunity to offload.

The most notable selling pressure has come from cohorts who accumulated during key historical ranges: $25k–31k and $60k–73k. These groups, many of whom held through multiple volatility phases, are now contributing to the supply overhang that appears to be capping further upside, at least in the short term.
Live Dashboard

With long-term holders gradually applying sell pressure, the probability of a short-term correction continues to build, particularly in the absence of a strong upside catalyst to push Bitcoin decisively above $111.8k. In such phases, where bullish momentum stalls, on-chain pricing models become essential tools for identifying likely support levels during pullbacks.

One particularly effective framework is the Spent Supply Distribution (SSD) Quantiles. This metric analyzes the cost basis of coins being spent at a given time, dividing them into 100 percentiles. It provides a high-resolution view of where supply originally entered the market, enabling us to pinpoint zones with elevated turnover, likely driven by profit-taking or loss realization.

Here, we focus on three key quantiles:

  • 🔴 0.95 (top 5% of spent supply)
  • 🔵 0.85 (top 15%)
  • 🟠 0.75 (top 25%)

Historical patterns over the past five years suggest that absolute euphoria tends to occur when price trades above the 0.95 quantile, while sideways bull phases often unfold between 0.85 and 0.95. On the other hand, sustained trading below the 0.75 quantile has typically marked bearish or risk-off periods.

At present, the 0.95 quantile sits at ~$103.7k, acting as the first on-chain support zone. Should selling pressure persist, the next level to watch is the 0.85 quantile at $95.6k, which may provide structural support, or, if breached, confirm a broader risk reset.
Live Chart

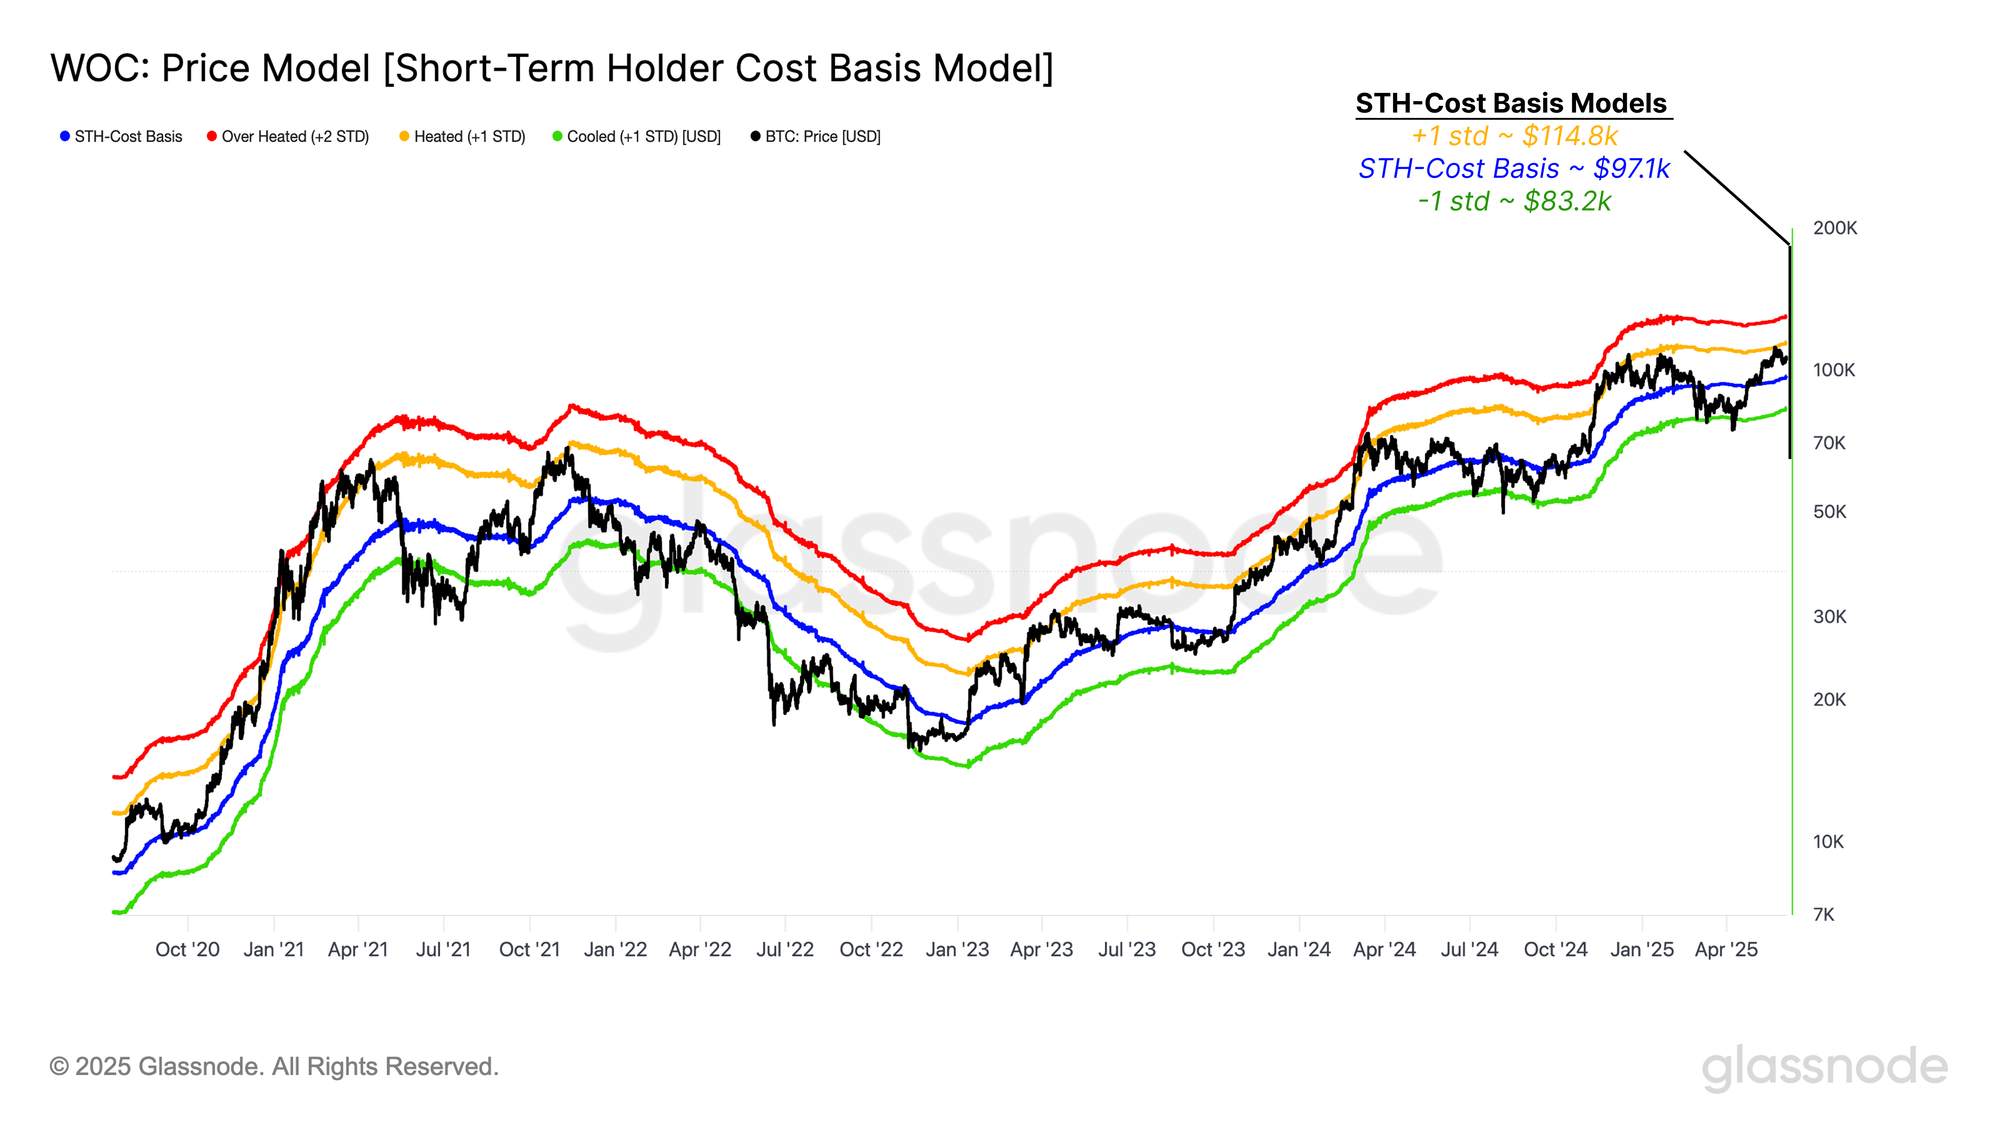
With a substantial portion of Bitcoin's supply changing hands over the past six months, driven by two separate pushes to new all-time highs, it becomes increasingly important to track recent investor behaviour. One of the most insightful models for this is the Short-Term Holder (STH) Cost Basis, which captures the average acquisition price of coins held for less than 155 days.

To add statistical context, we apply standard deviation bands around this cost basis to define key support and resistance zones. These bands help quantify the range of market consensus among short-term participants and can signal trend exhaustion or breakout thresholds.

Currently, the STH cost basis sits at $97.1k, representing the average entry price for recent buyers. The +1 standard deviation band, often associated with overbought or bullish breakout conditions, lies at $114.8k, while the -1 standard deviation band at $83.2k marks a level of elevated downside risk.

These three levels, $114.8k, $97.1k, and $83.2k, now define the statistical boundaries of short-term sentiment. A break above or below these thresholds will likely shape the next leg of market direction, signalling whether momentum is returning or fading.
Live Chart

A High Profit Realization

As Bitcoin retreats from its recent $111.8k high, much of the selling pressure appears to stem from intra-cycle seasoned holders, those who accumulated earlier in the rally and are now realizing substantial gains. In this phase, the profit realization regime is a key concept for evaluating the risk of demand exhaustion.

Using the 7-day SMA of daily profit realization, adjusted to exclude intra-entity flows, we see that realized profits peaked at $1.47B per day last week. This is a notable level, highlighting the intensity of recent capital rotation.

More importantly, this marks the fifth wave in this cycle where daily profit-taking has surpassed the $1B threshold. Such events often coincide with local market tops or slowdowns, especially if incoming demand cannot absorb the scale of realized gains. This puts a spotlight on the market’s resilience in the face of elevated selling pressure.
Live Chart

A Dynamic Shift

To better understand the significance of the current elevated wave of profit realization, it helps to view it through a cyclical lens. Not all profit-taking events are created equal, and the dynamic nature of these regimes can reveal how market maturity and volatility shape investor behaviour over time.

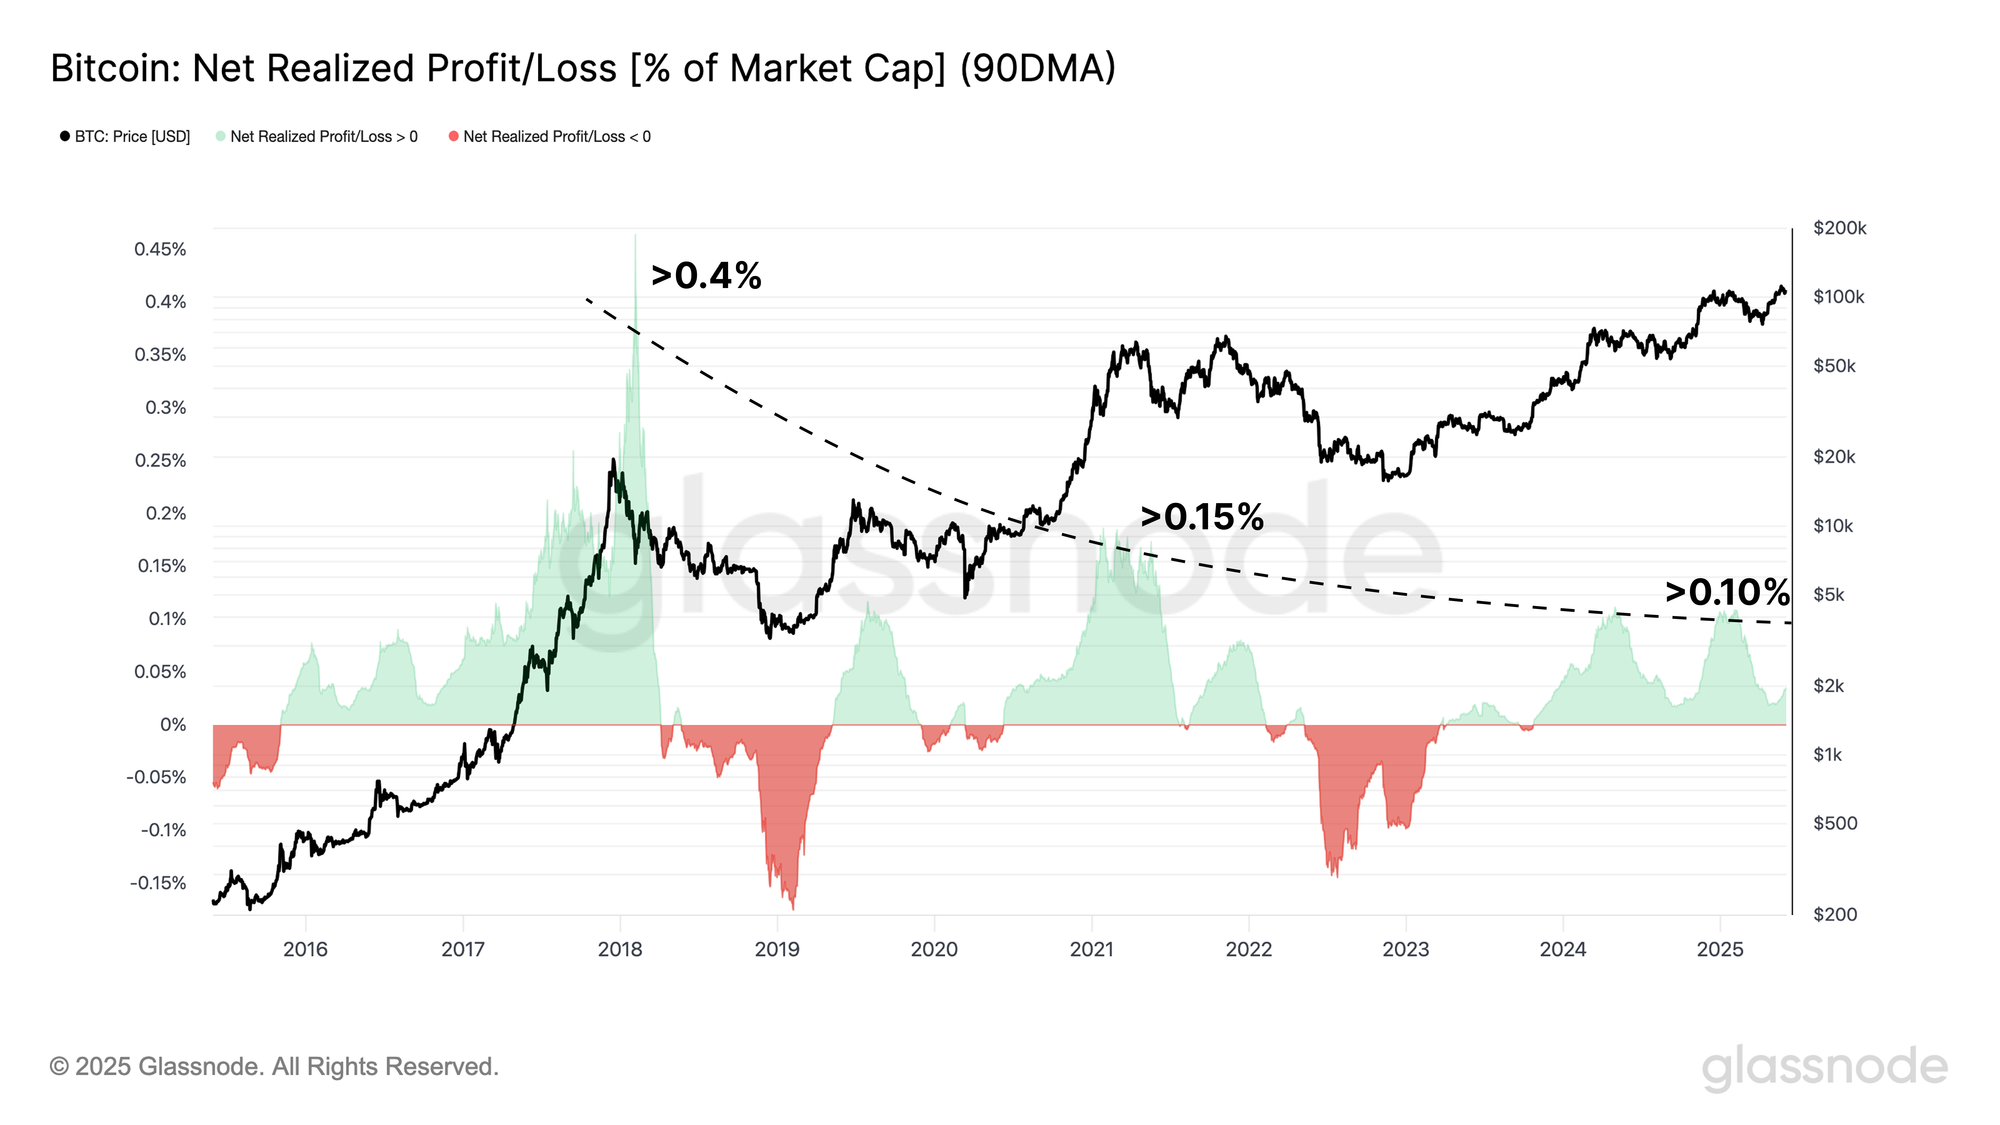
One effective approach is to examine the 90-day SMA of net realized profit, normalized by market cap. This adjustment allows us to compare profit-taking intensity across cycles on an apples-to-apples basis. A clear trend emerges: profit-taking has grown less euphoric over time, reflecting the broader degradation in cyclical upside performance and lower volatility profiles as the market matures.

  • From November 2015 to April 2018, the net profit-taking regime lasted ~25 months, peaking above 0.4% of market cap.
  • In the 2020–2022 cycle, this region persisted for ~20 months, but only peaked at around 0.15%.
  • In the current cycle, beginning November 2023, the net profit-taking phase has stretched across 18 months, forming two distinct peaks near 0.1%..

This trend suggests that while profit-taking still exerts significant pressure, it has become more tempered, possibly signalling a shift from boom-bust euphoria to structured capital rotation in a more mature asset class.
Live Chart

Who Is Realizing Profit?

Another useful lens for evaluating profit-taking cycles is to identify which investor cohorts are behind the selling.

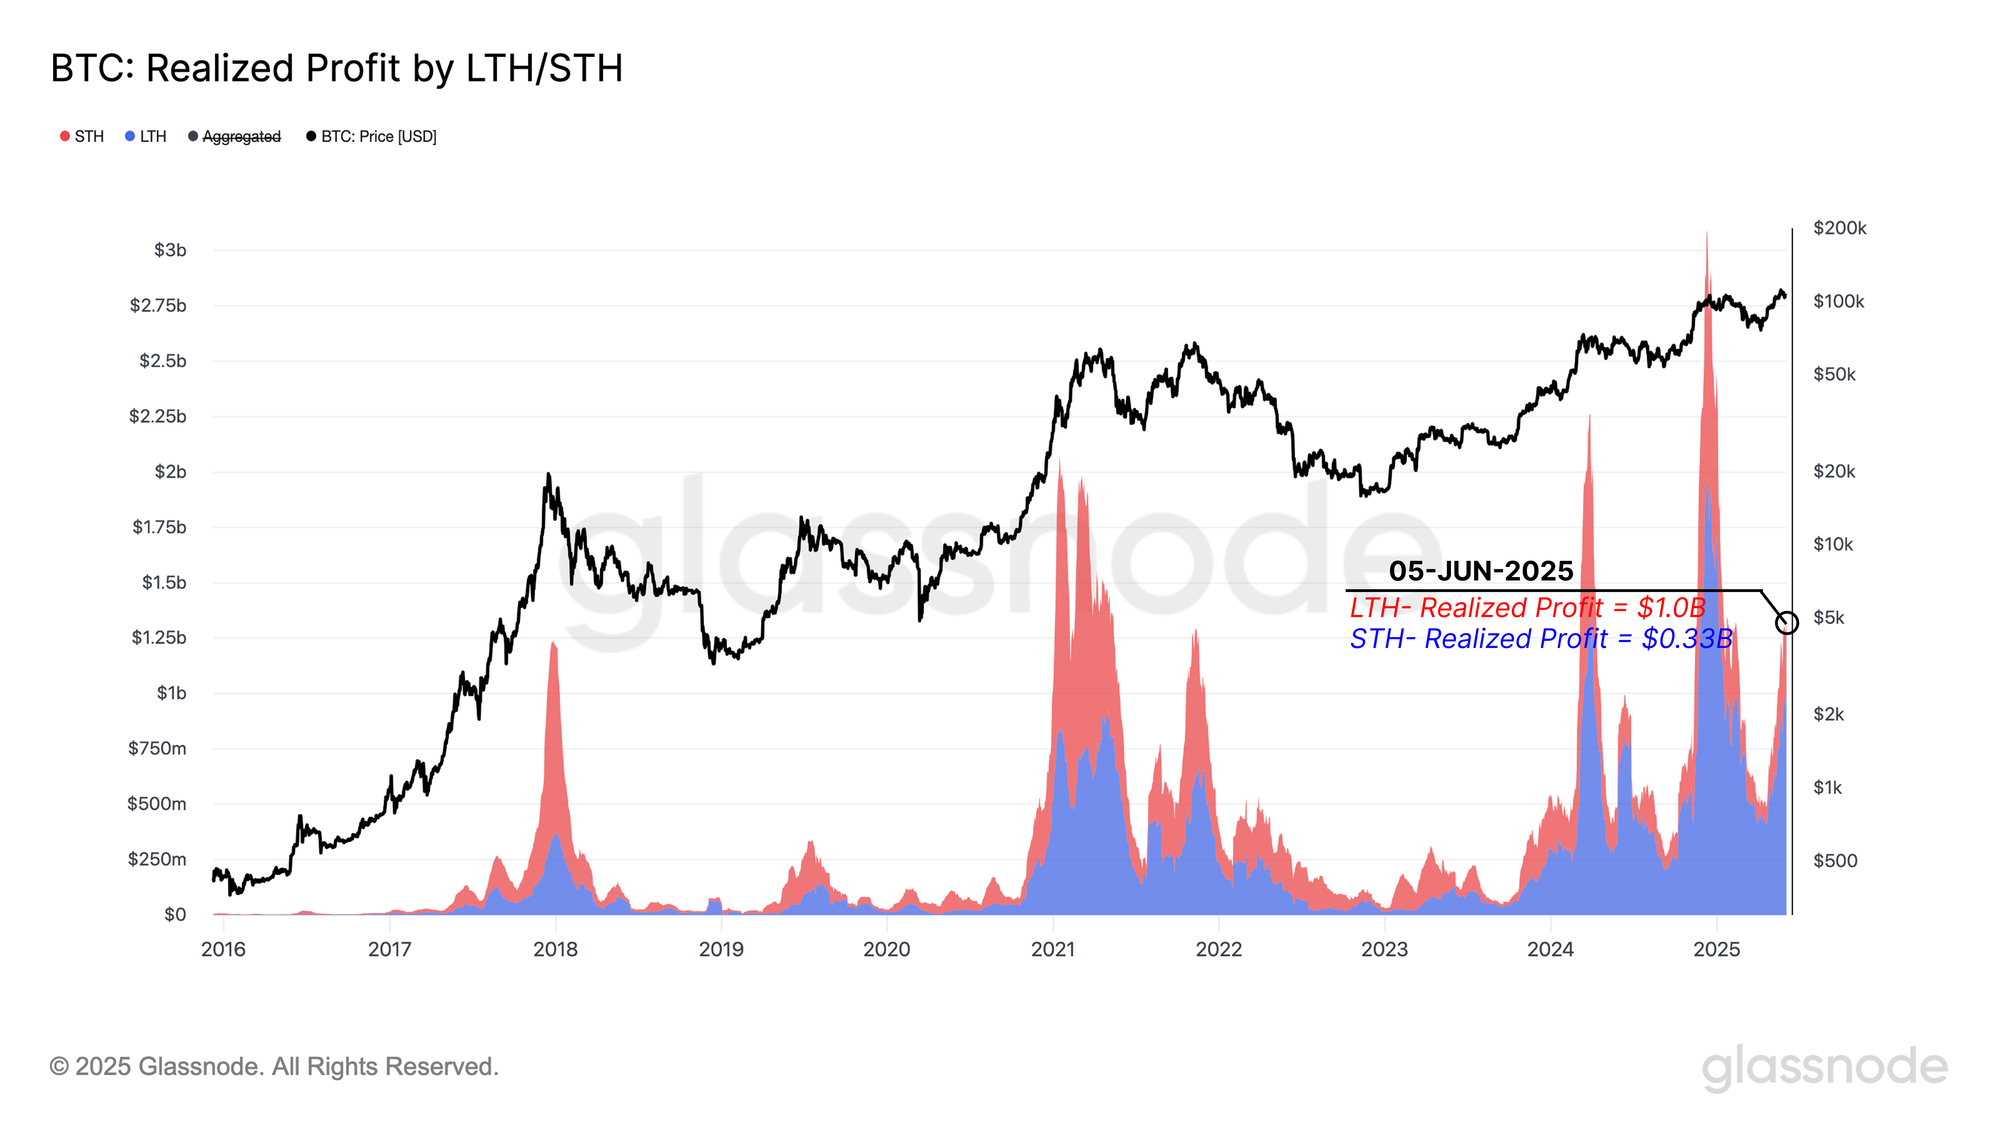
Since the 2015–2018 cycle, the share of realized profit attributed to long-term holders (LTHs) has steadily increased during euphoric market tops. This trend highlights a structural shift in market maturity, where more seasoned investors dominate capital rotation rather than fast-moving speculators.

At the most recent peak, the 30-day moving average of realized profit by LTHs surged to ~$1B per day, while short-term holders (STHs) realized just $0.32B per day. This marks a more than 3X difference, reinforcing that this wave of profit-taking is being led by older, higher-conviction investors.
Live Chart

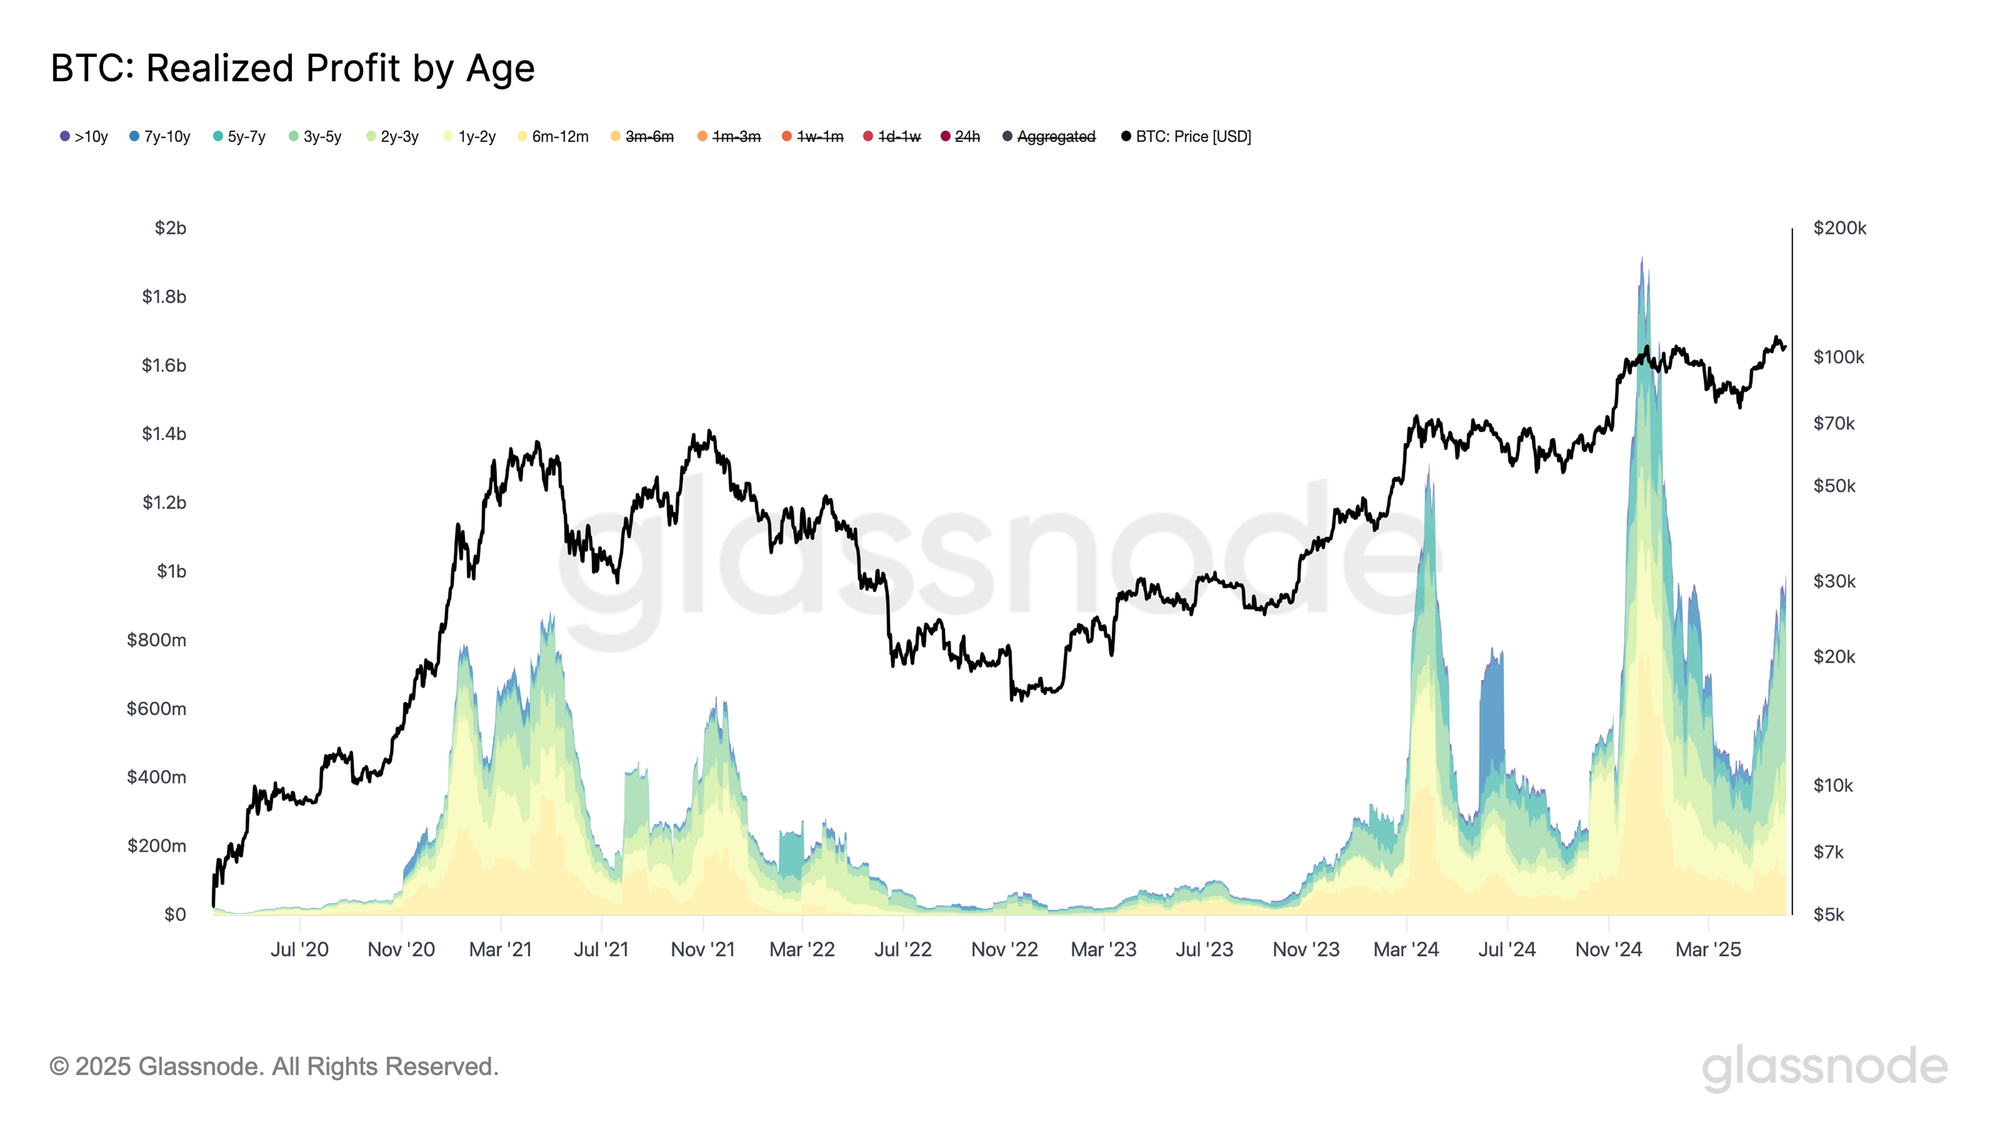
At first glance, the current ~$1B per day in realized profit by long-term holders (those holding >6 months) may seem modest compared to the $1.8B peak during the December 2024 top. However, a deeper breakdown reveals a familiar pattern.

Throughout bull markets, the 6–12 month holder cohort tends to contribute less to profit-taking as the cycle matures. This dynamic is playing out again in the current cycle. As the rally stretches, it's increasingly the older segments of long-term holders who are stepping in as dominant sellers, shaping what appears to be the top formation phase of this cycle.
Live Chart

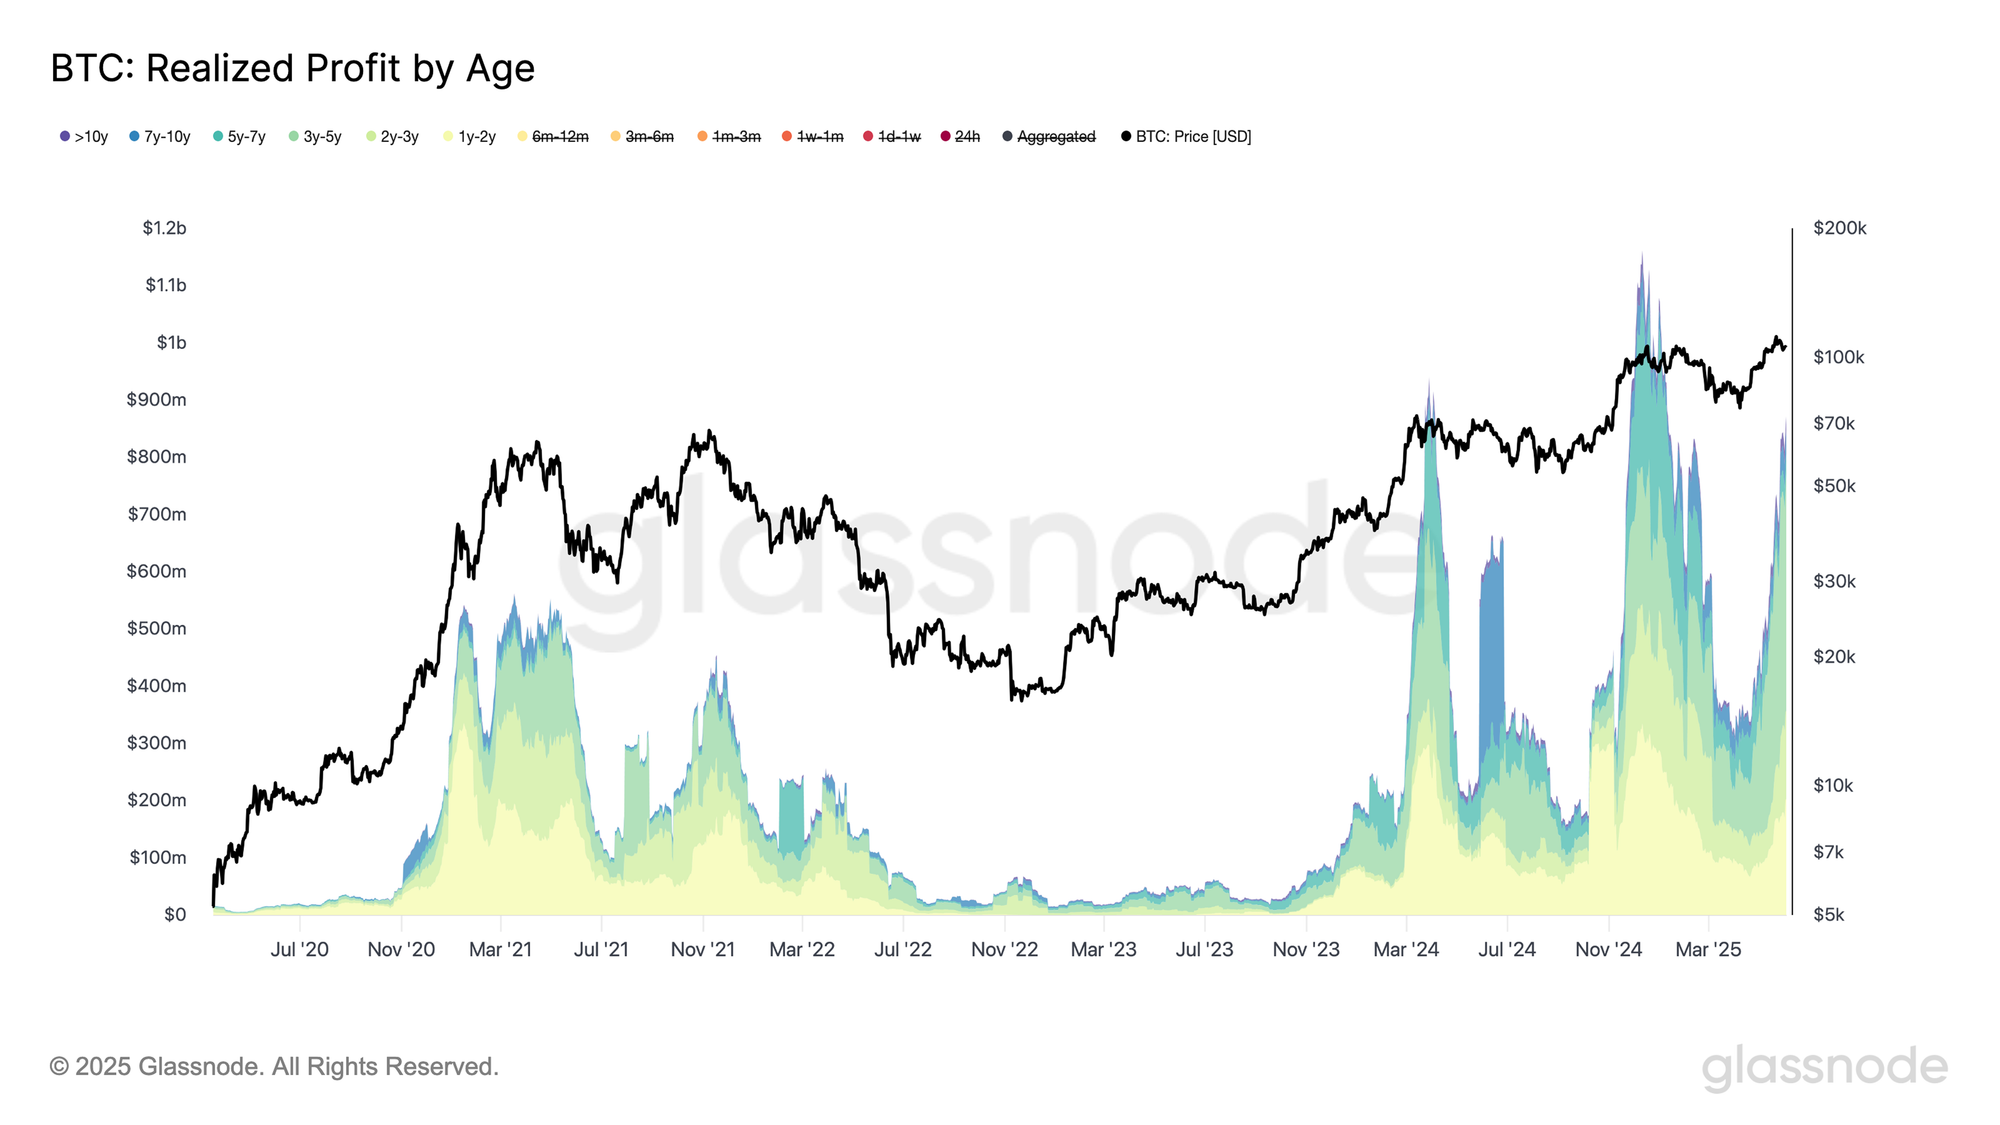
Therefore, by excluding the 6–12 month cohort from the total realized profit of long-term holders, we can better assess the true impact of seasoned investors on current market dynamics. This adjustment removes the influence of Q1 2025 top buyers, who have relatively limited unrealized gains, and focuses on those holding for over a year with deeper profit margins.

When isolating realized profit by >12-month holders, the significance of the current wave becomes more apparent. This cohort, often associated with conviction-driven investors, is now taking profits at scale, a behaviour that typically signals maturity or exhaustion in a bull trend.

This observation is in confluence with the earlier findings from the CBD Heatmap, which also pointed to older investors contributing most of the recent selling pressure, reinforcing the narrative that long-term holders are increasingly active in this top formation phase.
Live Chart

Conclusion

Bitcoin’s recent climb to a new all-time high of $111.8k has met growing resistance, as market data points to exhaustion from earlier buyers and profit-taking by long-standing holders. The CBD Heatmap shows that many of the strong accumulation zones from previous cycles have flipped into active selling regions, particularly among cohorts who bought in the >$25k and <$73k zones.

On-chain pricing models such as the Cost Basis Quantiles and Short-Term Holder statistical bands now define the immediate structure of the market. Key support levels at $103.7k and $95.6k will be critical to hold if demand falters, while the upper resistance band at $114.8k remains a test for renewed strength.

The profit realization regime is also showing signs of intensity, with daily profits peaking at $1.47B, primarily led by older long-term holders. This trend, along with the rising share of profit-taking from the >12-month cohort, suggests we may be witnessing a distribution phase rather than a fresh breakout.

Altogether, the market appears to be at a crossroads, shaped by elevated sell pressure, maturing bullish momentum, and demand that must prove itself resilient. The coming weeks will be crucial in determining whether this is a mid-cycle consolidation or the start of a broader top formation.


Disclaimer: This report does not provide any investment advice. All data is provided for informational, and educational purposes only. No investment decision shall be based on the information provided here and you are solely responsible for your own investment decisions.

Exchange balances presented are derived from Glassnode’s comprehensive database of address labels, which are amassed through both officially published exchange information and proprietary clustering algorithms. While we strive to ensure the utmost accuracy in representing exchange balances, it is important to note that these figures might not always encapsulate the entirety of an exchange’s reserves, particularly when exchanges refrain from disclosing their official addresses. We urge users to exercise caution and discretion when utilizing these metrics. Glassnode shall not be held responsible for any discrepancies or potential inaccuracies. 

Please read our Transparency Notice when using exchange data.


Criptomoedas em alta

Leituras Relacionadas

From Transaction Fees to Stablecoins: The Revenue Drivers and Economic Moats Behind Web3 Business Models

"From Transaction Fees to Stablecoins: Revenue Drivers and Moats in Verified Web3 Business Models" This analysis explores five established Web3 revenue models, examining their drivers and long-term sustainability. 1. **Transaction Fees**: This model is highly cyclical, with income tied to market activity and user risk appetite (formula: volume × fee rate). Growth depends on expanding the market, gaining market share, and maintaining stable fees amid intense competition. 2. **Stablecoin Reserve Yield**: Revenue stems from the scale of issued stablecoins and the interest earned on their underlying reserves (like US Treasuries). While predictable with strong moats (high user migration costs), growth is tied to adoption as on-chain dollar infrastructure and is sensitive to interest rate cycles. 3. **Funding Rate Arbitrage & Lending Spreads**: Protocols like Aave and Ethena profit from capital supply-demand imbalances. Similar to transaction fees, this model is cyclical and driven by user leverage demand during bullish market phases. 4. **Block Space Sales**: Chains sell computational resources (formula: demand × gas price). A key challenge is the ongoing decline in gas fees due to technological advances and competition among L1s and L2s. Future viability hinges on whether demand growth can offset falling unit prices. 5. **Protocol-Level Service Fees**: Similar to SaaS, this model involves charging other protocols for essential services (e.g., oracles like Chainlink). Revenue scales with ecosystem adoption. The primary moat is high switching costs once integrated, making market leadership crucial. In summary: Transaction fees and funding spreads are highly cyclical. Stablecoin yields and protocol services build strong, durable moats. Block space sales face the structural challenge of perpetually declining unit revenue despite growing demand.

marsbitHá 1h

From Transaction Fees to Stablecoins: The Revenue Drivers and Economic Moats Behind Web3 Business Models

marsbitHá 1h

Trading

Spot

Artigos em Destaque

O que é BITCOIN

Compreender o HarryPotterObamaSonic10Inu (ERC-20) e a Sua Posição no Espaço Cripto Nos últimos anos, o mercado de criptomoedas assistiu a um aumento na popularidade das moedas meme, cativando não apenas os traders, mas também aqueles que procuram envolvimento comunitário e valor de entretenimento. Entre estes tokens únicos está o HarryPotterObamaSonic10Inu (ERC-20), um projeto intrigante que mistura referências culturais no tecido das criptomoedas. Este artigo explora os principais aspetos do HarryPotterObamaSonic10Inu, examinando os seus mecanismos, a sua ética orientada pela comunidade e o seu envolvimento com o vasto panorama cripto. O que é o HarryPotterObamaSonic10Inu (ERC-20)? Como o nome sugere, o HarryPotterObamaSonic10Inu é uma moeda meme construída na blockchain Ethereum, classificada sob o padrão ERC-20. Ao contrário das criptomoedas tradicionais, que podem enfatizar a utilidade prática ou o potencial de investimento, este token prospera no valor de entretenimento e na força da sua comunidade. O projeto visa promover um ambiente onde utilizadores envolvidos possam reunir-se, partilhar ideias e participar em atividades inspiradas por diversos fenómenos culturais. Uma característica notável do HarryPotterObamaSonic10Inu é a zero taxa sobre transações. Este elemento atraente visa encorajar a negociação e o envolvimento da comunidade, isento de encargos adicionais que podem desencorajar os traders de pequena escala. A oferta total da moeda está fixada em mil milhões de tokens, uma cifra que marca a sua intenção de manter uma circulação substancial dentro da comunidade. Criador do HarryPotterObamaSonic10Inu (ERC-20) As origens do HarryPotterObamaSonic10Inu estão um pouco envoltas em mistério; os detalhes sobre o criador permanecem desconhecidos. O desenvolvimento deste token carece de uma equipa identificável ou de um plano explícito, o que não é raro no setor das moedas meme. Em vez disso, o projeto surgiu de forma orgânica, com o seu progresso a depender fortemente do entusiasmo e da participação da sua comunidade. Investidores do HarryPotterObamaSonic10Inu (ERC-20) No que diz respeito a investimentos externos e apoios, o HarryPotterObamaSonic10Inu também permanece ambíguo. O token não lista quaisquer fundações de investimento conhecidas ou apoio organizacional significativo. Em vez disso, o “sangue vital” do projeto é a sua comunidade de base, que informa o seu crescimento e sustentabilidade através da ação coletiva e do envolvimento no espaço cripto. Como Funciona o HarryPotterObamaSonic10Inu (ERC-20)? Como uma moeda meme, o HarryPotterObamaSonic10Inu opera principalmente fora dos quadros tradicionais que muitas vezes governam o valor dos ativos. Existem vários aspetos distintivos que definem como o projeto funciona: Transações Sem Taxas: Sem taxas sobre transações, os utilizadores podem comprar e vender o token livremente, sem a preocupação de custos ocultos. Envolvimento da Comunidade: O projeto prospera na interação da comunidade, aproveitando plataformas de redes sociais para criar entusiasmo e facilitar a participação. Discussões, partilha de conteúdo e envolvimento são elementos cruciais que ajudam a expandir o seu alcance e a fomentar a lealdade entre os apoiantes. Sem Utilidade Prática: Deve ser notado que o HarryPotterObamaSonic10Inu não oferece utilidade concreta dentro do ecossistema financeiro. Em vez disso, é classificado como um token principalmente para entretenimento e atividades comunitárias. Referência Cultural: O token incorpora de forma inteligente elementos da cultura popular para atrair interesse, conectando-se tanto com entusiastas de memes como com seguidores de criptomoedas. HarryPotterObamaSonic10Inu exemplifica como as moedas meme operam de forma diferente de projetos de criptomoedas mais tradicionais, entrando no mercado como construções sociais inovadoras em vez de ativos utilitários. Linha do Tempo do HarryPotterObamaSonic10Inu (ERC-20) A história do HarryPotterObamaSonic10Inu é marcada por vários marcos notáveis: Criação: O token surgiu de um meme viral, capturando a imaginação de muitos entusiastas de criptomoedas. Datas específicas de criação não estão disponíveis, sublinhando a sua ascensão orgânica. Listagem em Exchanges: O HarryPotterObamaSonic10Inu conseguiu entrar em várias exchanges, permitindo um acesso e negociação mais fáceis pela comunidade. Iniciativas de Envolvimento da Comunidade: Atividades contínuas direcionadas a melhorar a interação comunitária, incluindo concursos, campanhas em redes sociais e geração de conteúdo por fãs e defensores. Planos de Expansão Futura: O roteiro do projeto inclui o lançamento de uma coleção de NFTs, mercadorias e um site de eCommerce relacionado aos seus temas culturais, envolvendo ainda mais a comunidade e tentando adicionar mais dimensões ao seu ecossistema. Pontos-Chave sobre o HarryPotterObamaSonic10Inu (ERC-20) Natureza Orientada pela Comunidade: O projeto prioriza a contribuição coletiva e a criatividade, assegurando que o envolvimento dos utilizadores está na vanguarda do seu desenvolvimento. Classificação como Moeda Meme: Representa o epítome da criptomoeda baseada em entretenimento, destacando-se dos veículos de investimento tradicionais. Sem Afiliação Direta com o Bitcoin: Apesar da semelhança no nome do ticker, o HarryPotterObamaSonic10Inu é distinto e não tem qualquer relação com o Bitcoin ou outras criptomoedas estabelecidas. Foco na Colaboração: O HarryPotterObamaSonic10Inu é projetado para criar um espaço de colaboração e partilha de histórias entre os seus detentores, proporcionando uma via para a criatividade e o fortalecimento da comunidade. Perspectivas Futuras: A ambição de expandir além da sua premissa inicial para NFTs e mercadorias delineia um caminho para o projeto potencialmente entrar em avenidas mais mainstream dentro da cultura digital. À medida que as moedas meme continuam a capturar a imaginação da comunidade cripto, HarryPotterObamaSonic10Inu (ERC-20) destaca-se devido aos seus laços culturais e abordagem centrada na comunidade. Embora possa não se encaixar no molde típico de um token orientado para utilidade, a sua essência reside na alegria e camaradagem fomentadas entre os seus apoiantes, destacando a natureza em evolução das criptomoedas em uma era cada vez mais digital. À medida que o projeto continua a desenvolver-se, será importante observar como as dinâmicas comunitárias influenciam a sua trajetória no panorama em constante mudança da tecnologia blockchain.

1.7k Visualizações TotaisPublicado em {updateTime}Atualizado em 2024.12.03

O que é BITCOIN

Como comprar BTC

Bem-vindo à HTX.com!Tornámos a compra de Bitcoin (BTC) simples e conveniente.Segue o nosso guia passo a passo para iniciar a tua jornada no mundo das criptos.Passo 1: cria a tua conta HTXUtiliza o teu e-mail ou número de telefone para te inscreveres numa conta gratuita na HTX.Desfruta de um processo de inscrição sem complicações e desbloqueia todas as funcionalidades.Obter a minha contaPasso 2: vai para Comprar Cripto e escolhe o teu método de pagamentoCartão de crédito/débito: usa o teu visa ou mastercard para comprar Bitcoin (BTC) instantaneamente.Saldo: usa os fundos da tua conta HTX para transacionar sem problemas.Terceiros: adicionamos métodos de pagamento populares, como Google Pay e Apple Pay, para aumentar a conveniência.P2P: transaciona diretamente com outros utilizadores na HTX.Mercado de balcão (OTC): oferecemos serviços personalizados e taxas de câmbio competitivas para os traders.Passo 3: armazena teu Bitcoin (BTC)Depois de comprar o teu Bitcoin (BTC), armazena-o na tua conta HTX.Alternativamente, podes enviá-lo para outro lugar através de transferência blockchain ou usá-lo para transacionar outras criptomoedas.Passo 4: transaciona Bitcoin (BTC)Transaciona facilmente Bitcoin (BTC) no mercado à vista da HTX.Acede simplesmente à tua conta, seleciona o teu par de trading, executa as tuas transações e monitoriza em tempo real.Oferecemos uma experiência de fácil utilização tanto para principiantes como para traders experientes.

4.2k Visualizações TotaisPublicado em {updateTime}Atualizado em 2026.06.02

Como comprar BTC

O que é $BITCOIN

OURO DIGITAL ($BITCOIN): Uma Análise Abrangente Introdução ao OURO DIGITAL ($BITCOIN) OURO DIGITAL ($BITCOIN) é um projeto baseado em blockchain que opera na rede Solana, com o objetivo de combinar as características dos metais preciosos tradicionais com a inovação das tecnologias descentralizadas. Embora partilhe um nome com o Bitcoin, frequentemente referido como “ouro digital” devido à sua percepção como uma reserva de valor, o OURO DIGITAL é um token separado projetado para criar um ecossistema único dentro da paisagem Web3. O seu objetivo é posicionar-se como um ativo digital alternativo viável, embora os detalhes sobre as suas aplicações e funcionalidades ainda estejam em desenvolvimento. O que é o OURO DIGITAL ($BITCOIN)? OURO DIGITAL ($BITCOIN) é um token de criptomoeda explicitamente projetado para uso na blockchain Solana. Em contraste com o Bitcoin, que fornece um papel amplamente reconhecido como armazenamento de valor, este token parece focar em aplicações e características mais amplas. Aspectos notáveis incluem: Infraestrutura Blockchain: O token é construído na blockchain Solana, conhecida pela sua capacidade de lidar com transações de alta velocidade e baixo custo. Dinâmicas de Oferta: O OURO DIGITAL tem um fornecimento máximo limitado a 100 quatrilhões de tokens (100P $BITCOIN), embora os detalhes sobre o seu fornecimento circulante ainda não tenham sido divulgados. Utilidade: Embora as funcionalidades precisas não estejam explicitamente delineadas, existem indicações de que o token poderia ser utilizado para várias aplicações, potencialmente envolvendo aplicações descentralizadas (dApps) ou estratégias de tokenização de ativos. Quem é o Criador do OURO DIGITAL ($BITCOIN)? Neste momento, a identidade dos criadores e da equipa de desenvolvimento por trás do OURO DIGITAL ($BITCOIN) permanece desconhecida. Esta situação é típica entre muitos projetos inovadores no espaço da blockchain, particularmente aqueles alinhados com finanças descentralizadas e fenómenos de moedas meme. Embora tal anonimato possa fomentar uma cultura orientada pela comunidade, intensifica as preocupações sobre governança e responsabilidade. Quem são os Investidores do OURO DIGITAL ($BITCOIN)? As informações disponíveis indicam que o OURO DIGITAL ($BITCOIN) não tem apoiantes institucionais conhecidos ou investimentos proeminentes de capital de risco. O projeto parece operar num modelo peer-to-peer focado no apoio e adoção da comunidade, em vez de rotas de financiamento tradicionais. A sua atividade e liquidez estão principalmente situadas em exchanges descentralizadas (DEXs), como a PumpSwap, em vez de plataformas de negociação centralizadas estabelecidas, destacando ainda mais a sua abordagem de base. Como Funciona o OURO DIGITAL ($BITCOIN) A mecânica operacional do OURO DIGITAL ($BITCOIN) pode ser elaborada com base no seu design de blockchain e nas características da rede: Mecanismo de Consenso: Ao aproveitar o exclusivo proof-of-history (PoH) da Solana combinado com um modelo de proof-of-stake (PoS), o projeto assegura uma validação eficiente das transações, contribuindo para o alto desempenho da rede. Tokenomics: Embora mecanismos deflacionários específicos não tenham sido extensivamente detalhados, o vasto fornecimento máximo de tokens implica que pode atender a microtransações ou casos de uso de nicho que ainda estão por definir. Interoperabilidade: Existe o potencial para integração com o ecossistema mais amplo da Solana, incluindo várias plataformas de finanças descentralizadas (DeFi). No entanto, os detalhes sobre integrações específicas permanecem não especificados. Cronologia de Eventos Chave Aqui está uma cronologia que destaca marcos significativos relacionados ao OURO DIGITAL ($BITCOIN): 2023: O lançamento inicial do token ocorre na blockchain Solana, marcado pelo seu endereço de contrato. 2024: O OURO DIGITAL ganha visibilidade ao tornar-se disponível para negociação em exchanges descentralizadas como a PumpSwap, permitindo que os utilizadores o negociem contra SOL. 2025: O projeto testemunha atividade de negociação esporádica e potencial interesse em envolvimentos liderados pela comunidade, embora não tenham sido documentadas parcerias ou avanços técnicos notáveis até ao momento. Análise Crítica Forças Escalabilidade: A infraestrutura subjacente da Solana suporta altos volumes de transações, o que pode aumentar a utilidade do $BITCOIN em vários cenários de transação. Acessibilidade: O potencial preço de negociação baixo por token pode atrair investidores de retalho, facilitando uma participação mais ampla devido a oportunidades de propriedade fracionada. Riscos Falta de Transparência: A ausência de apoiantes, desenvolvedores ou um processo de auditoria publicamente conhecidos pode gerar ceticismo em relação à sustentabilidade e confiabilidade do projeto. Volatilidade do Mercado: A atividade de negociação depende fortemente do comportamento especulativo, o que pode resultar em volatilidade significativa dos preços e incerteza para os investidores. Conclusão O OURO DIGITAL ($BITCOIN) surge como um projeto intrigante, mas ambíguo, dentro do ecossistema em rápida evolução da Solana. Embora tente aproveitar a narrativa do “ouro digital”, a sua divergência do papel estabelecido do Bitcoin como reserva de valor sublinha a necessidade de uma diferenciação mais clara da sua utilidade pretendida e estrutura de governança. A aceitação e adoção futuras dependerão provavelmente da abordagem da atual opacidade e da definição mais explícita das suas estratégias operacionais e económicas. Nota: Este relatório abrange informações sintetizadas disponíveis até outubro de 2023, e desenvolvimentos podem ter ocorrido além do período de pesquisa.

127 Visualizações TotaisPublicado em {updateTime}Atualizado em 2025.05.13

O que é $BITCOIN

Discussões

Bem-vindo à Comunidade HTX. Aqui, pode manter-se informado sobre os mais recentes desenvolvimentos da plataforma e obter acesso a análises profissionais de mercado. As opiniões dos utilizadores sobre o preço de BTC (BTC) são apresentadas abaixo.

活动图片